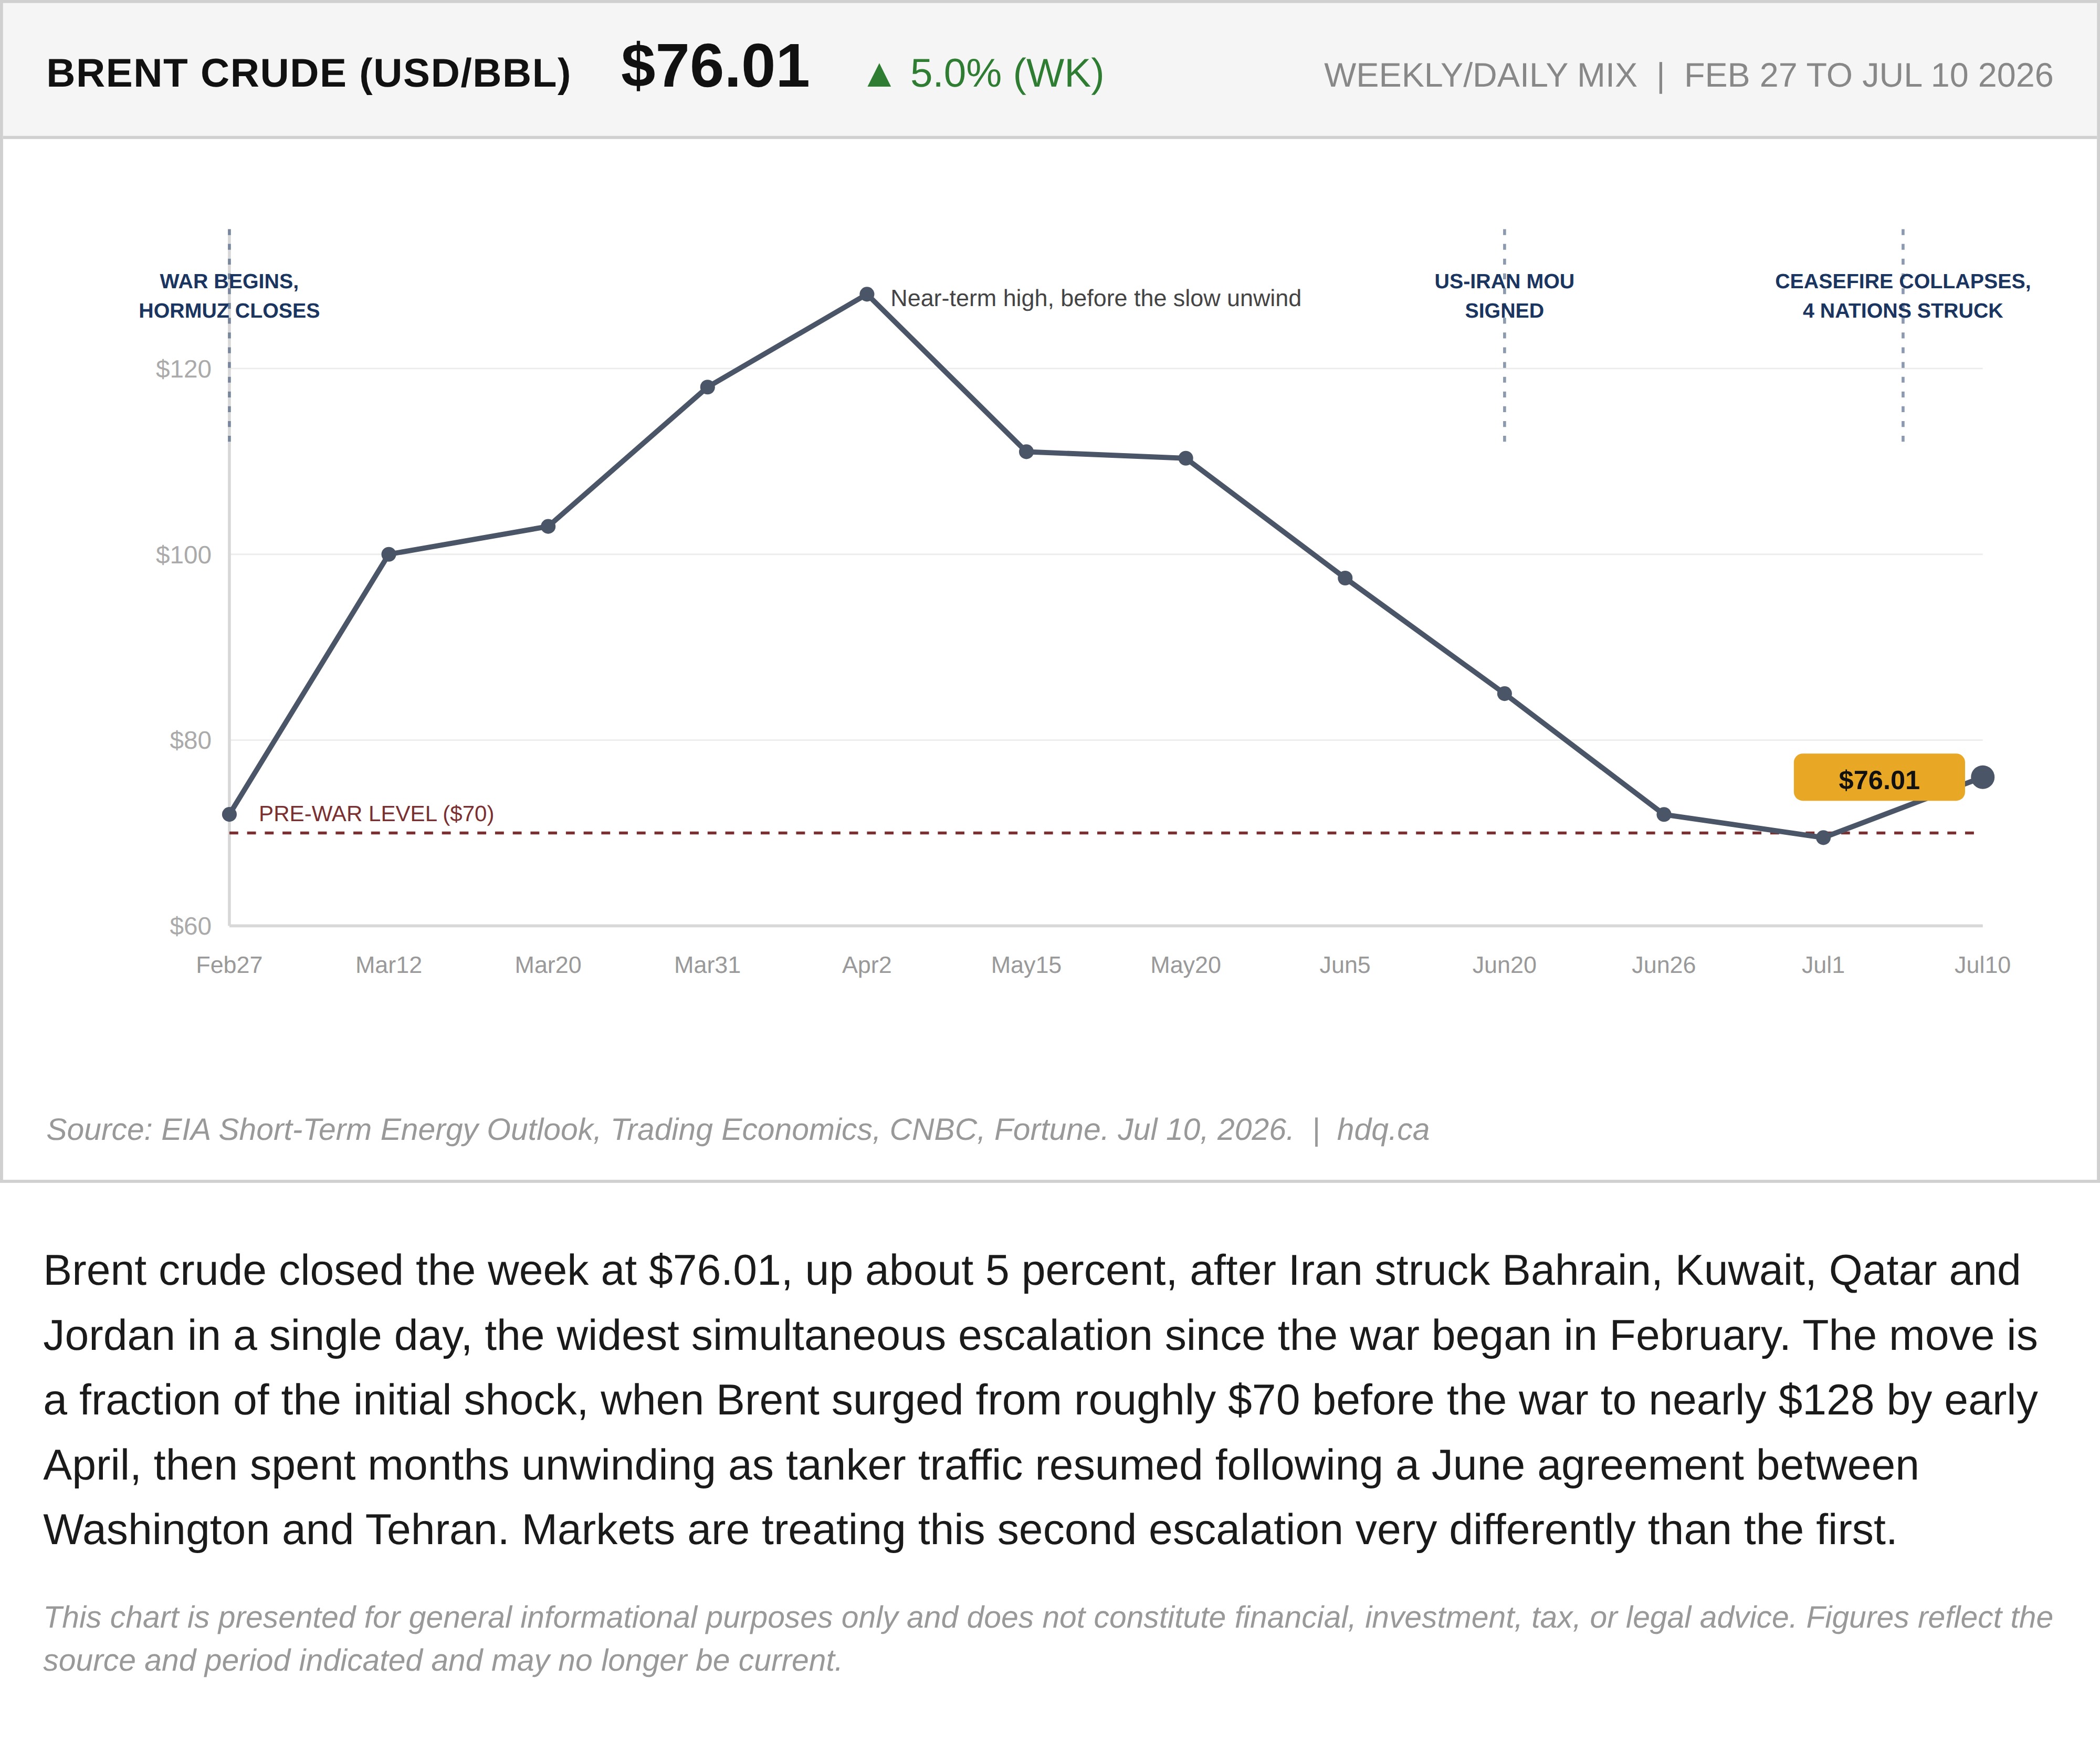
Brent crude closed the week at $76.01, up about 5 percent, after Iran struck Bahrain, Kuwait, Qatar and Jordan in a single day, the widest simultaneous escalation since the war began in February. The move is a fraction of the initial shock, when Brent surged from roughly $70 before the war to nearly $128 by early April, then spent months unwinding as tanker traffic resumed following a June agreement between Washington and Tehran. Markets are treating this second escalation very differently than the first.
This chart is presented for general informational purposes only and does not constitute financial, investment, tax, or legal advice. Figures reflect the source and period indicated and may no longer be current.

Related charts
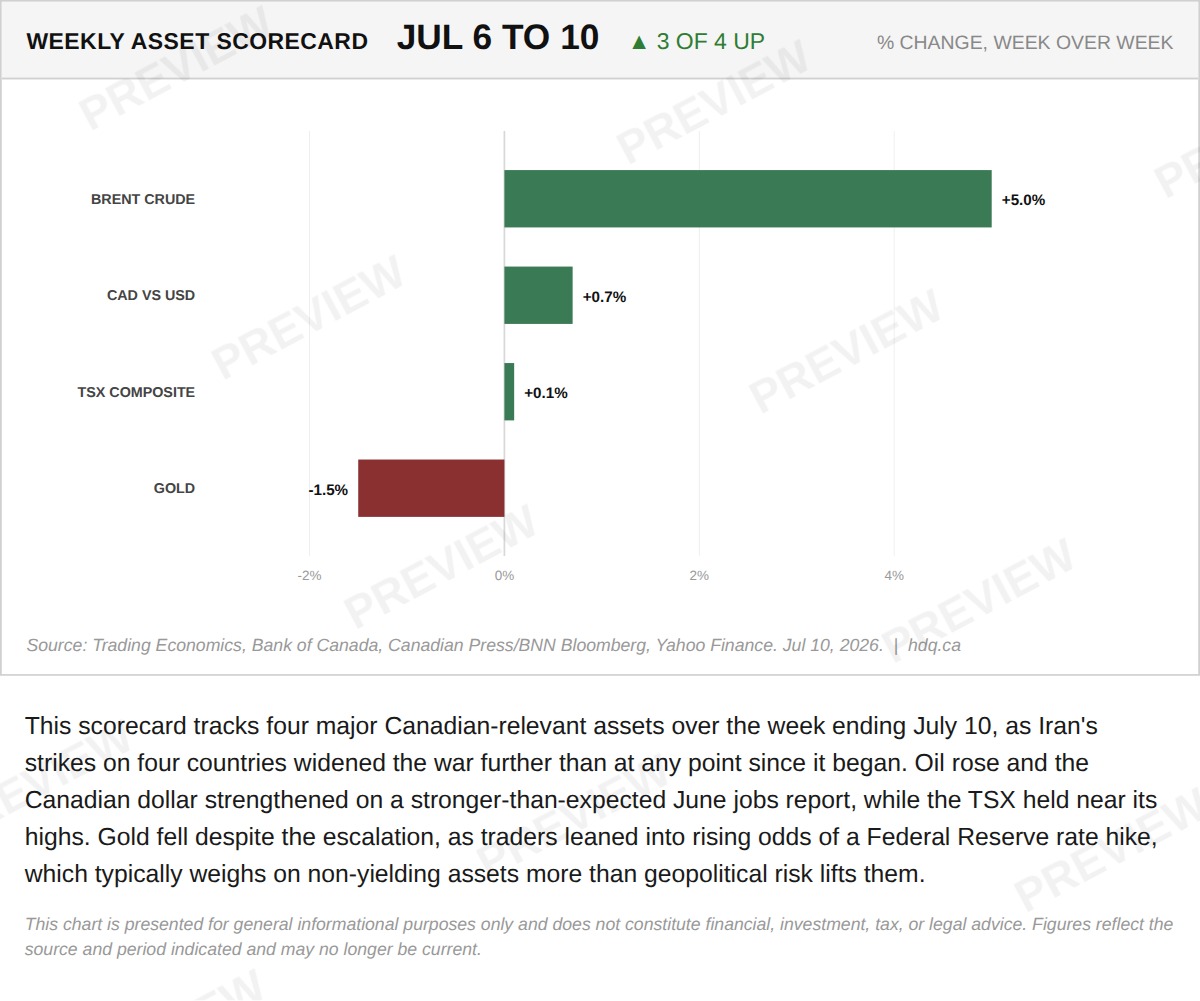
This scorecard tracks four major Canadian-relevant assets over the week ending July 10, as Iran's strikes on four countries widened the war further than at any point since it began.
Weekly scorecard: Brent, CAD and TSX rise as gold falls despite widening war
July 11, 2026
View chart & download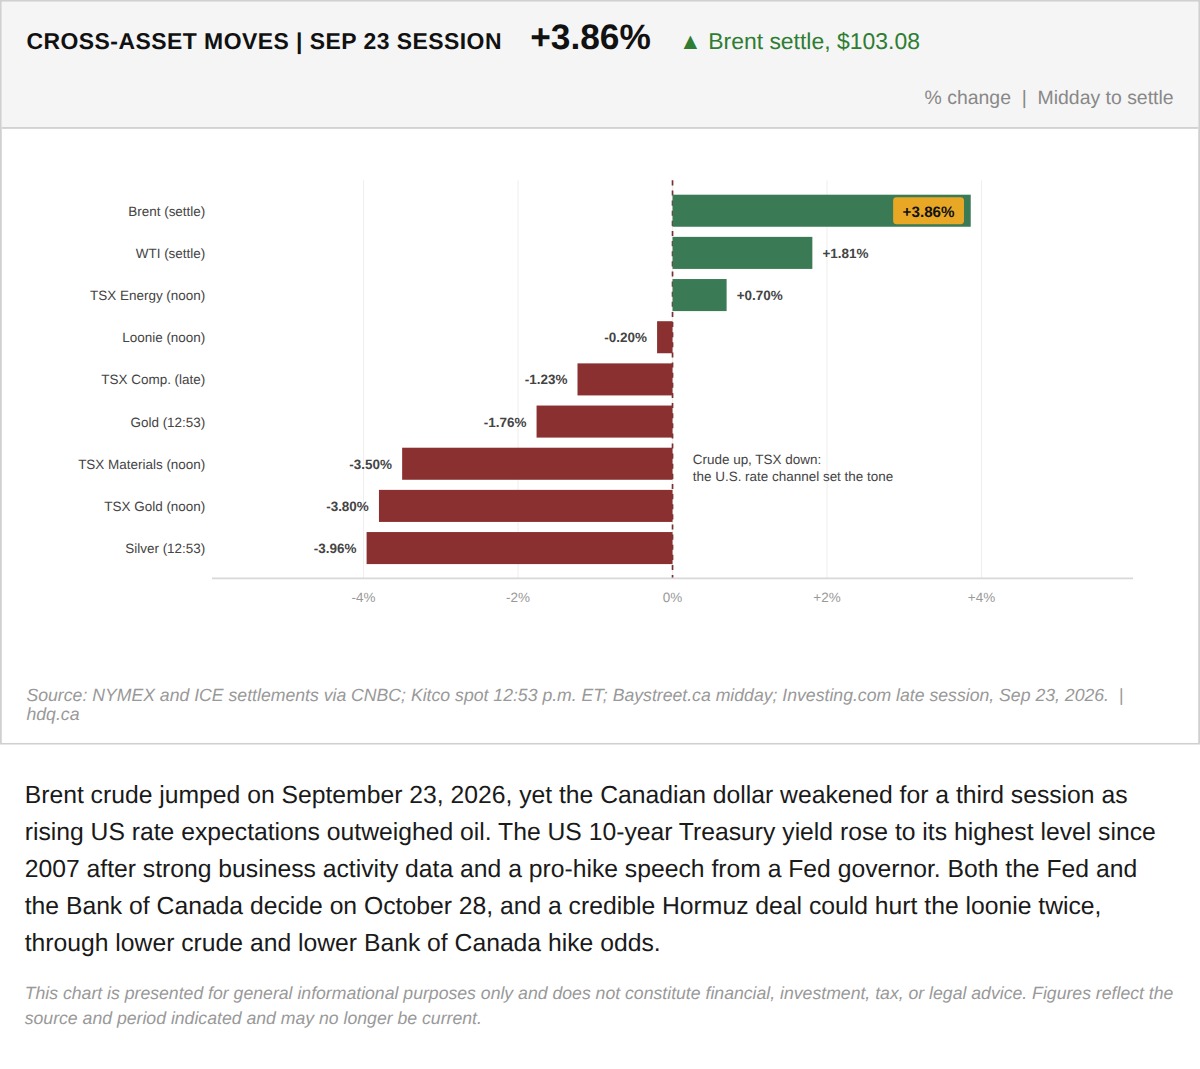
Brent crude jumped on September 23, 2026, yet the Canadian dollar weakened for a third session as rising US rate expectations outweighed oil.
Brent Jumps While the Canadian Dollar and TSX Fall in the September 23 Session
September 23, 2026
View chart & download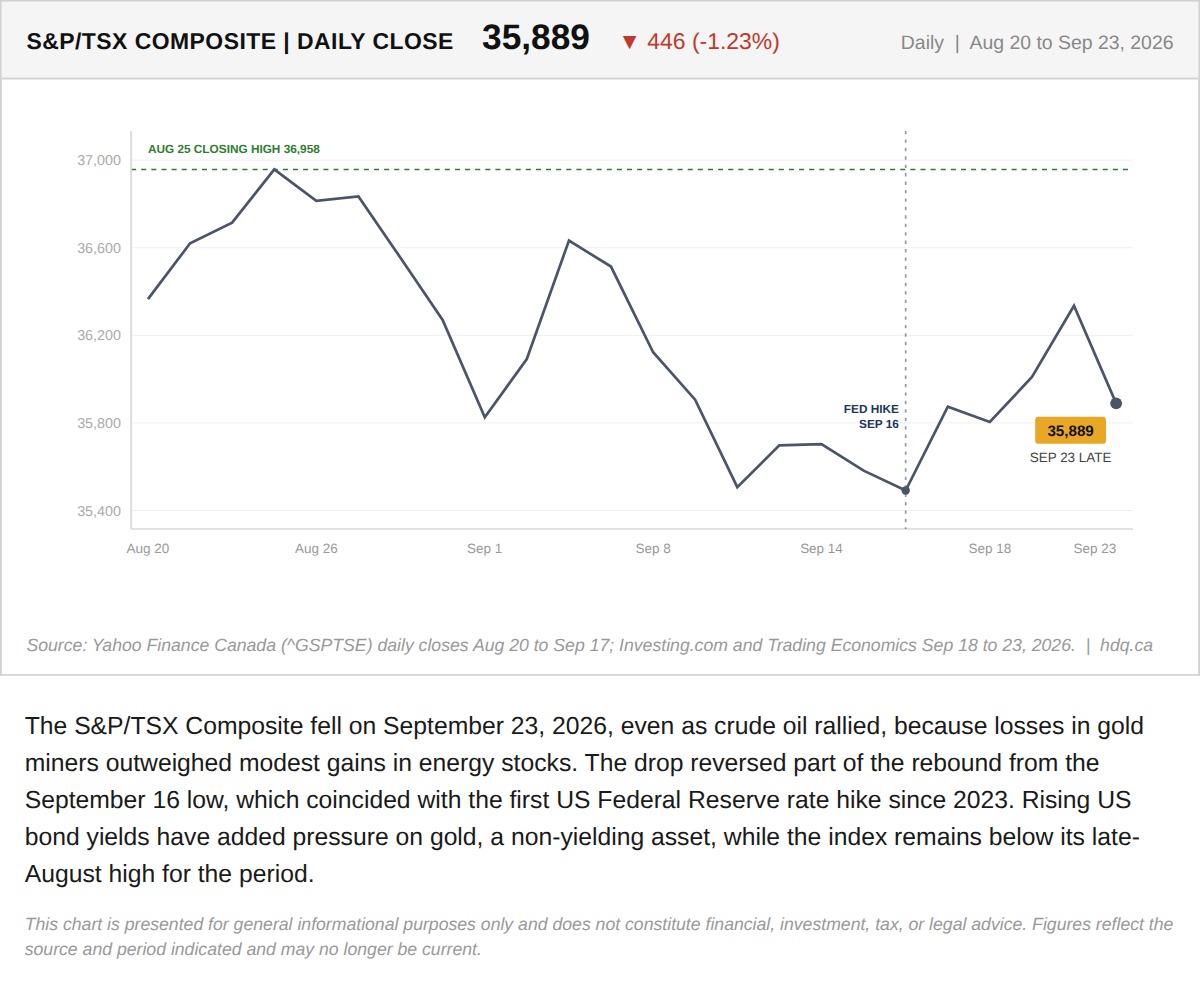
The S&P/TSX Composite fell on September 23, 2026, even as crude oil rallied, because losses in gold miners outweighed modest gains in energy stocks.
TSX Composite Falls Despite an Oil Rally as Gold Stocks Slide
September 23, 2026
View chart & download
The S&P/TSX Composite closed July at 35,226, up 1.06% for the month, a modest headline figure that conceals sharp intra-month swings.
S&P/TSX Composite closes July up 1.06% after a volatile month
July 31, 2026
View chart & download
Brent and WTI crude both surged in July, with WTI ending the month at $85.47, up 23.0%, after round-tripping from a five-month low near $68.74.
WTI and Brent crude surge in July as the Iran ceasefire collapses
July 31, 2026
View chart & download
Brent was the only one of the three to finish above its starting level, while the index and gold both fell.
Brent, TSX and Gold Rebased to the August 31 Close
September 30, 2026
View chart & download