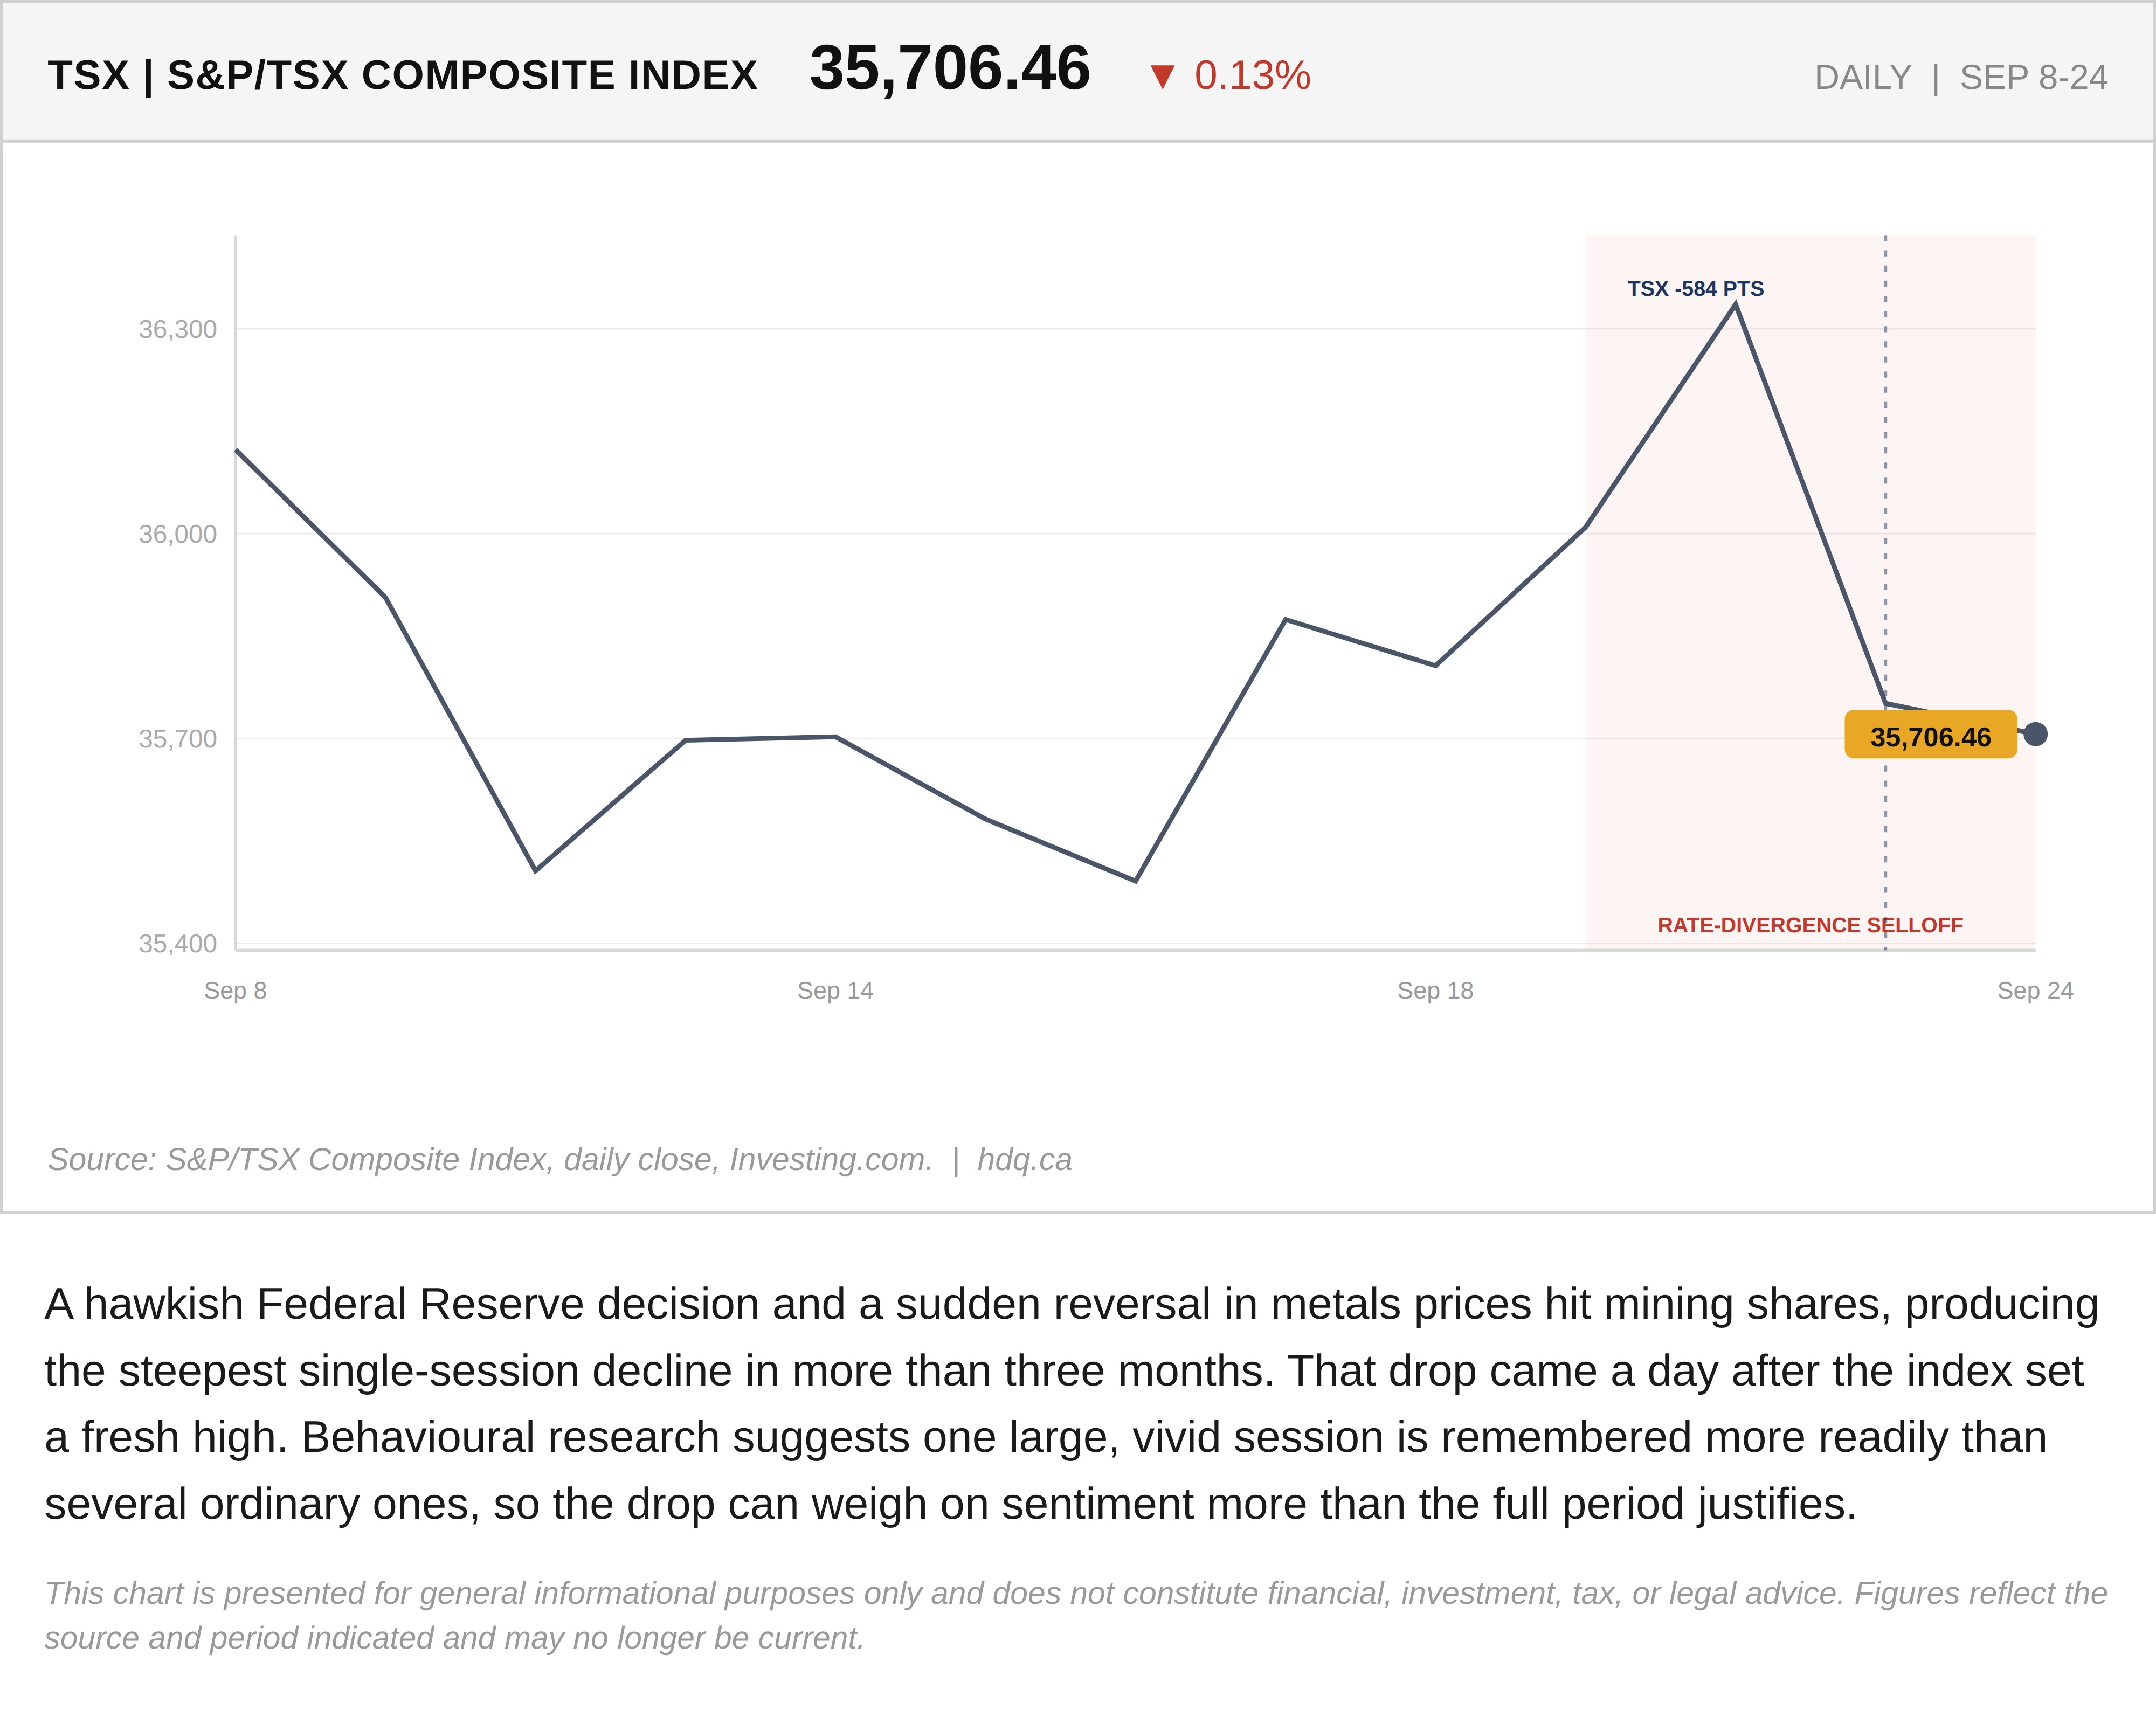
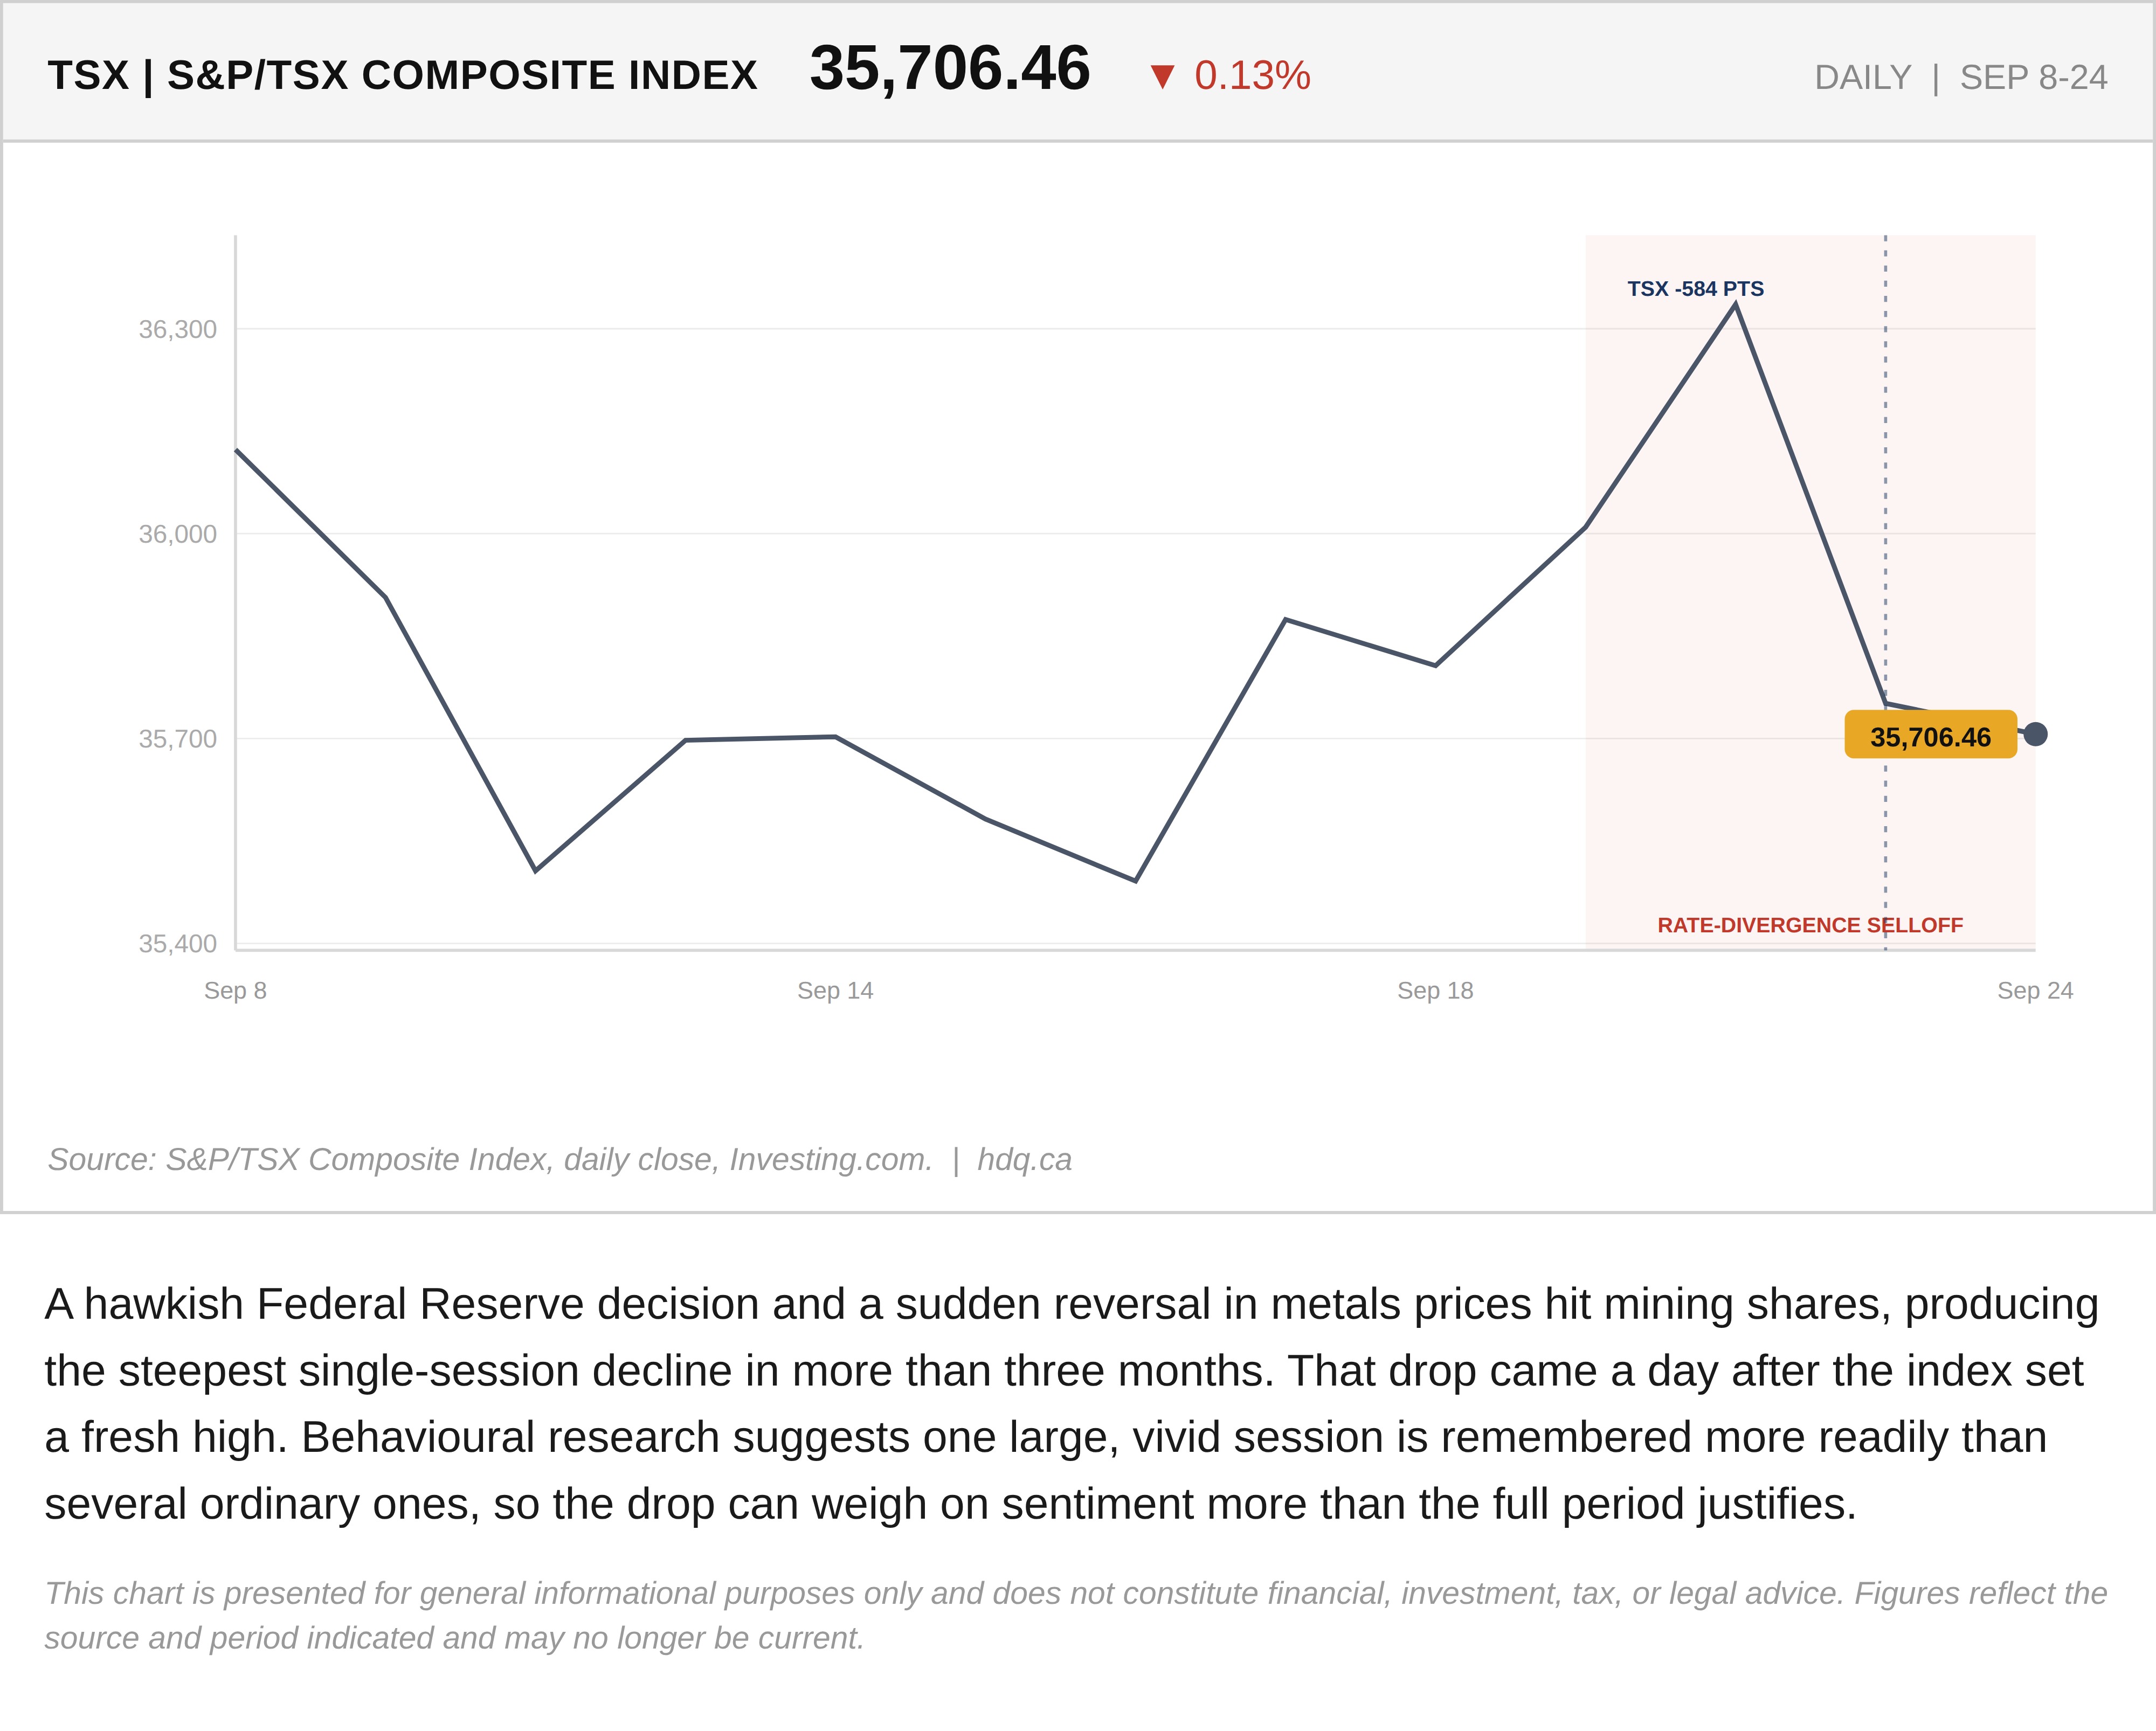
A hawkish Federal Reserve decision and a sudden reversal in metals prices hit mining shares, producing the steepest single-session decline in more than three months. That drop came a day after the index set a fresh high. Behavioural research suggests one large, vivid session is remembered more readily than several ordinary ones, so the drop can weigh on sentiment more than the full period justifies.
This chart is presented for general informational purposes only and does not constitute financial, investment, tax, or legal advice. Figures reflect the source and period indicated and may no longer be current.
Related charts
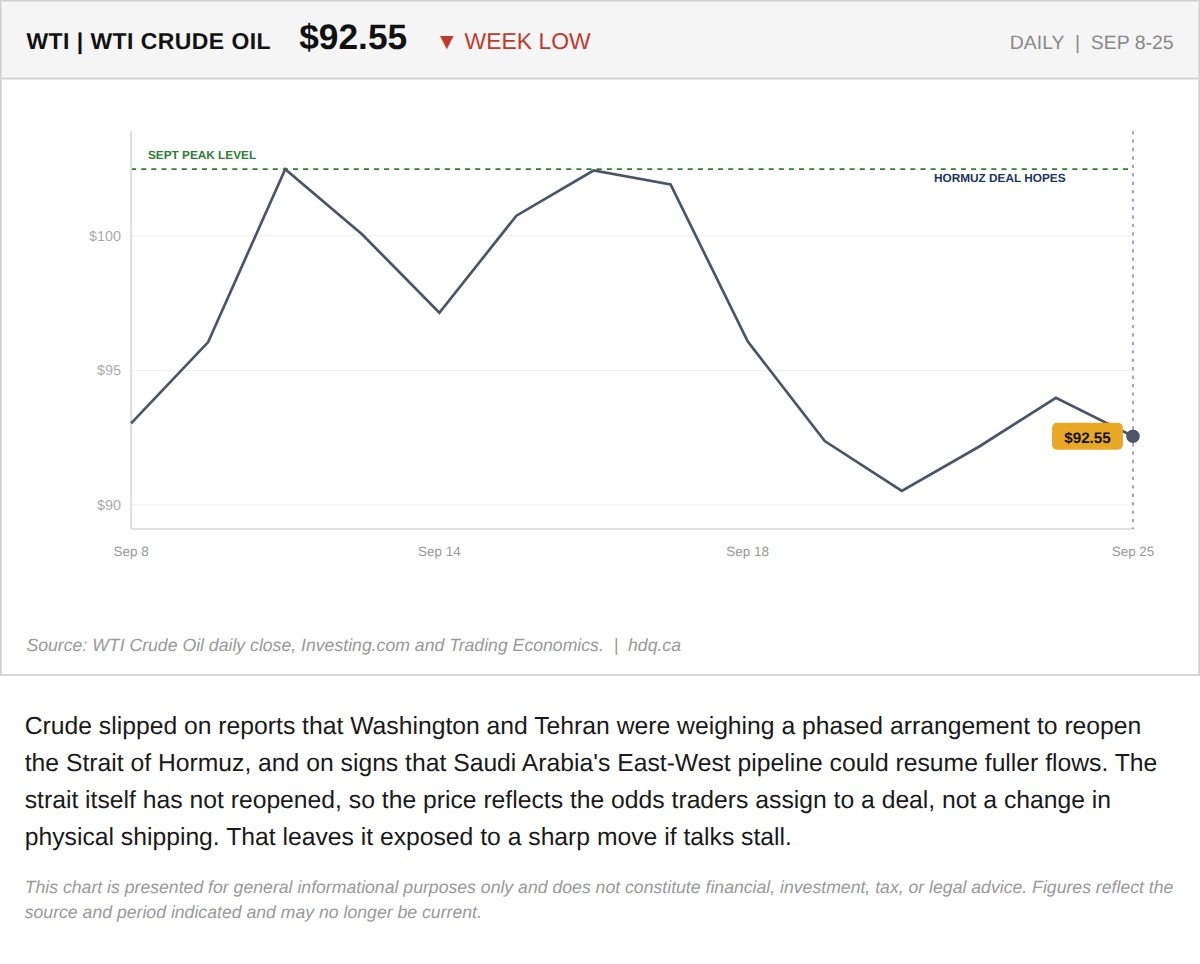
Crude slipped on reports that Washington and Tehran were weighing a phased arrangement to reopen the Strait of Hormuz, and on signs that…
WTI Crude Slips to a Weekly Low on Hormuz Deal Reports
September 25, 2026
View chart & download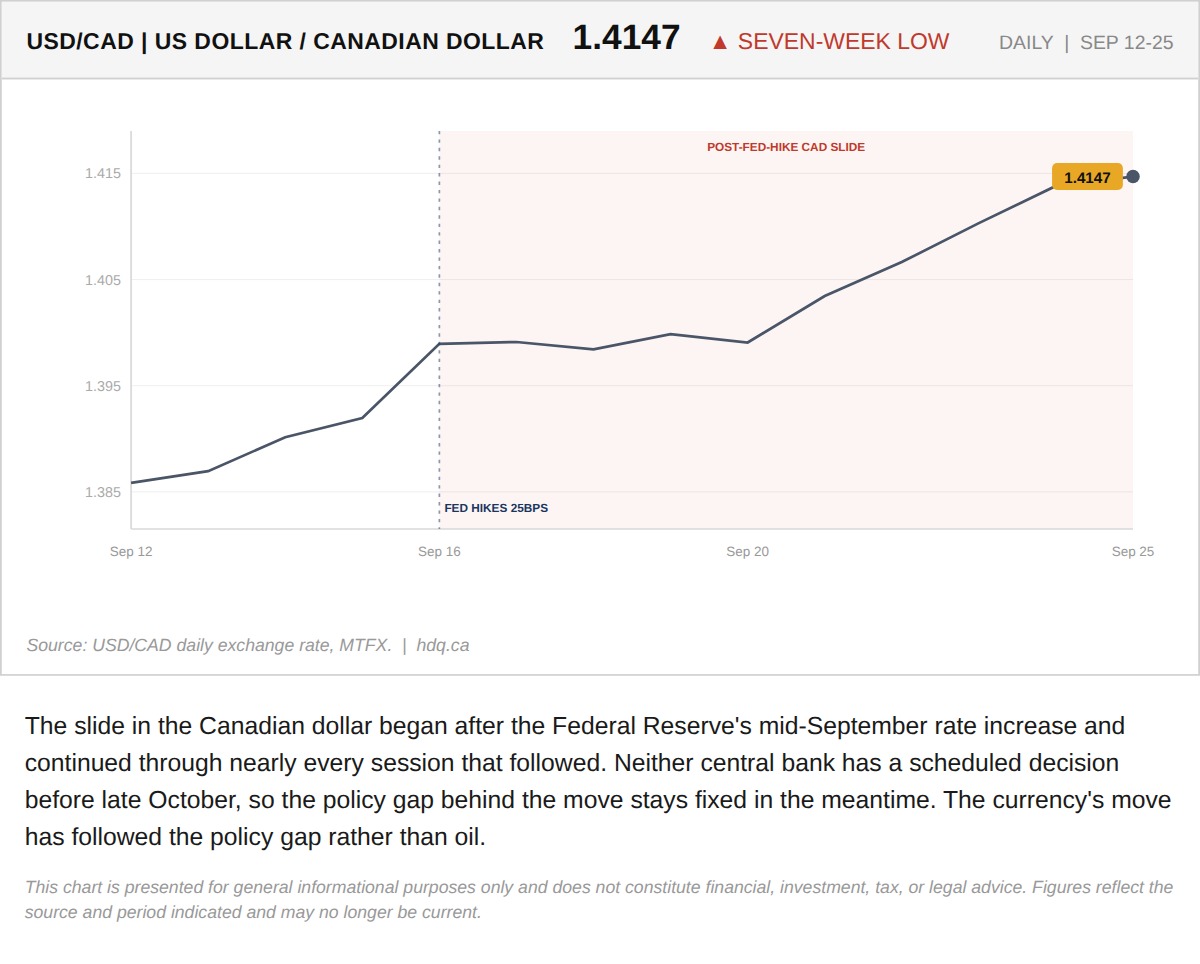
The slide in the Canadian dollar began after the Federal Reserve's mid-September rate increase and continued through nearly every session that followed.
USD/CAD Climbs to a Seven-Week High Since the Fed Hike
September 25, 2026
View chart & download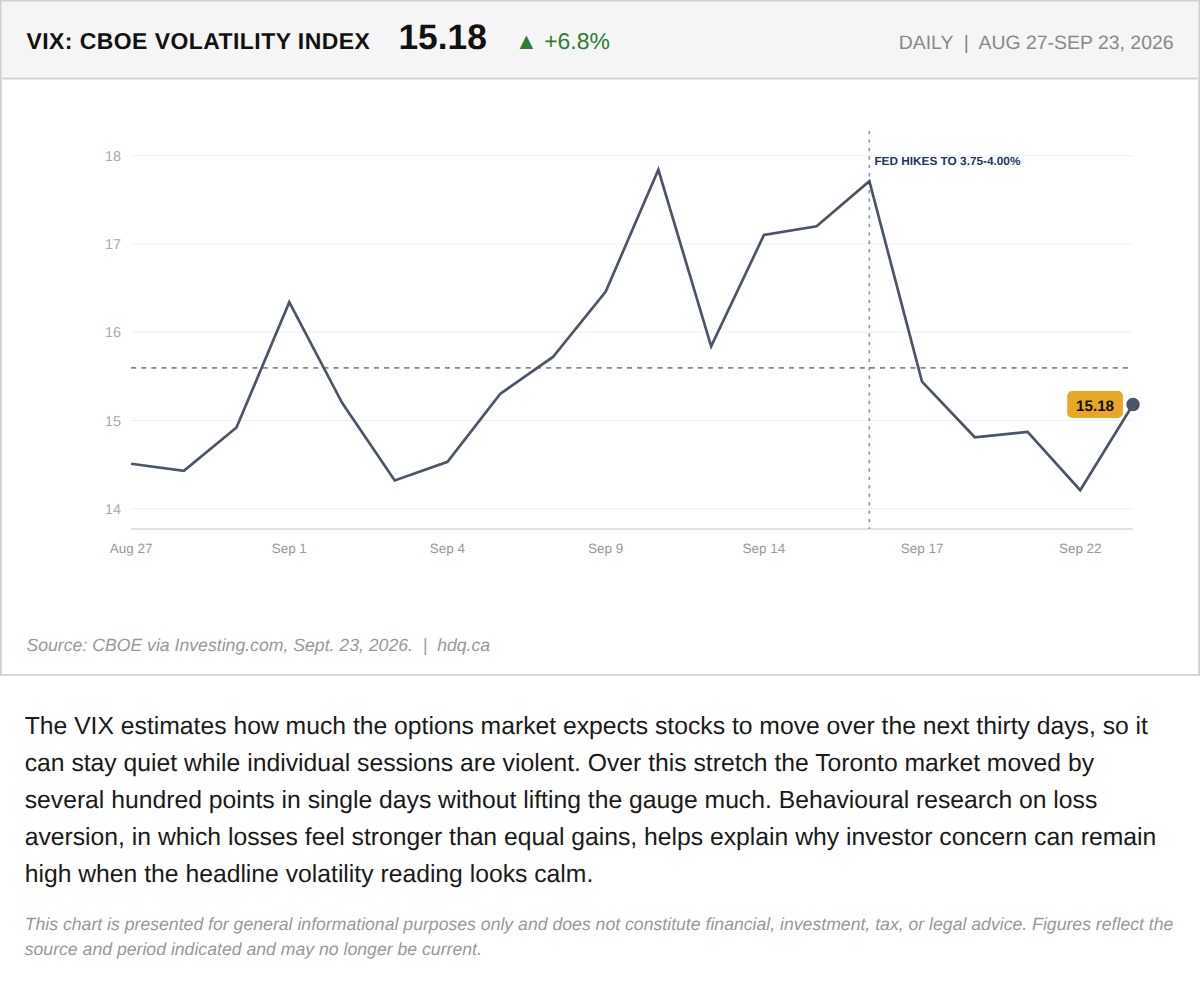
The VIX estimates how much the options market expects stocks to move over the next thirty days, so it can stay quiet while individual sessions are violent.
VIX Stays Subdued While the TSX Swings
September 24, 2026
View chart & download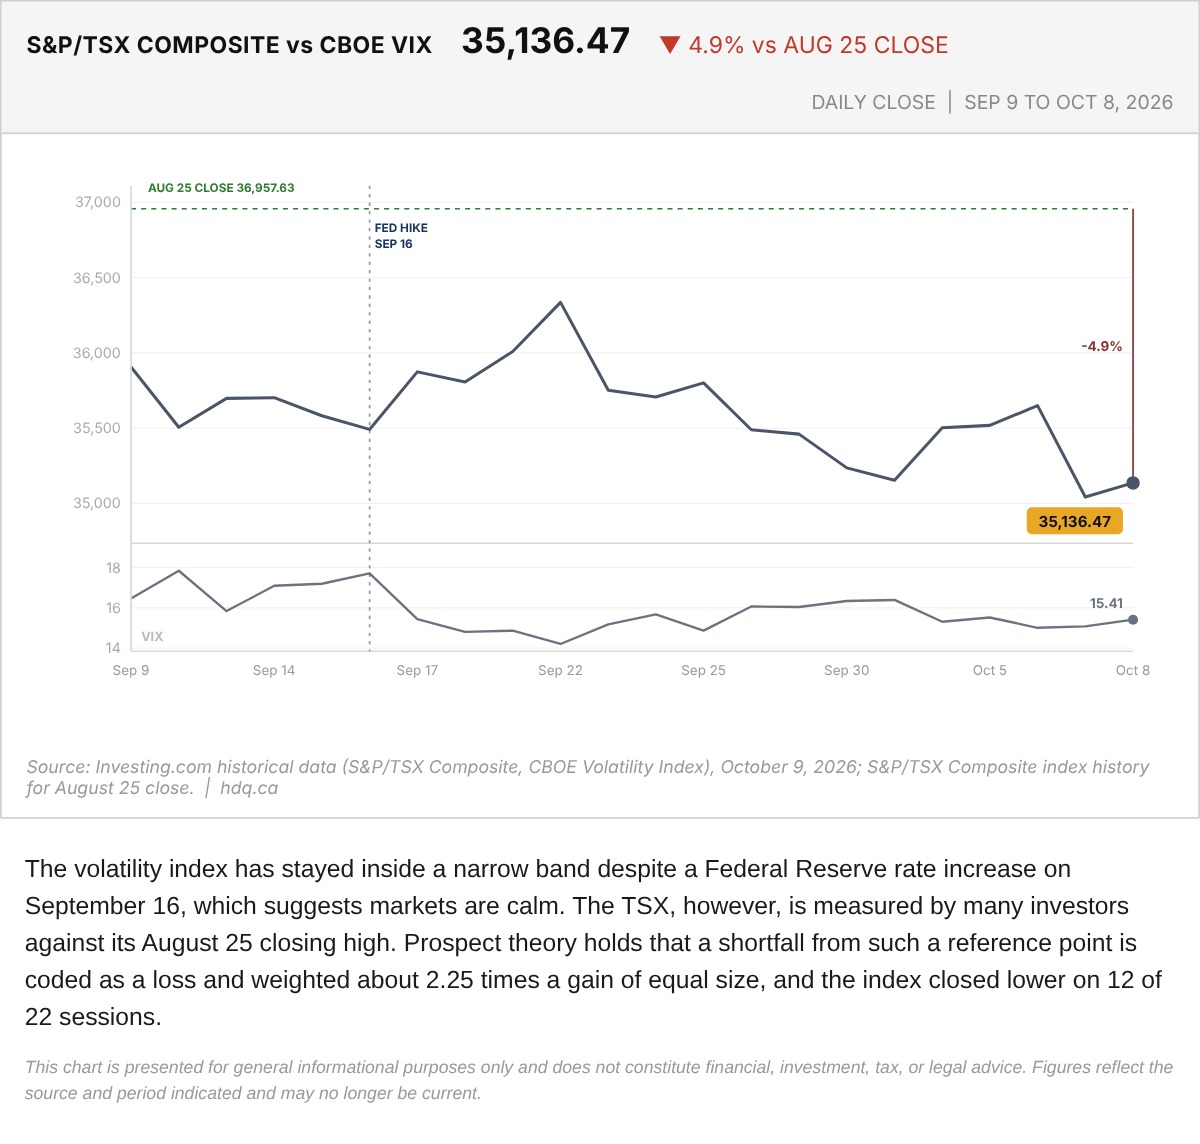
The volatility index has stayed inside a narrow band despite a Federal Reserve rate increase on September 16, which suggests markets are calm.
S&P/TSX Composite Against the Cboe VIX, September 9 to October 8
October 9, 2026
View chart & download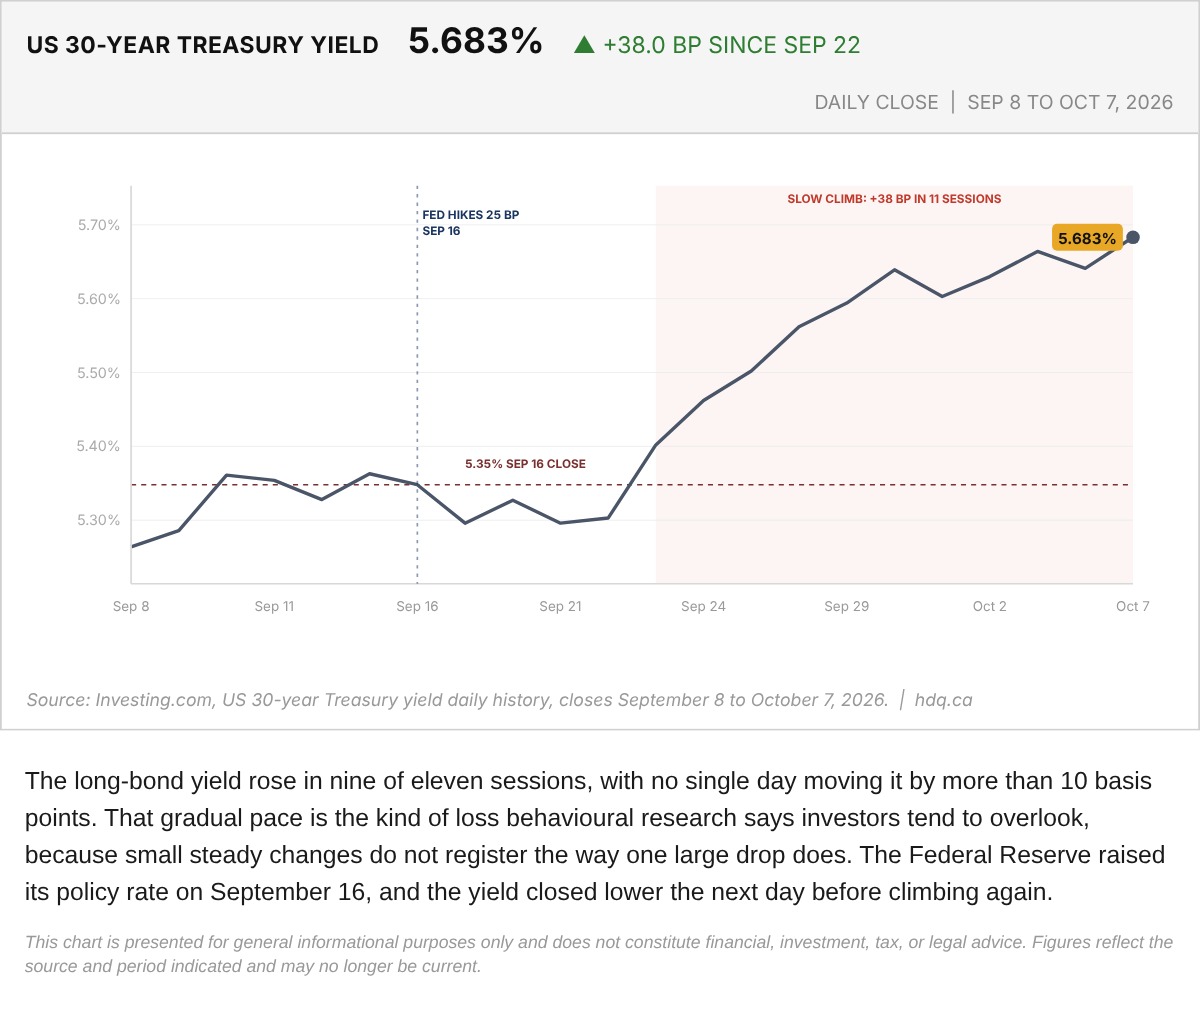
The long-bond yield rose in nine of eleven sessions, with no single day moving it by more than 10 basis points.
US 30-Year Treasury Yield Daily Close, September 8 to October 7
October 8, 2026
View chart & download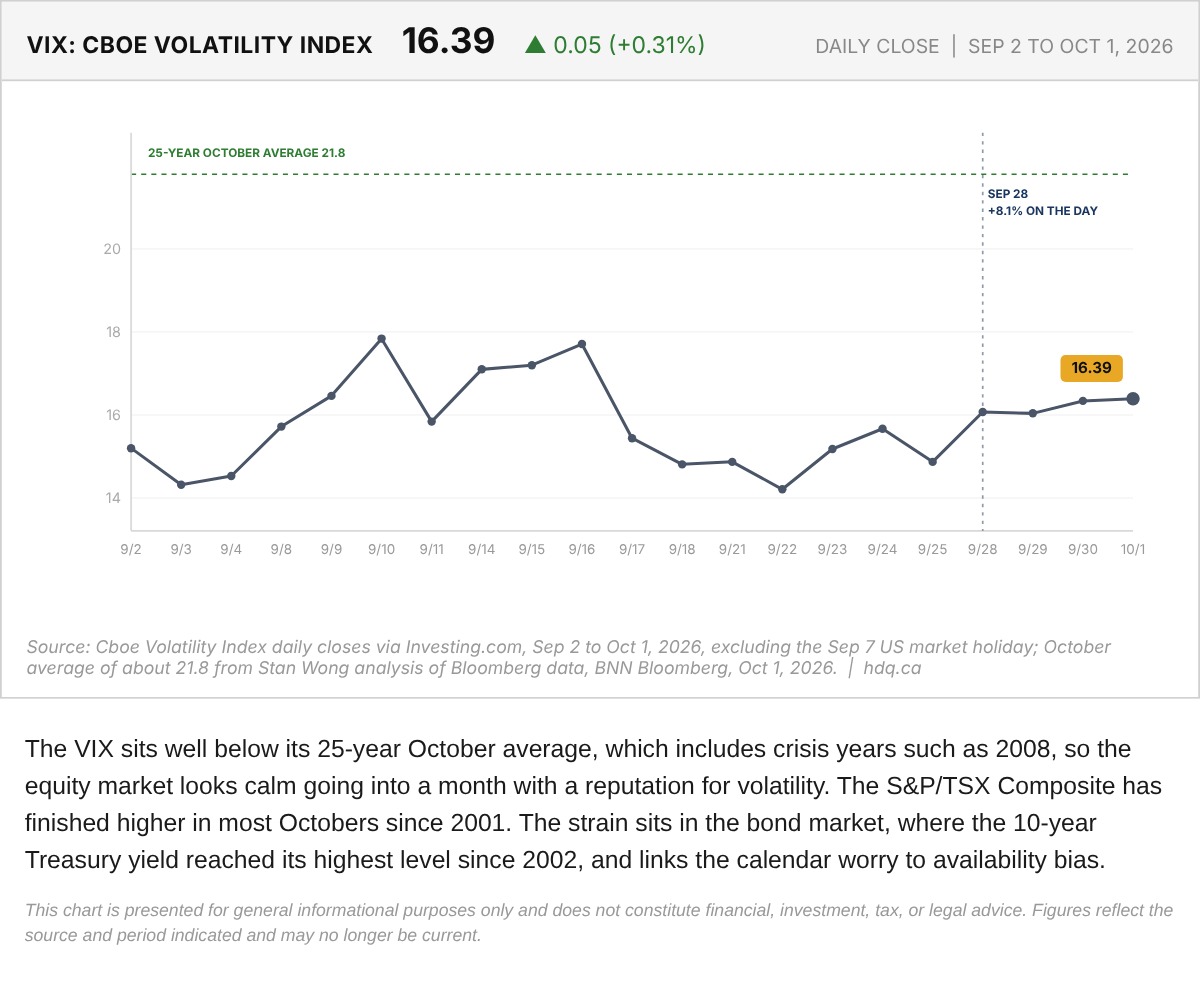
The VIX sits well below its 25-year October average, which includes crisis years such as 2008, so the equity market looks calm going into a month with a reputation for volatility.
Cboe Volatility Index (VIX) and the October Average, September 2 to October 1, 2026
October 2, 2026
View chart & download