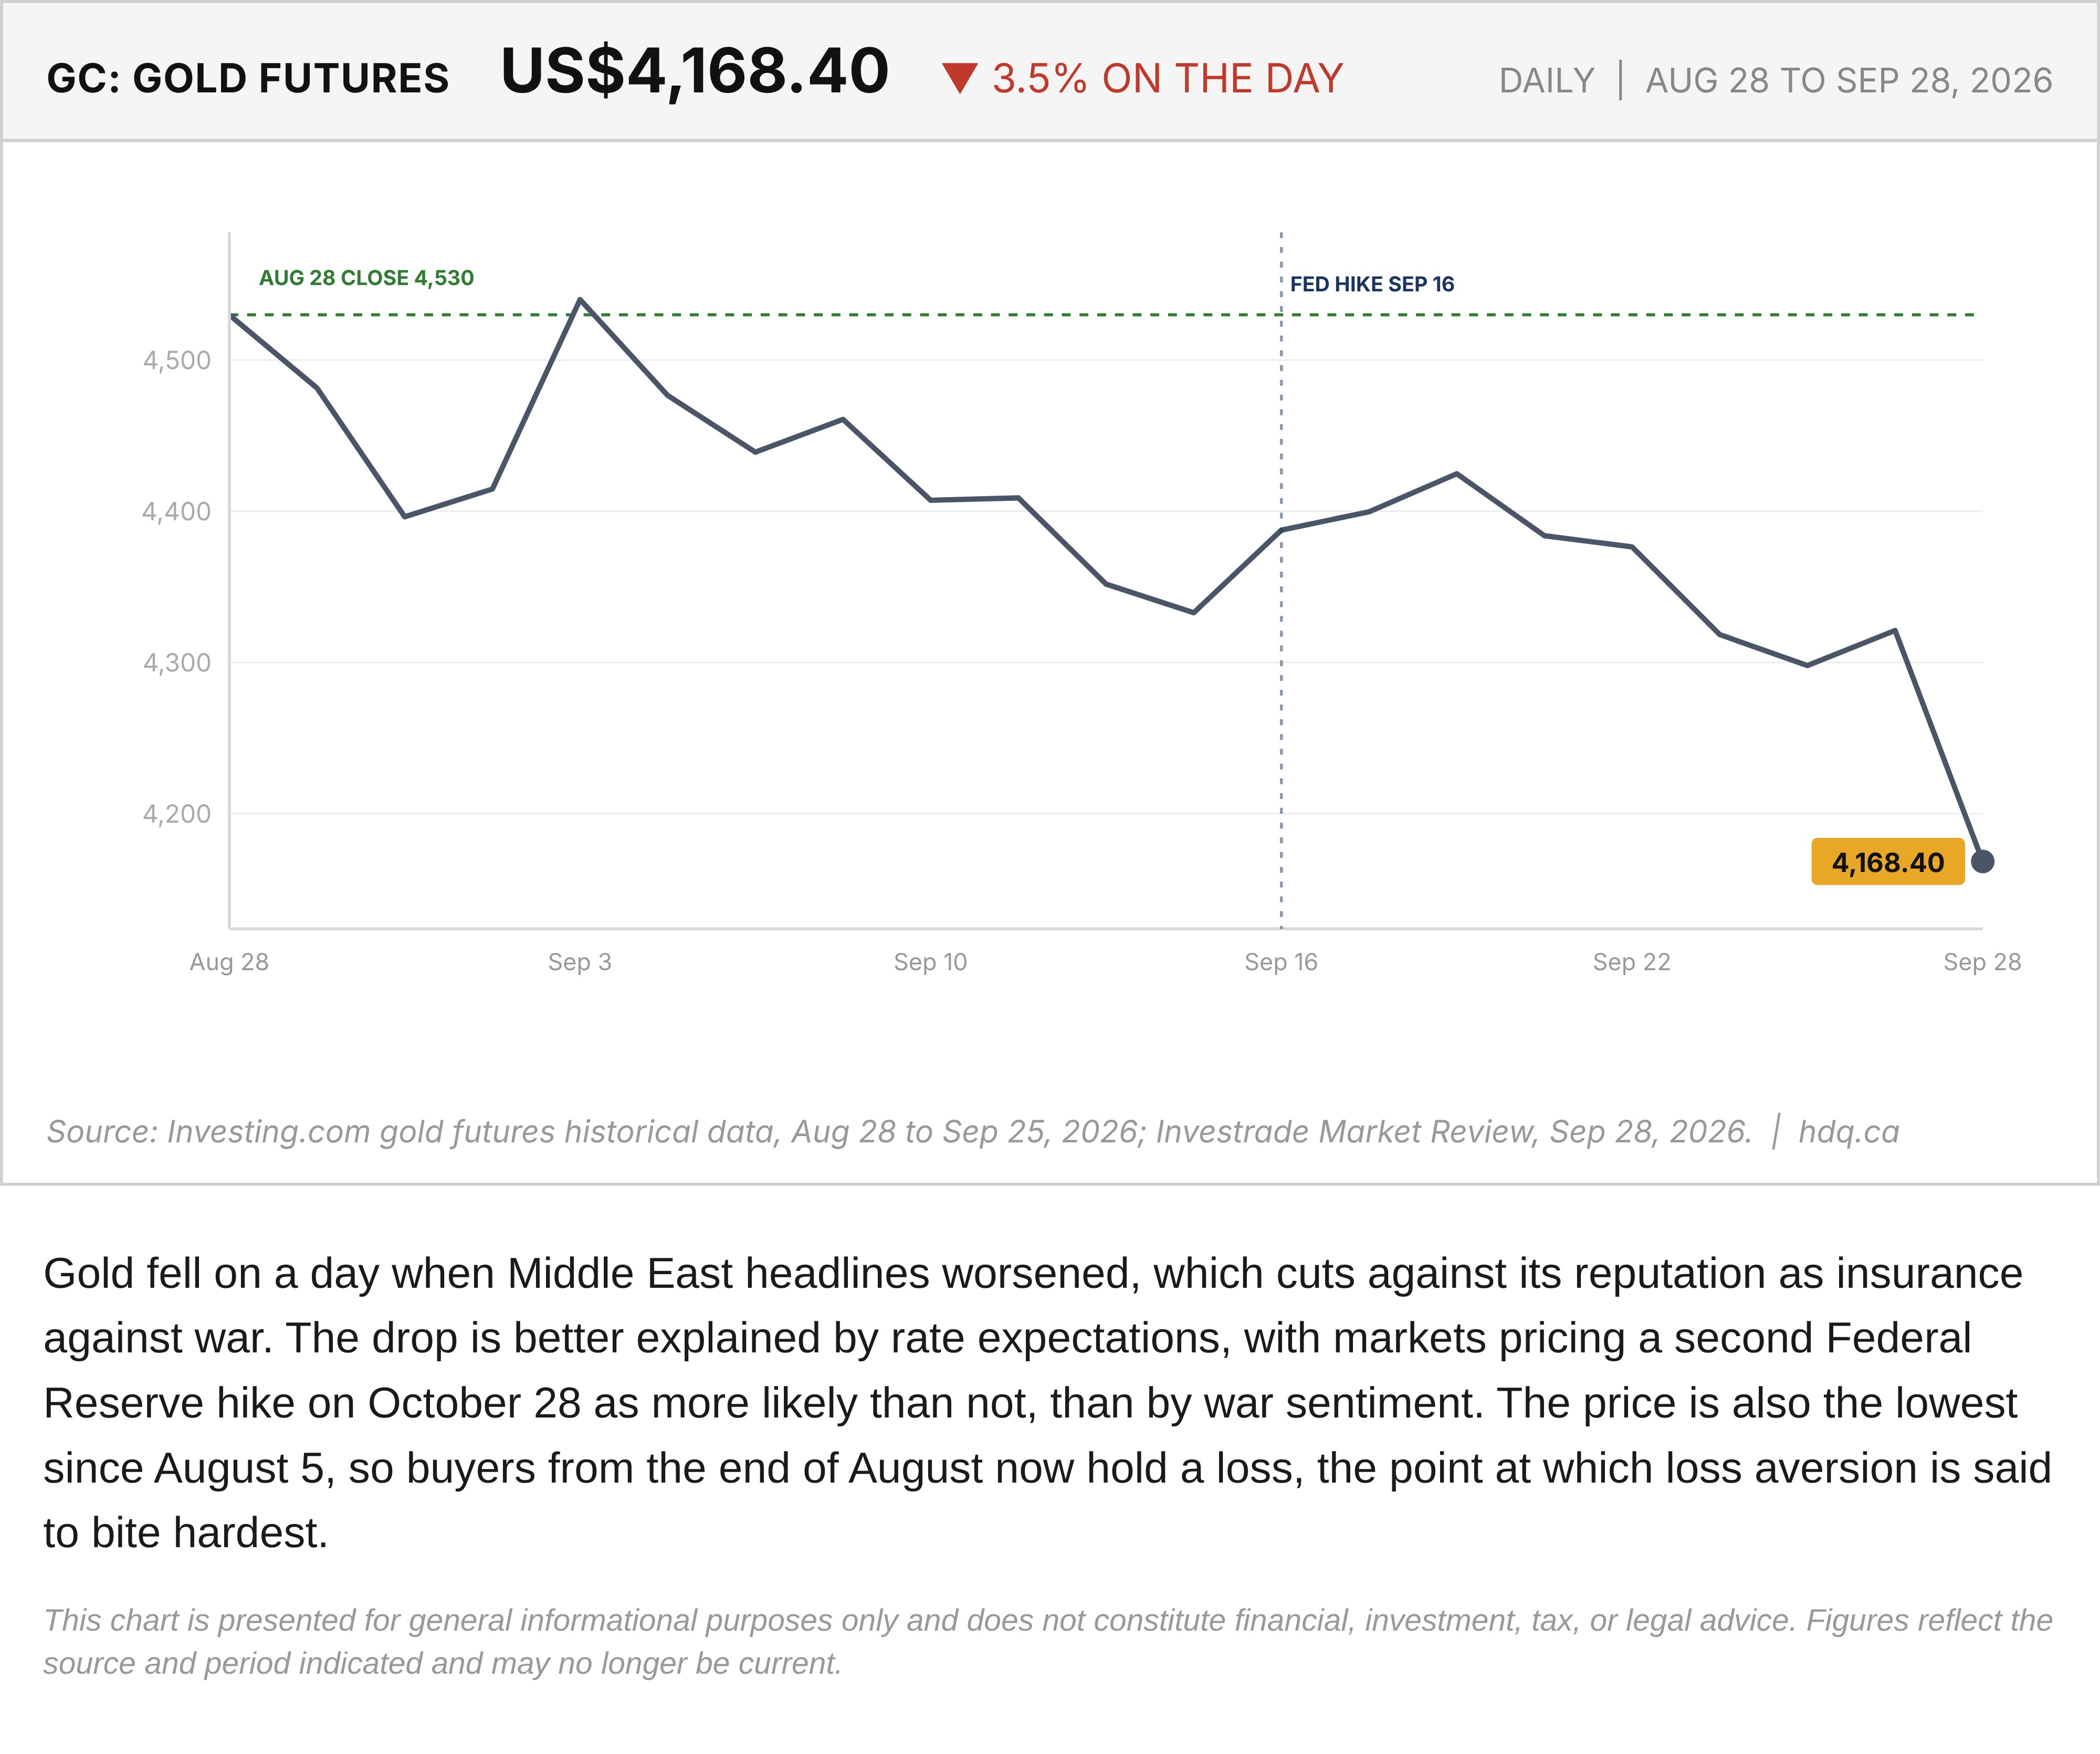
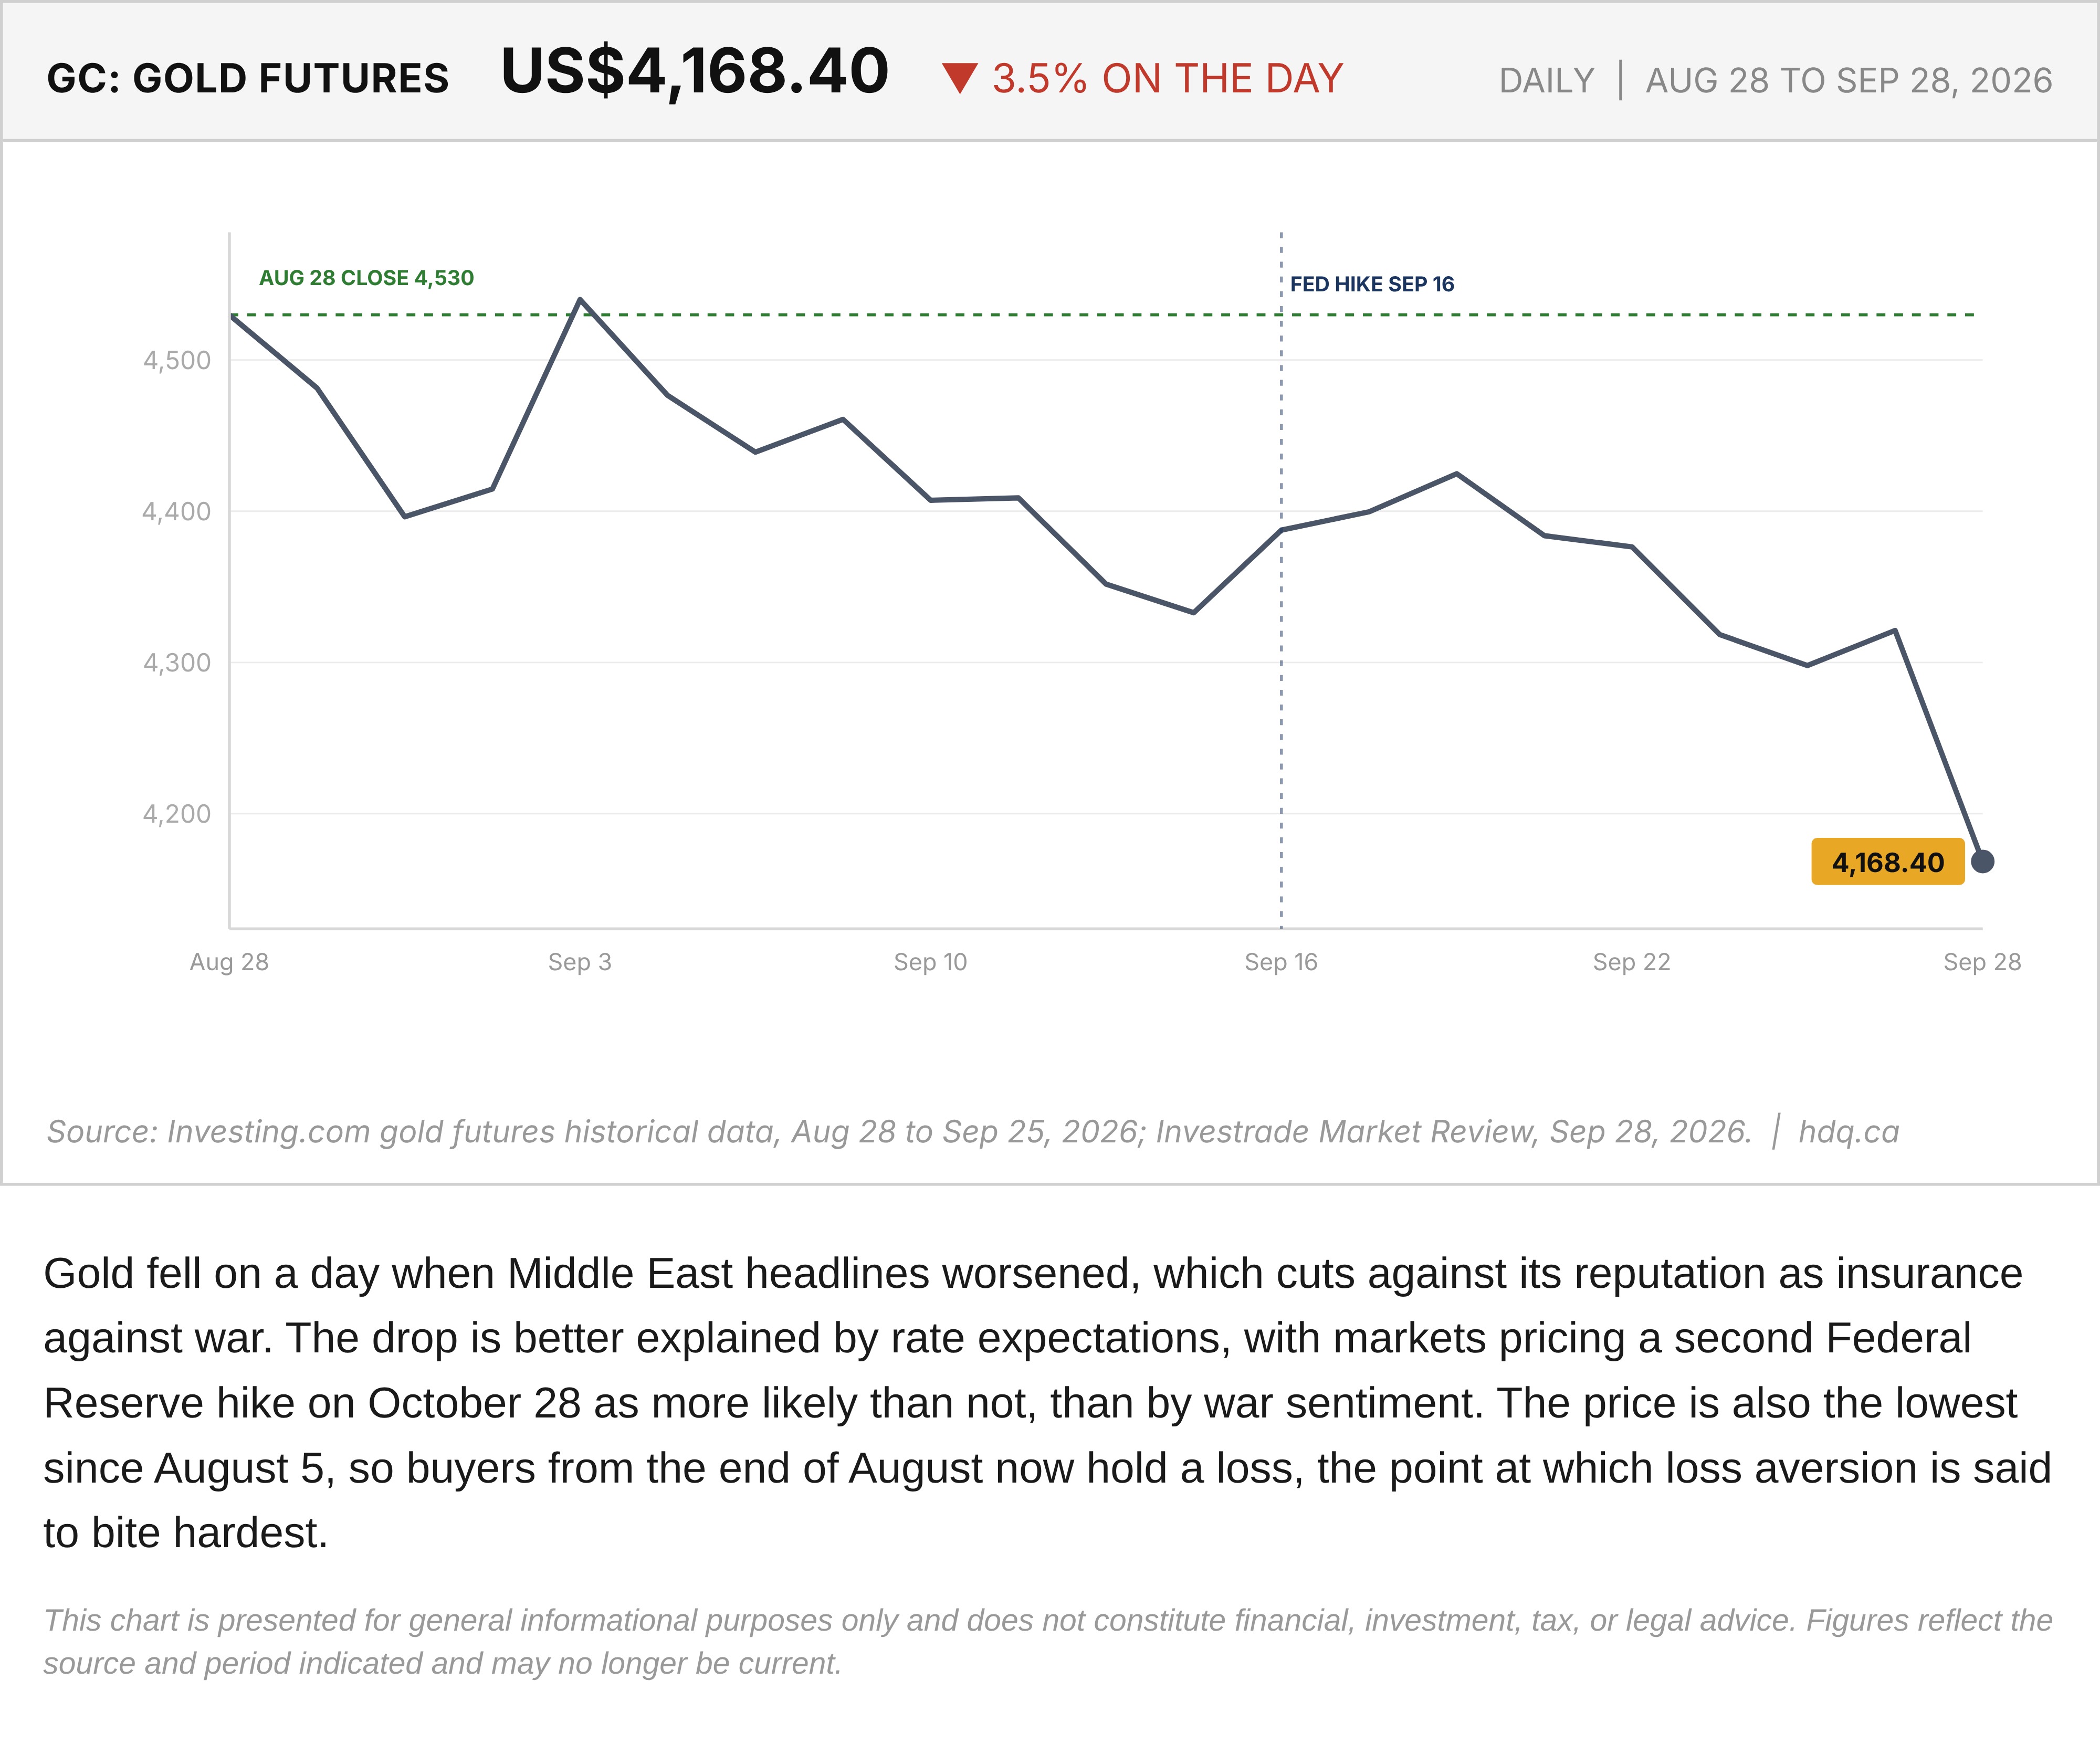
Gold fell on a day when Middle East headlines worsened, which cuts against its reputation as insurance against war. The drop is better explained by rate expectations, with markets pricing a second Federal Reserve hike on October 28 as more likely than not, than by war sentiment. The price is also the lowest since August 5, so buyers from the end of August now hold a loss, the point at which loss aversion is said to bite hardest.
This chart is presented for general informational purposes only and does not constitute financial, investment, tax, or legal advice. Figures reflect the source and period indicated and may no longer be current.
Related charts
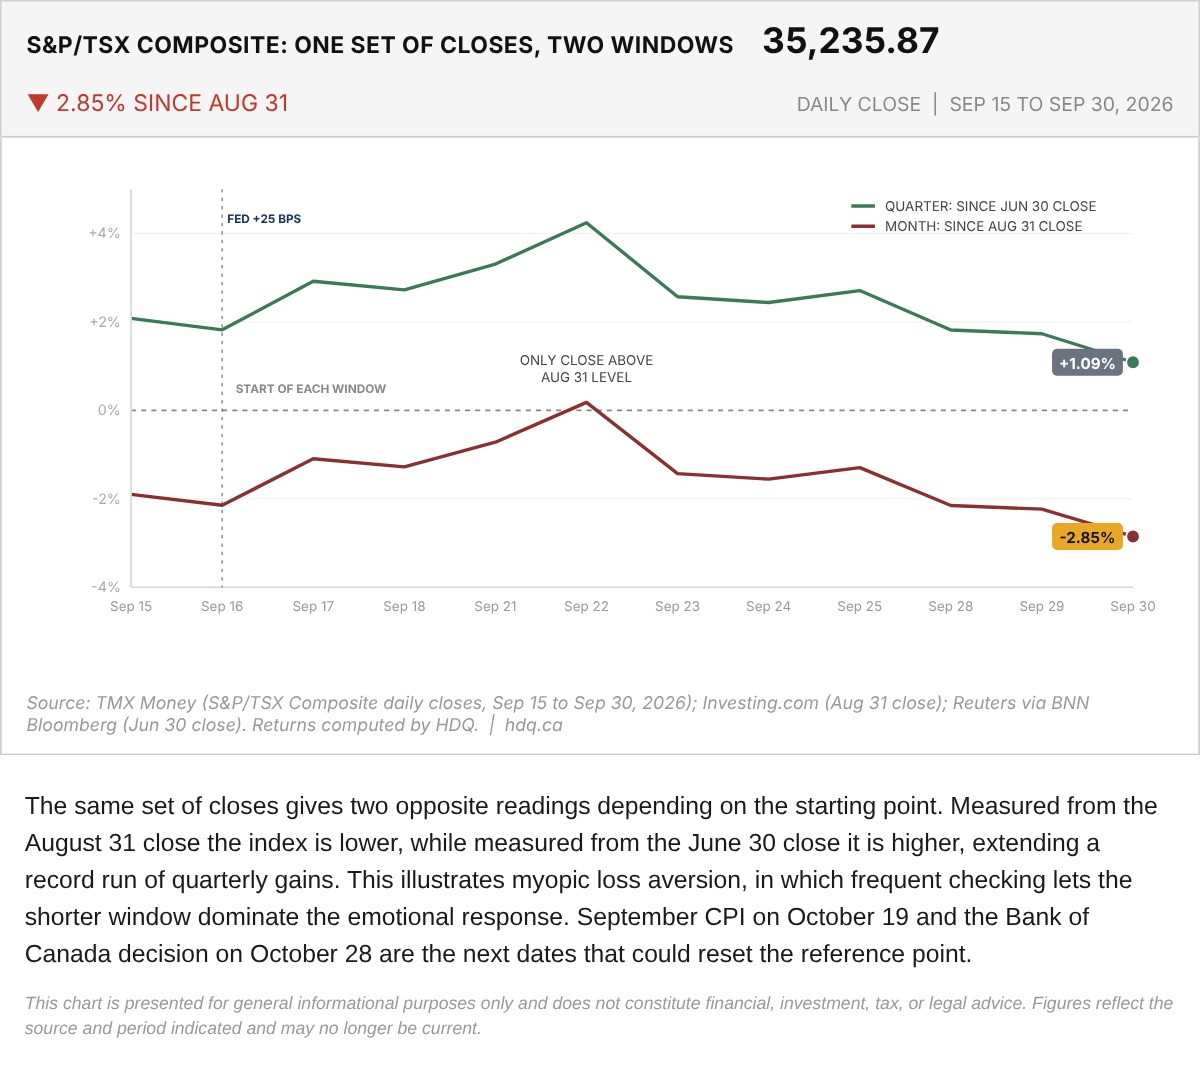
The same set of closes gives two opposite readings depending on the starting point.
S&P/TSX Composite: Monthly and Quarterly Returns From the Same Closes
October 1, 2026
View chart & download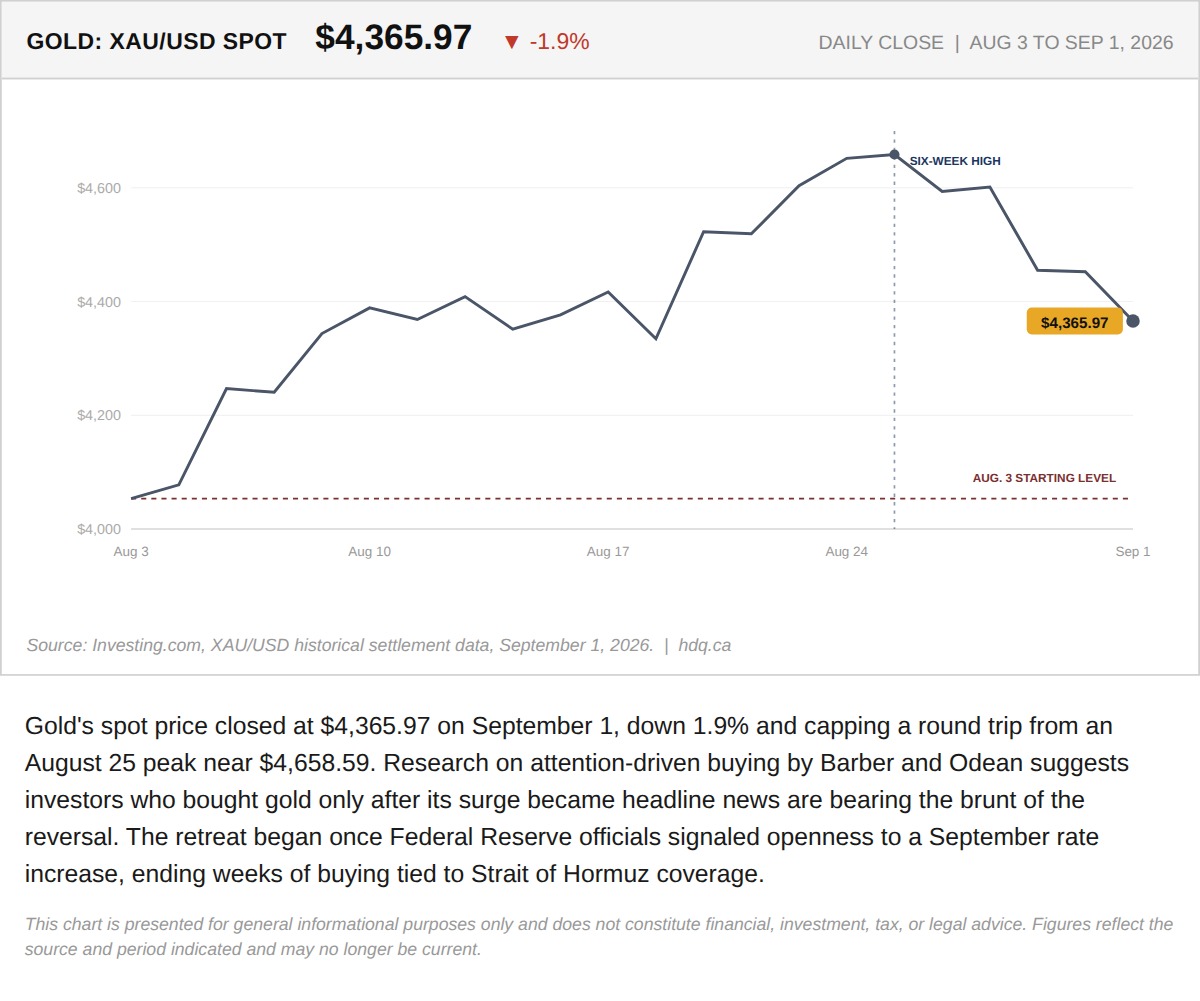
Gold's spot price closed at $4,365.97 on September 1, down 1.9% and capping a round trip from an August 25 peak near $4,658.59.
Gold's Spot Price Pulls Back 1.9% After an Attention-Driven August Surge
September 2, 2026
View chart & download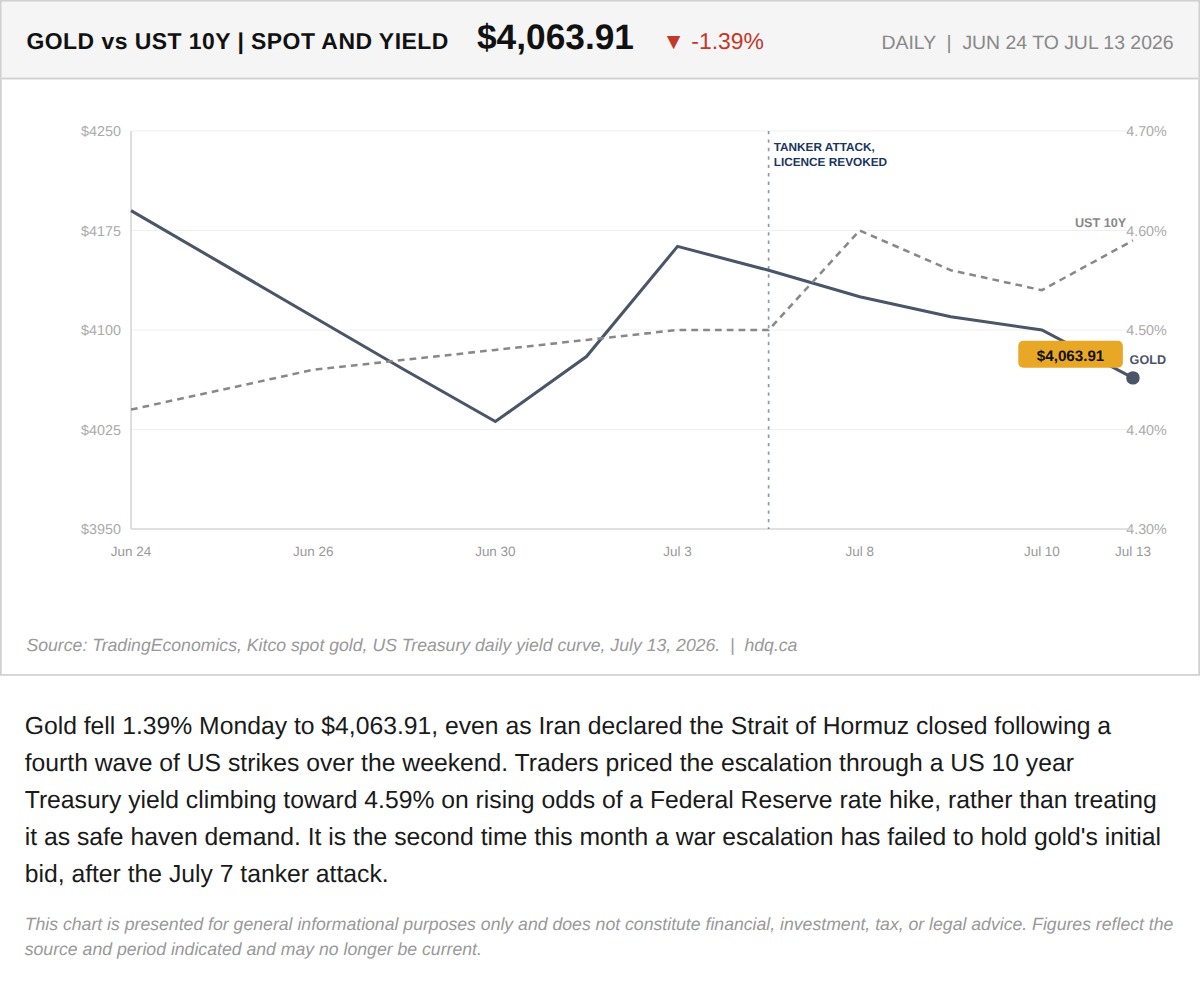
Gold fell 1.39% Monday to $4,063.91, even as Iran declared the Strait of Hormuz closed following a fourth wave of US strikes over the weekend.
Gold Fell on the Worst Hormuz Escalation in Months. That Is Not a Contradiction.
July 13, 2026
View chart & download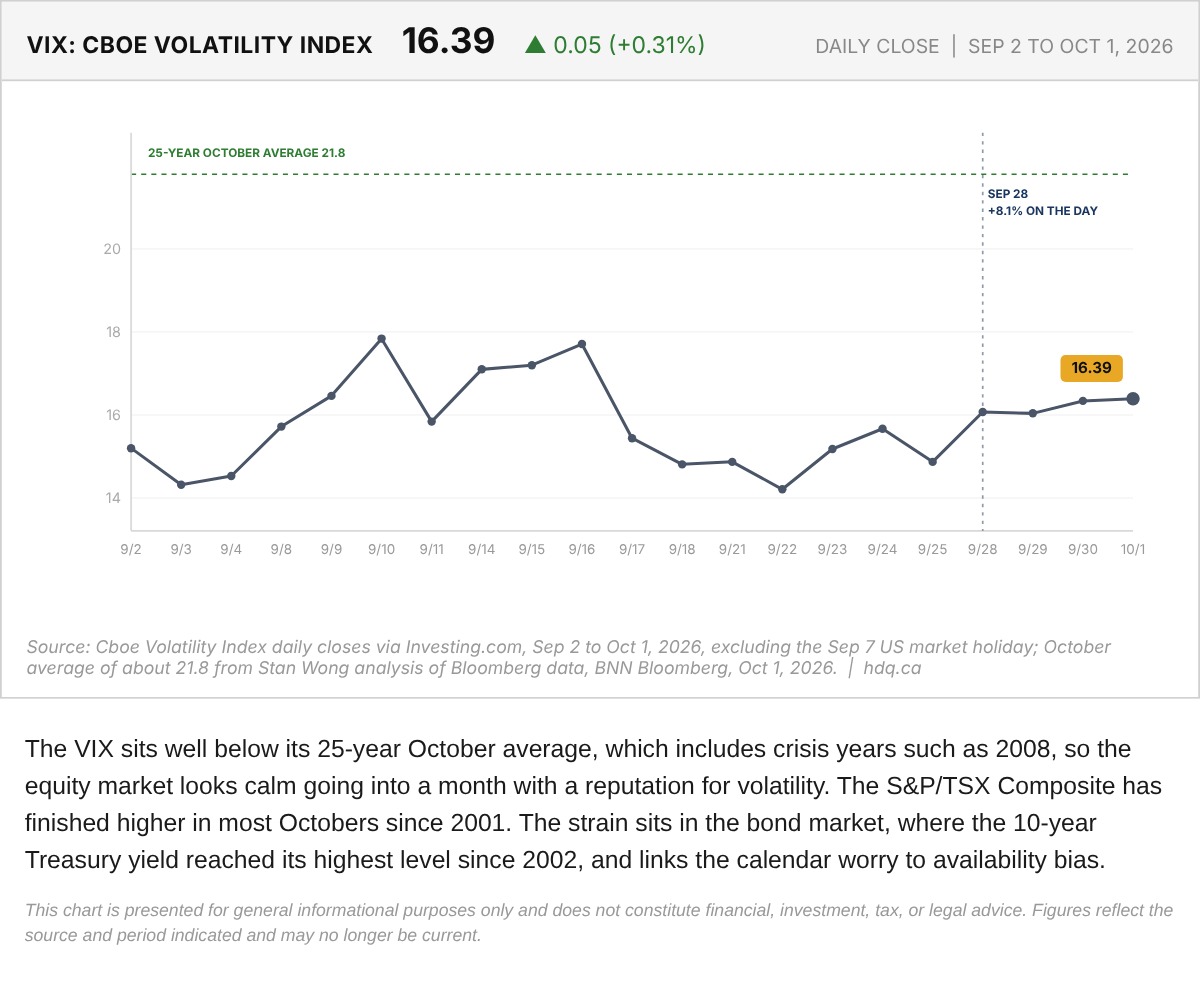
The VIX sits well below its 25-year October average, which includes crisis years such as 2008, so the equity market looks calm going into a month with a reputation for volatility.
Cboe Volatility Index (VIX) and the October Average, September 2 to October 1, 2026
October 2, 2026
View chart & download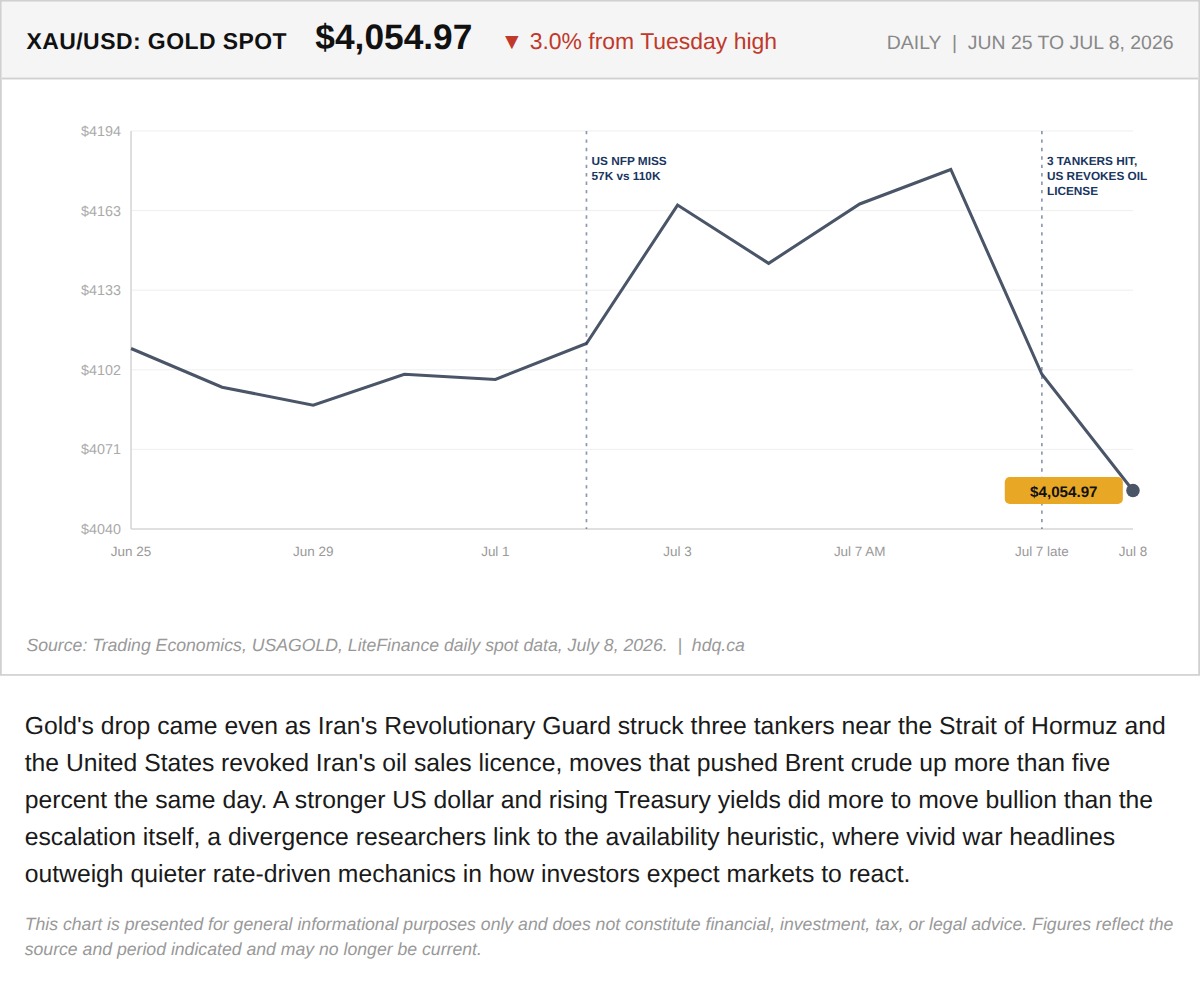
Gold's drop came even as Iran's Revolutionary Guard struck three tankers near the Strait of Hormuz and the United States revoked Iran's oil…
Gold Fell 3% While Iran Attacked Tankers in the Strait of Hormuz
July 8, 2026
View chart & download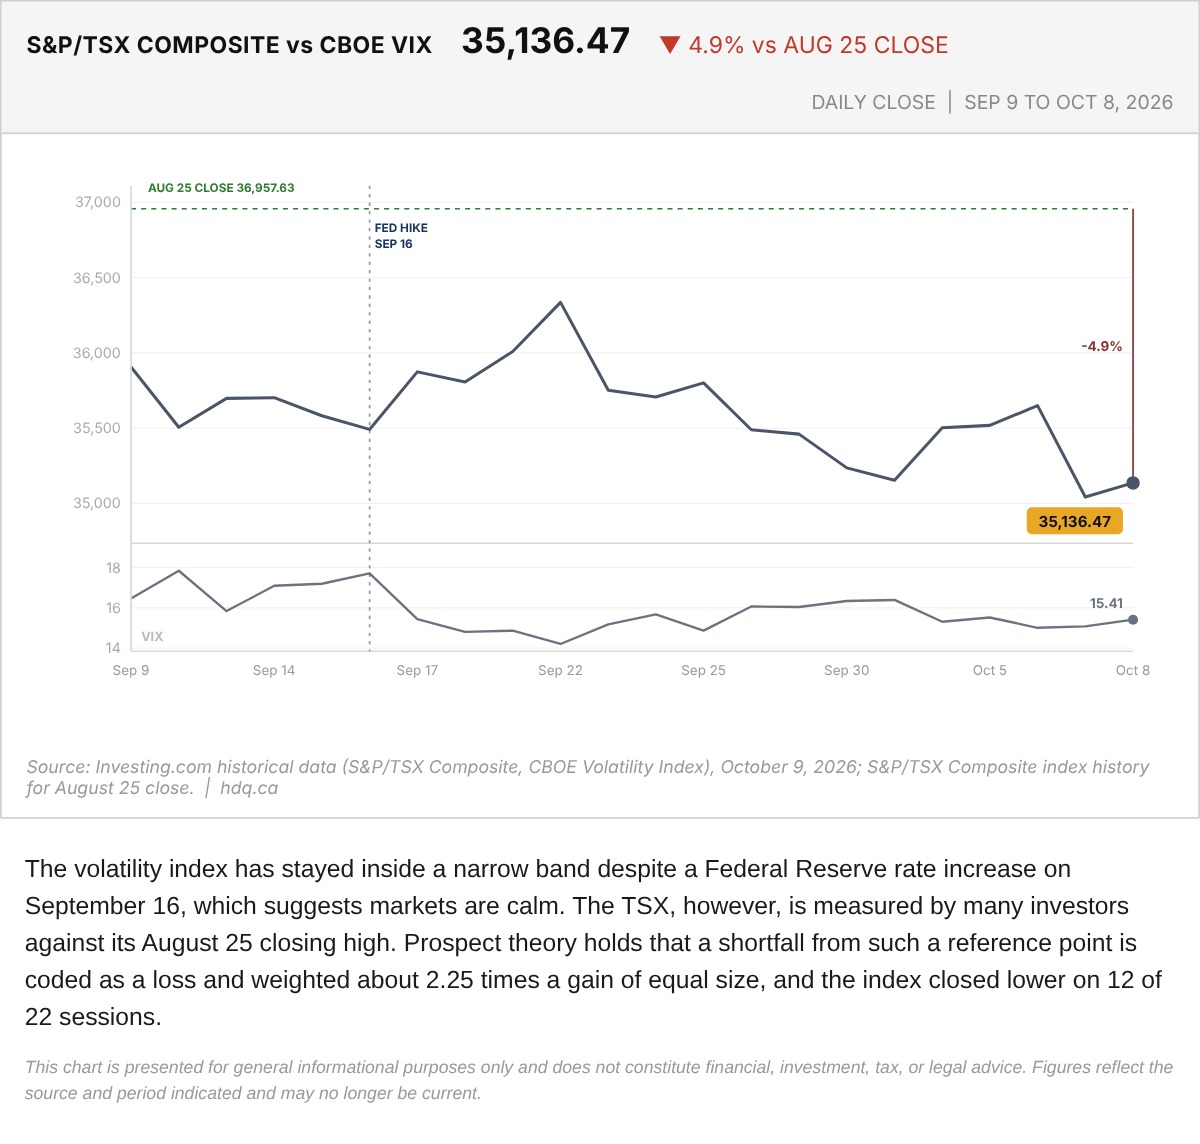
The volatility index has stayed inside a narrow band despite a Federal Reserve rate increase on September 16, which suggests markets are calm.
S&P/TSX Composite Against the Cboe VIX, September 9 to October 8
October 9, 2026
View chart & download