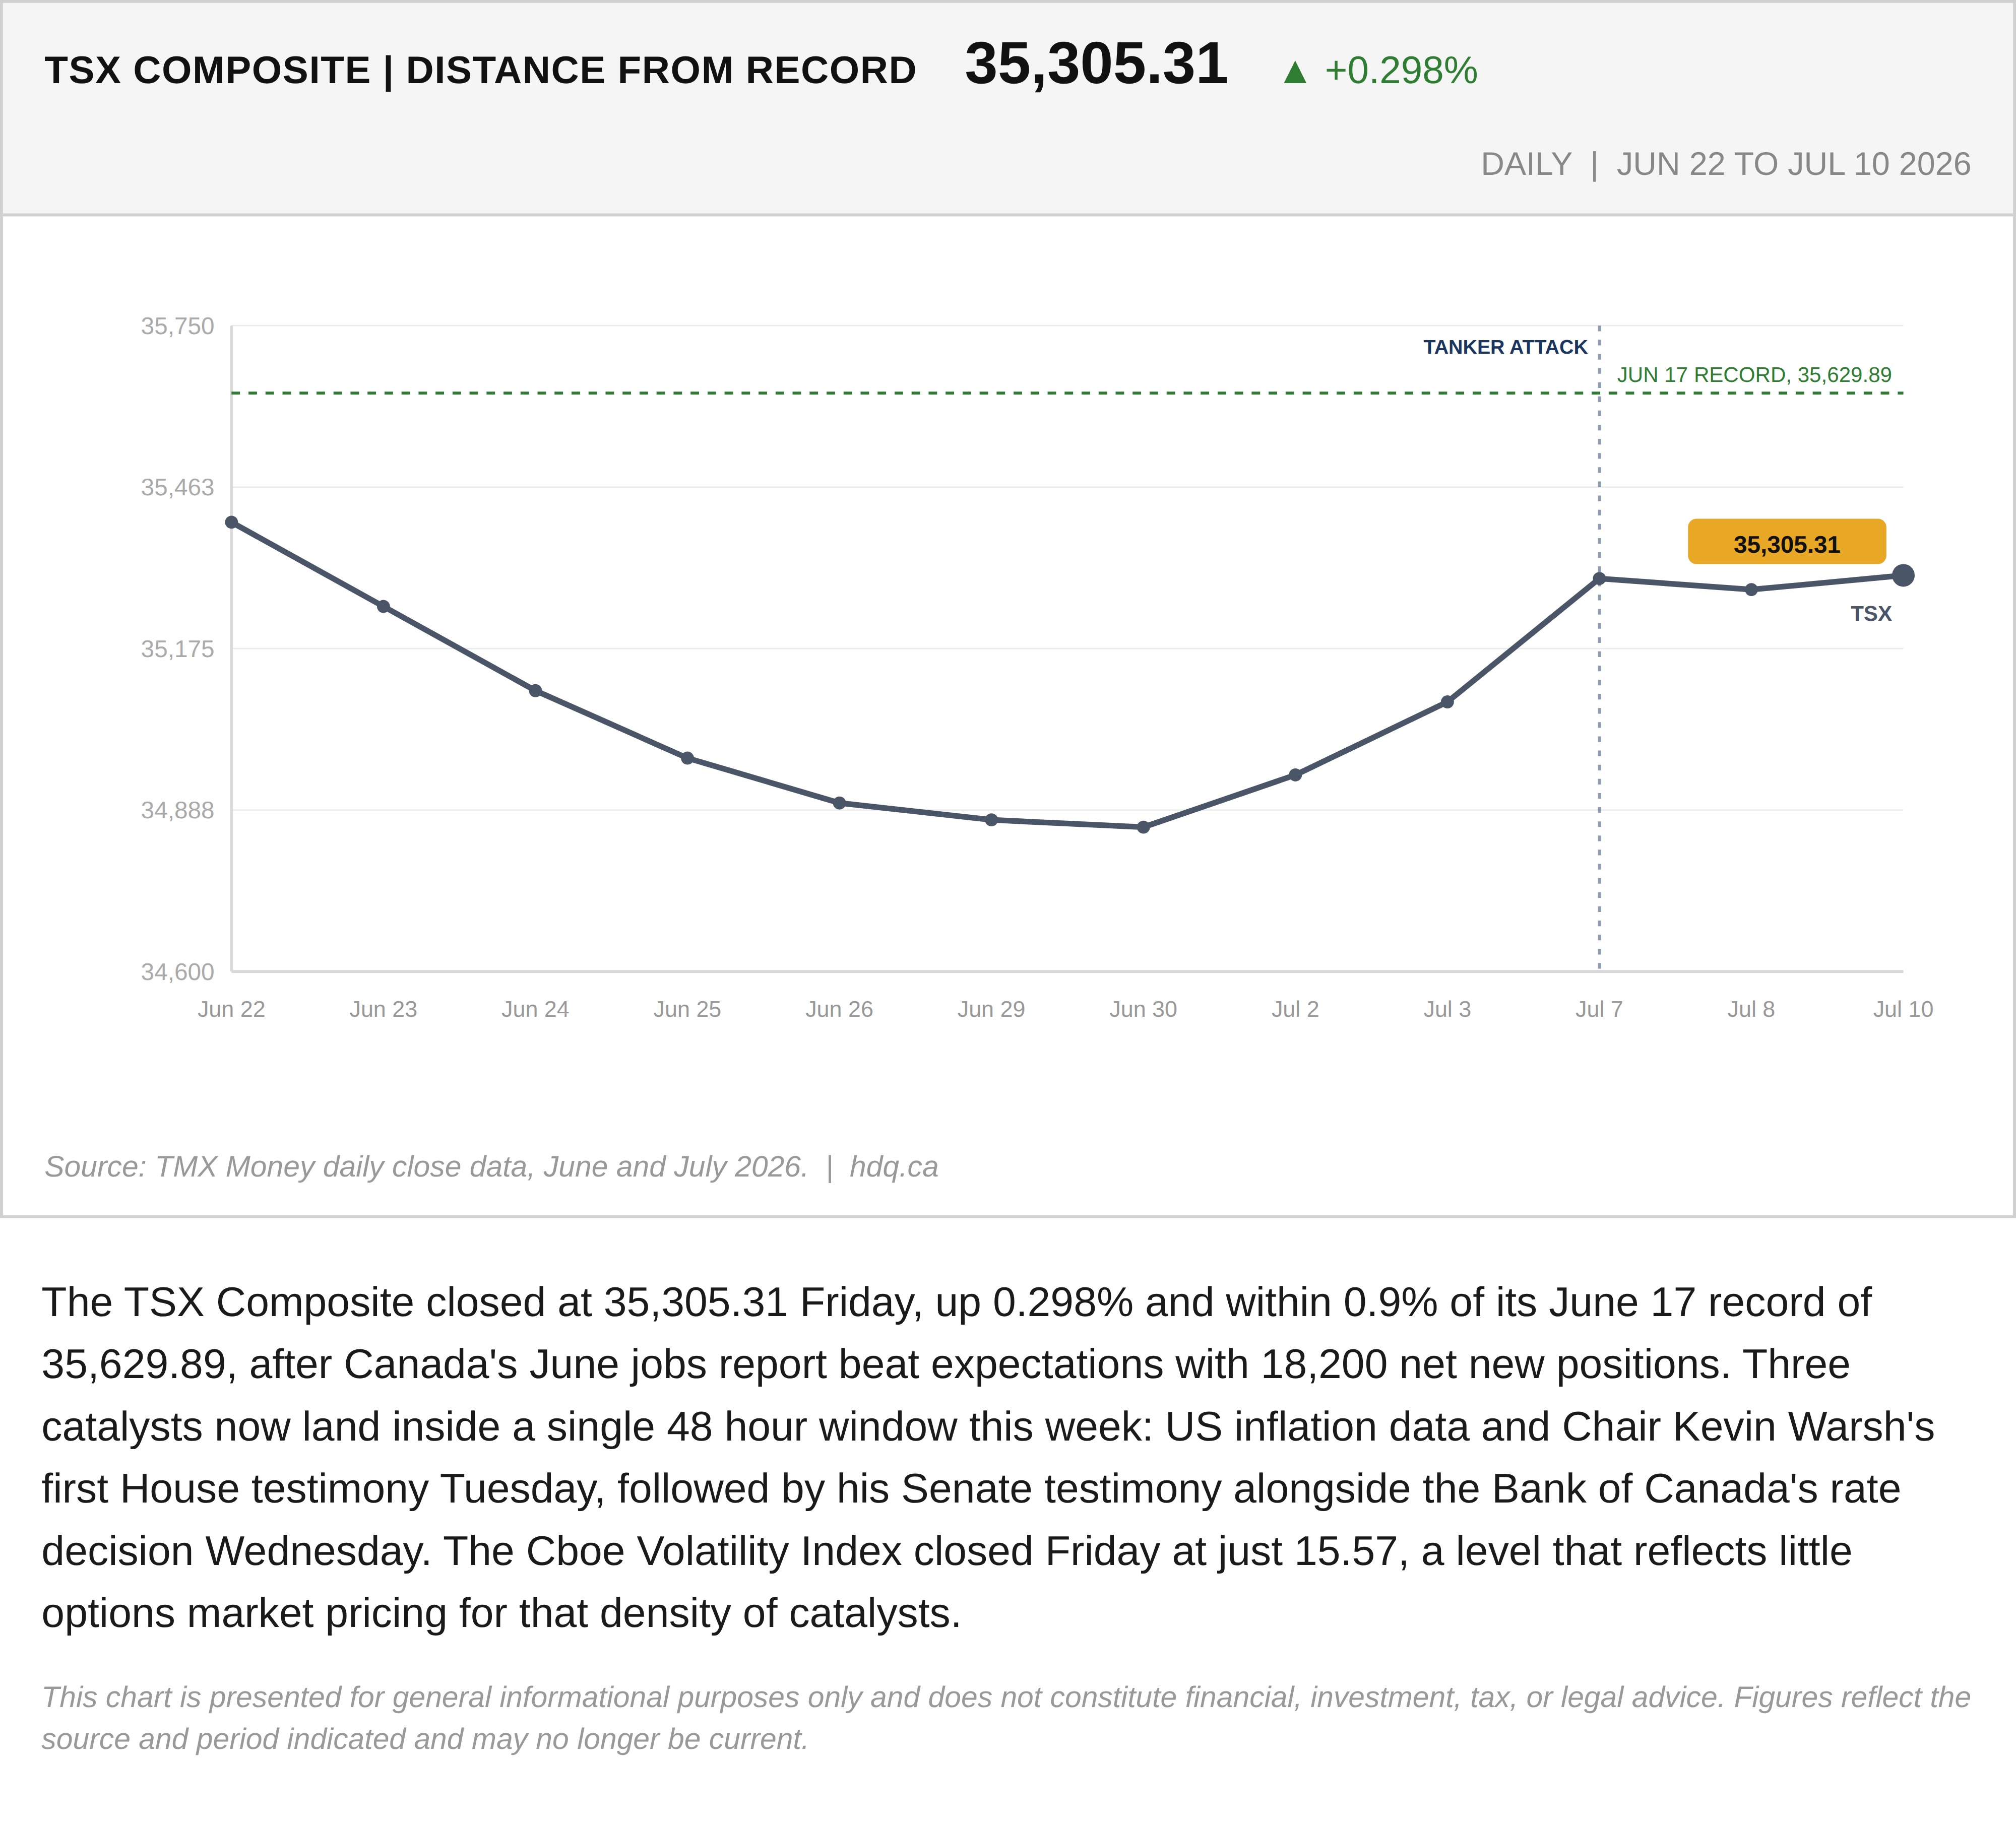
The TSX Composite closed at 35,305.31 Friday, up 0.298% and within 0.9% of its June 17 record of 35,629.89, after Canada's June jobs report beat expectations with 18,200 net new positions. Three catalysts now land inside a single 48 hour window this week: US inflation data and Chair Kevin Warsh's first House testimony Tuesday, followed by his Senate testimony alongside the Bank of Canada's rate decision Wednesday. The Cboe Volatility Index closed Friday at just 15.57, a level that reflects little options market pricing for that density of catalysts.
This chart is presented for general informational purposes only and does not constitute financial, investment, tax, or legal advice. Figures reflect the source and period indicated and may no longer be current.

Related charts
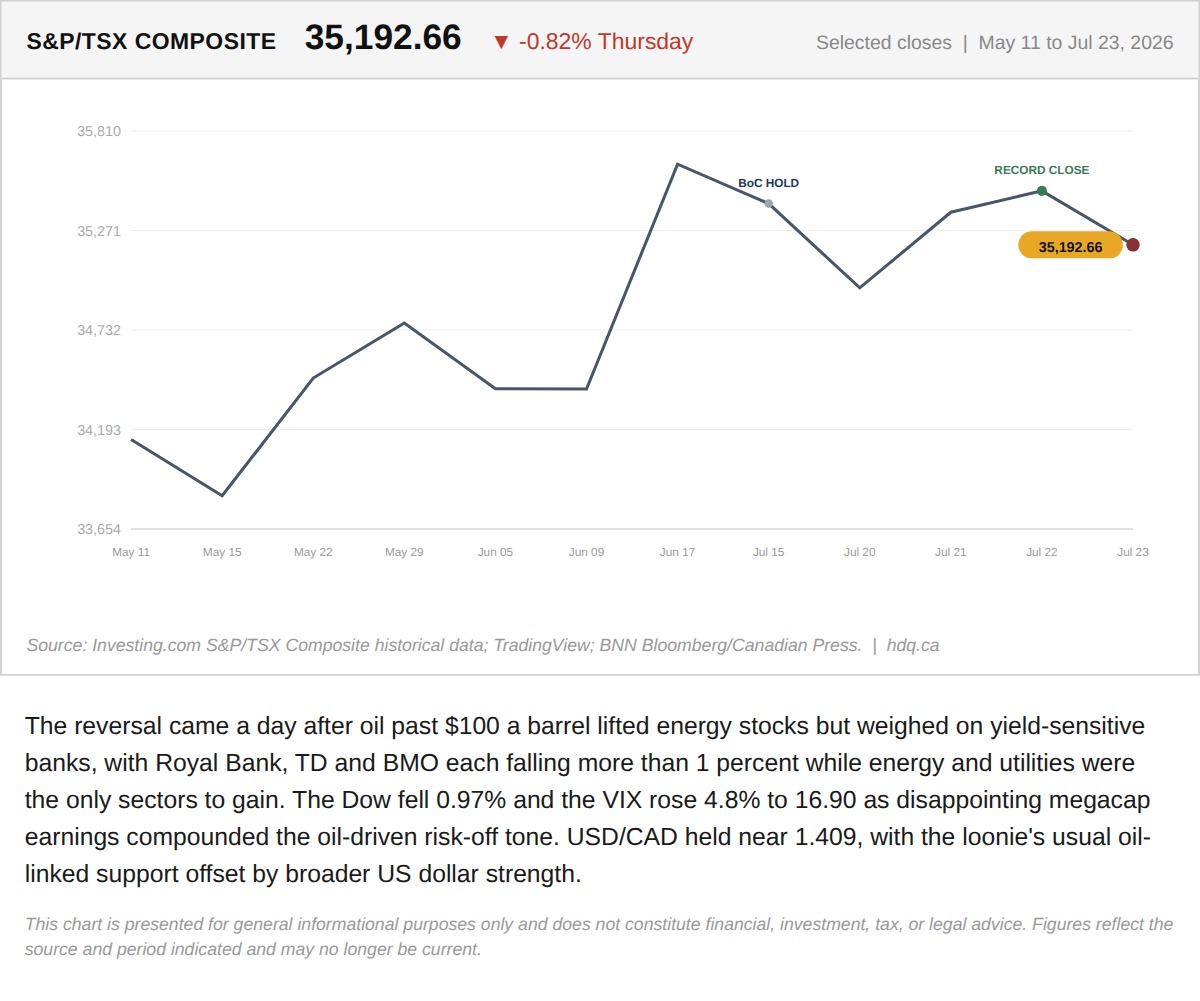
The reversal came a day after oil past $100 a barrel lifted energy stocks but weighed on yield-sensitive banks, with Royal Bank, TD and BMO…
Record High, Then a Bank-Led Reversal: Inside Thursday's TSX Split
July 24, 2026
View chart & download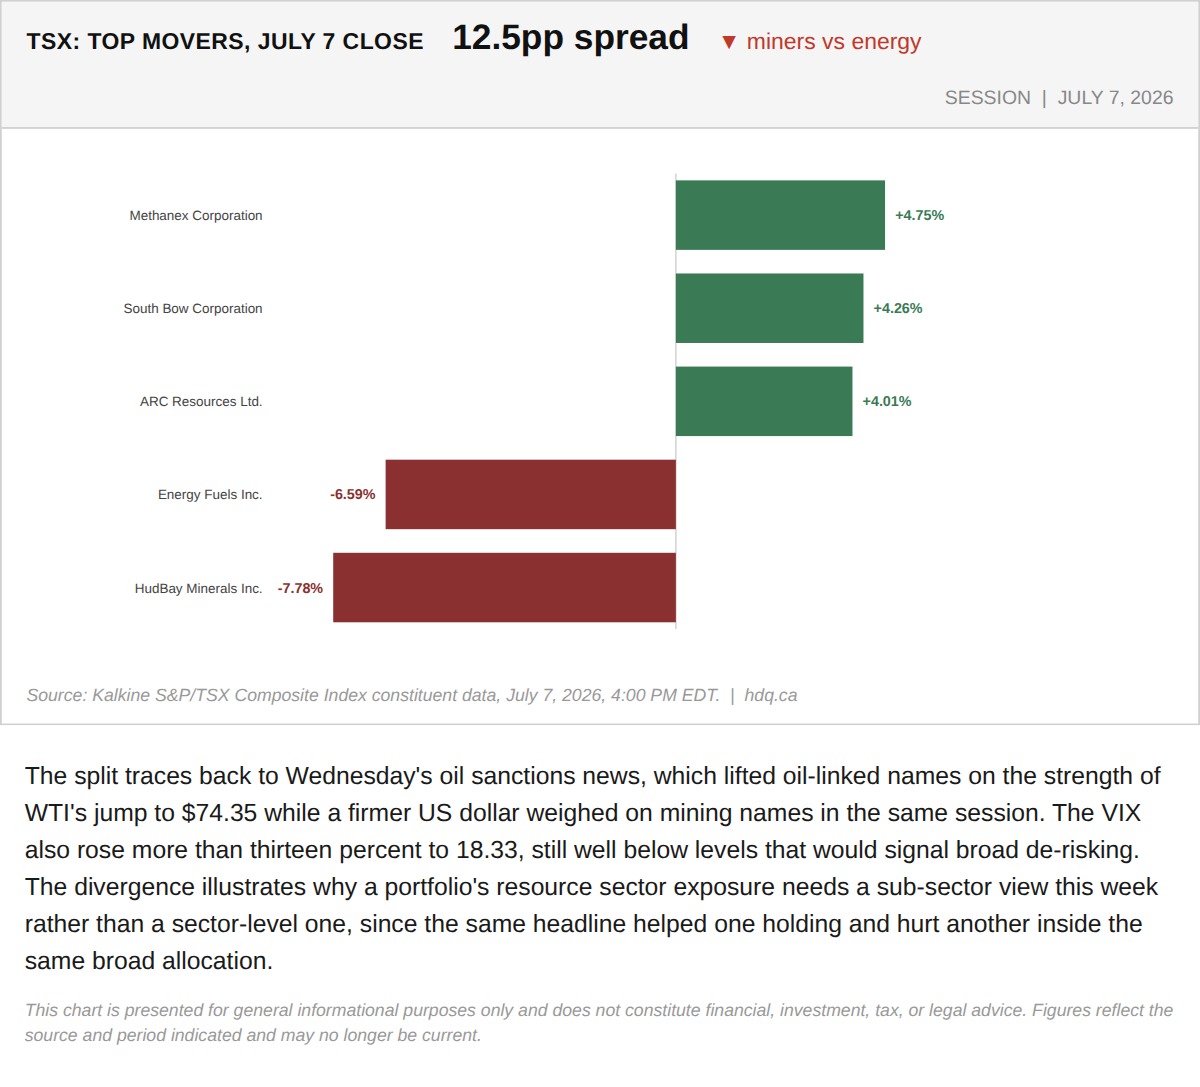
The split traces back to Wednesday's oil sanctions news, which lifted oil-linked names on the strength of WTI's jump to $74.35 while a…
July 8, 2026
View chart & download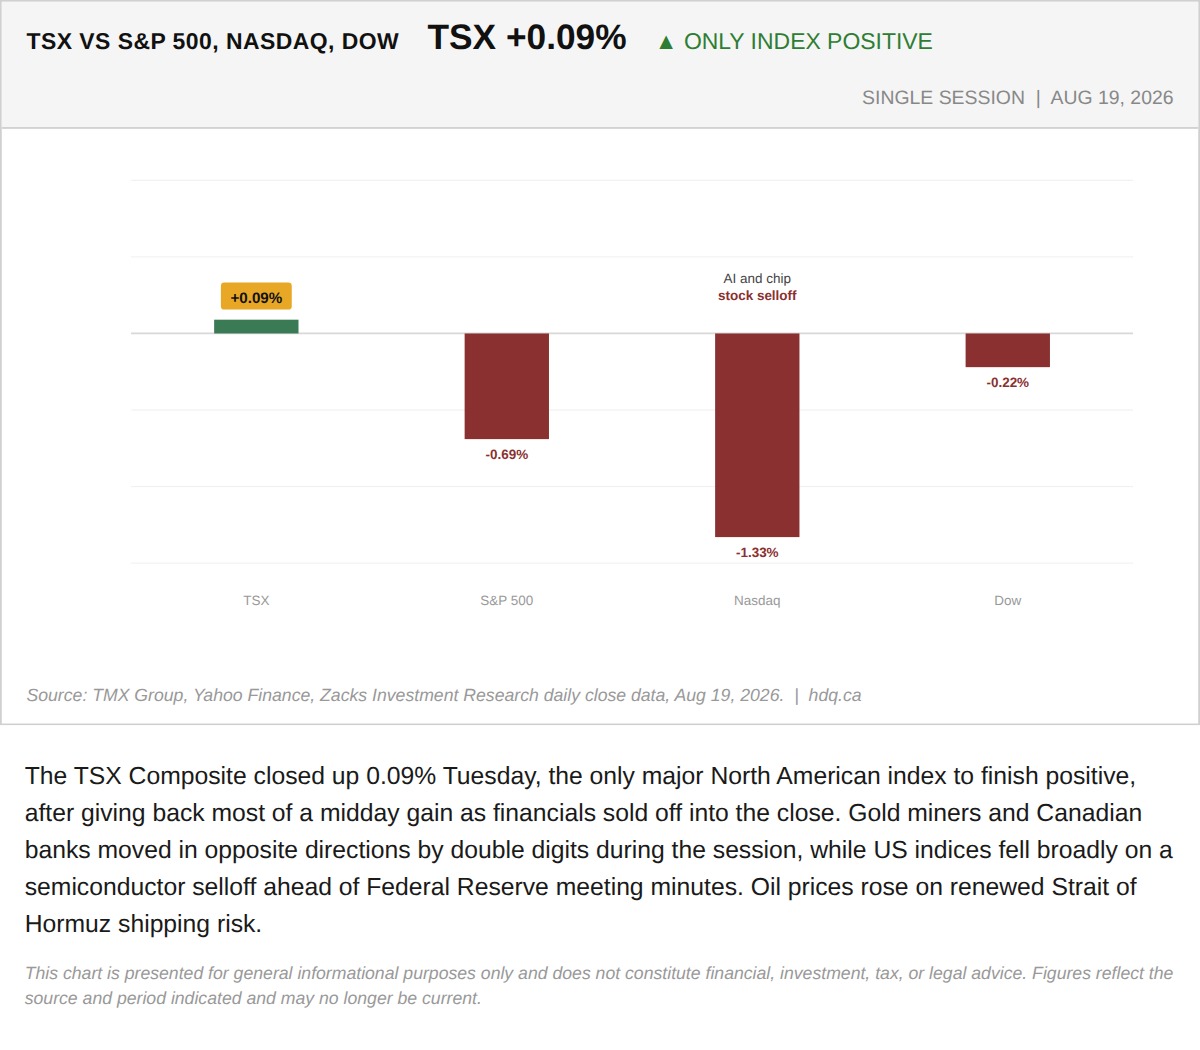
The TSX Composite closed up 0.09% Tuesday, the only major North American index to finish positive, after giving back most of a midday gain as financials sold off into the close.
The TSX Gave Back a 127-Point Tariff Rally as Financials Sold Off Into the Close
August 19, 2026
View chart & download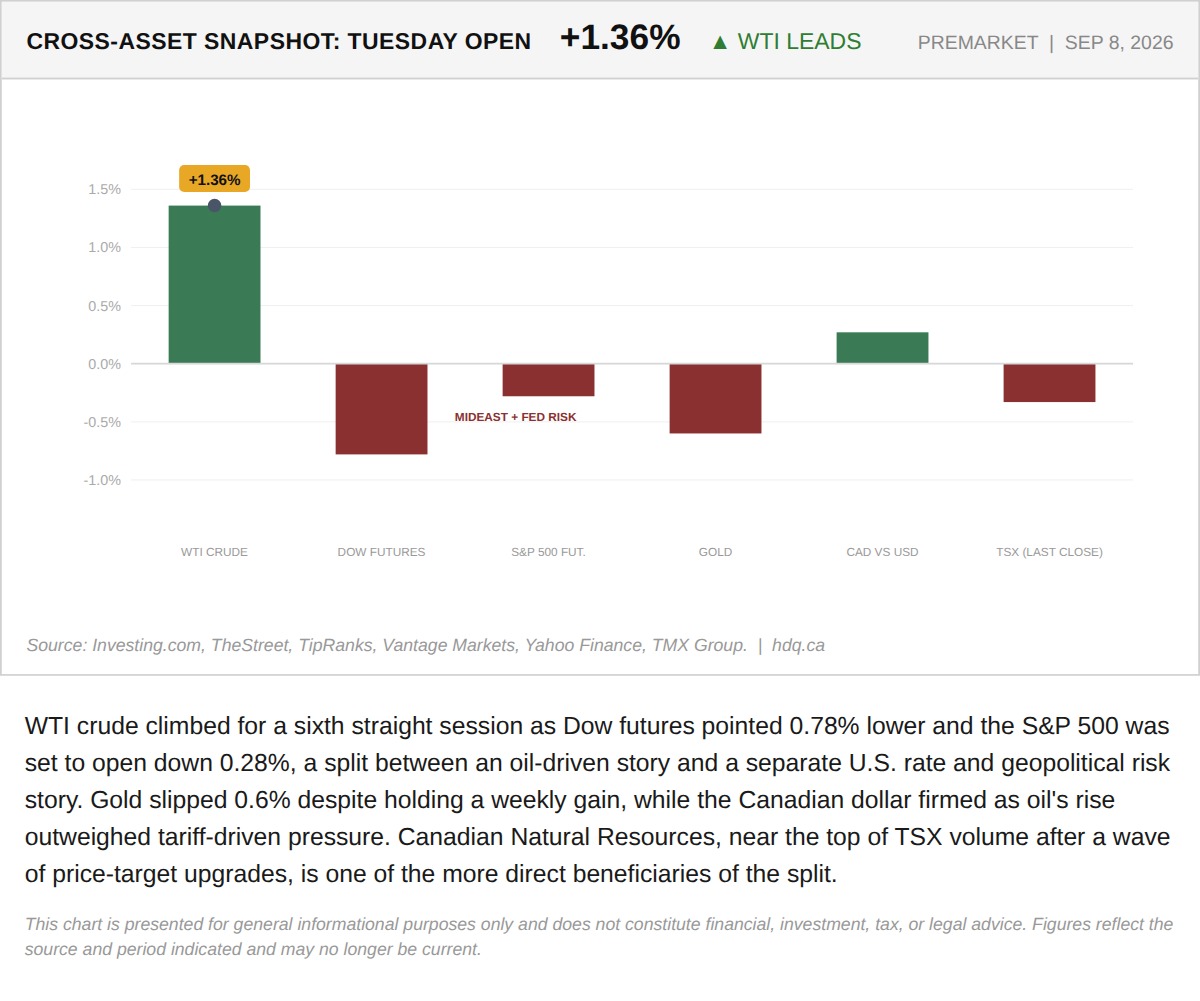
WTI crude climbed for a sixth straight session as Dow futures pointed 0.78% lower and the S&P 500 was set to open down 0.28%, a split between an oil-driven story and a separate U.S.
Dow Futures Fall 0.78% as Oil Climbs Toward $94, and Canadian Energy Is the Beneficiary
September 8, 2026
View chart & download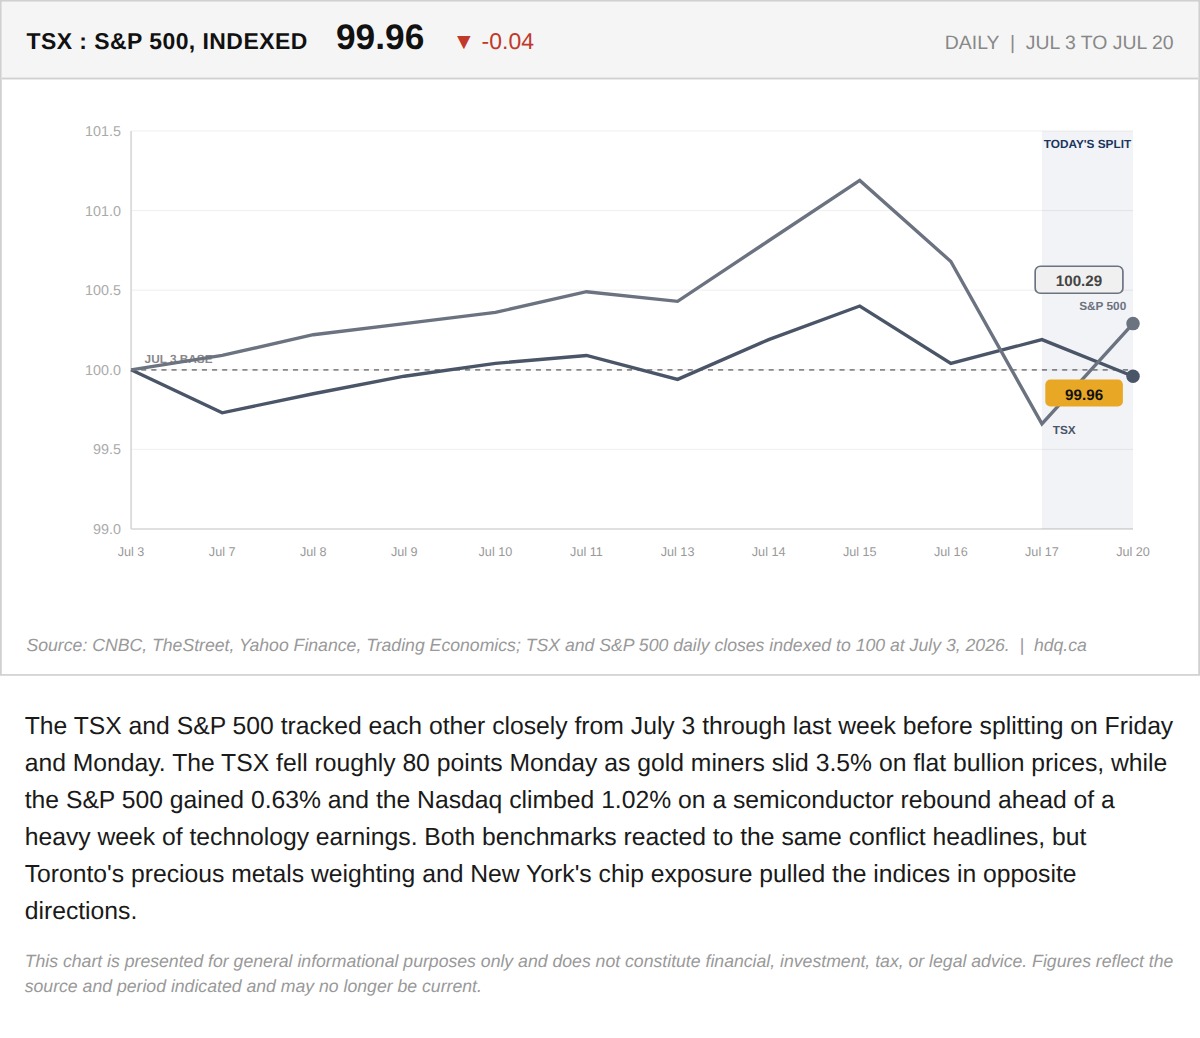
The TSX and S&P 500 tracked each other closely from July 3 through last week before splitting on Friday and Monday.
TSX Falls 80 Points as Gold Miners Slide 3.5%. The S&P 500 Rose 0.6% on the Exact Same Day.
July 20, 2026
View chart & download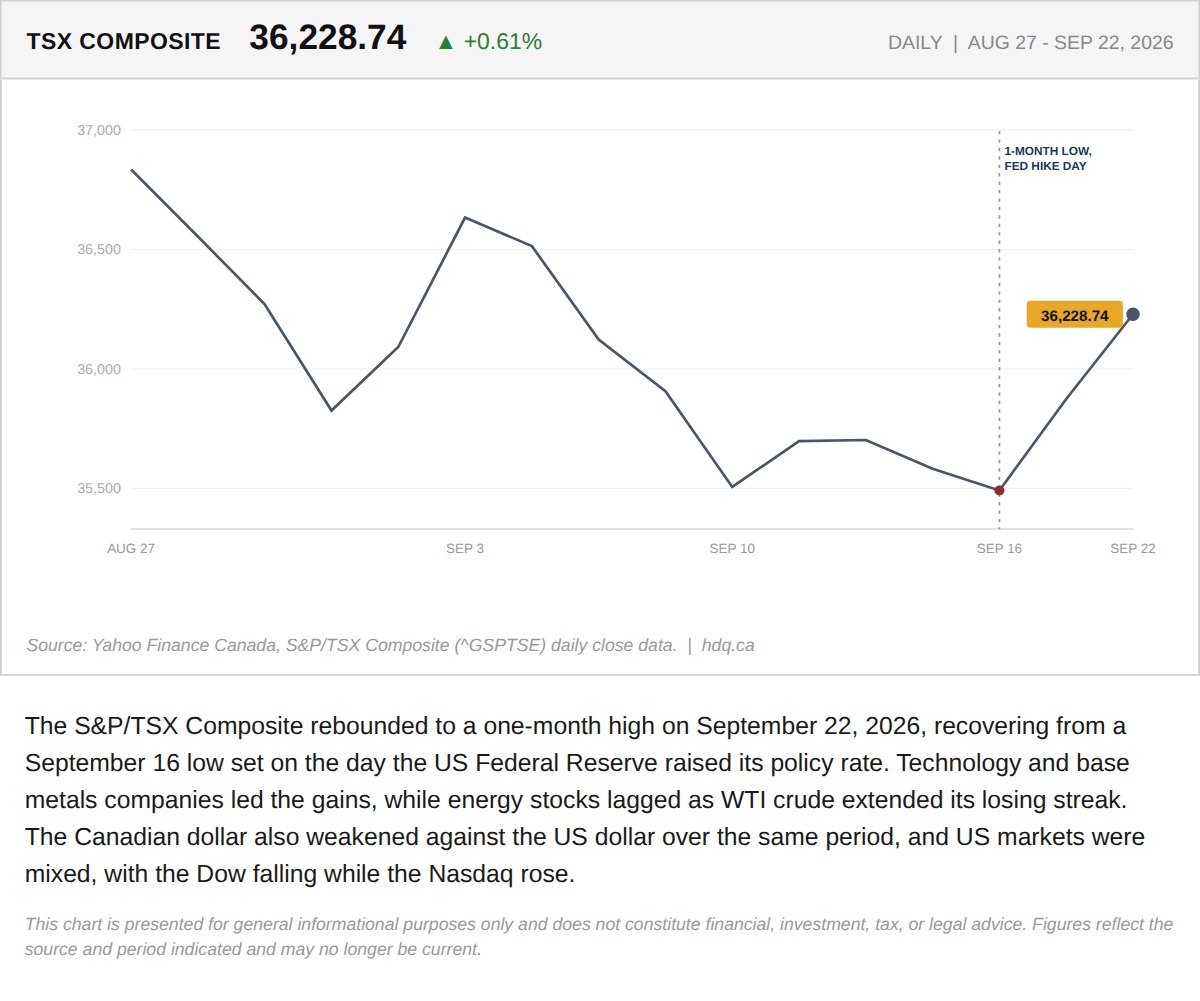
The S&P/TSX Composite rebounded to a one-month high on September 22, 2026, recovering from a September 16 low set on the day the US Federal Reserve raised its policy rate.
The TSX Hit a One-Month High on Tech and Base Metals While Energy Keeps Falling
September 23, 2026
View chart & download