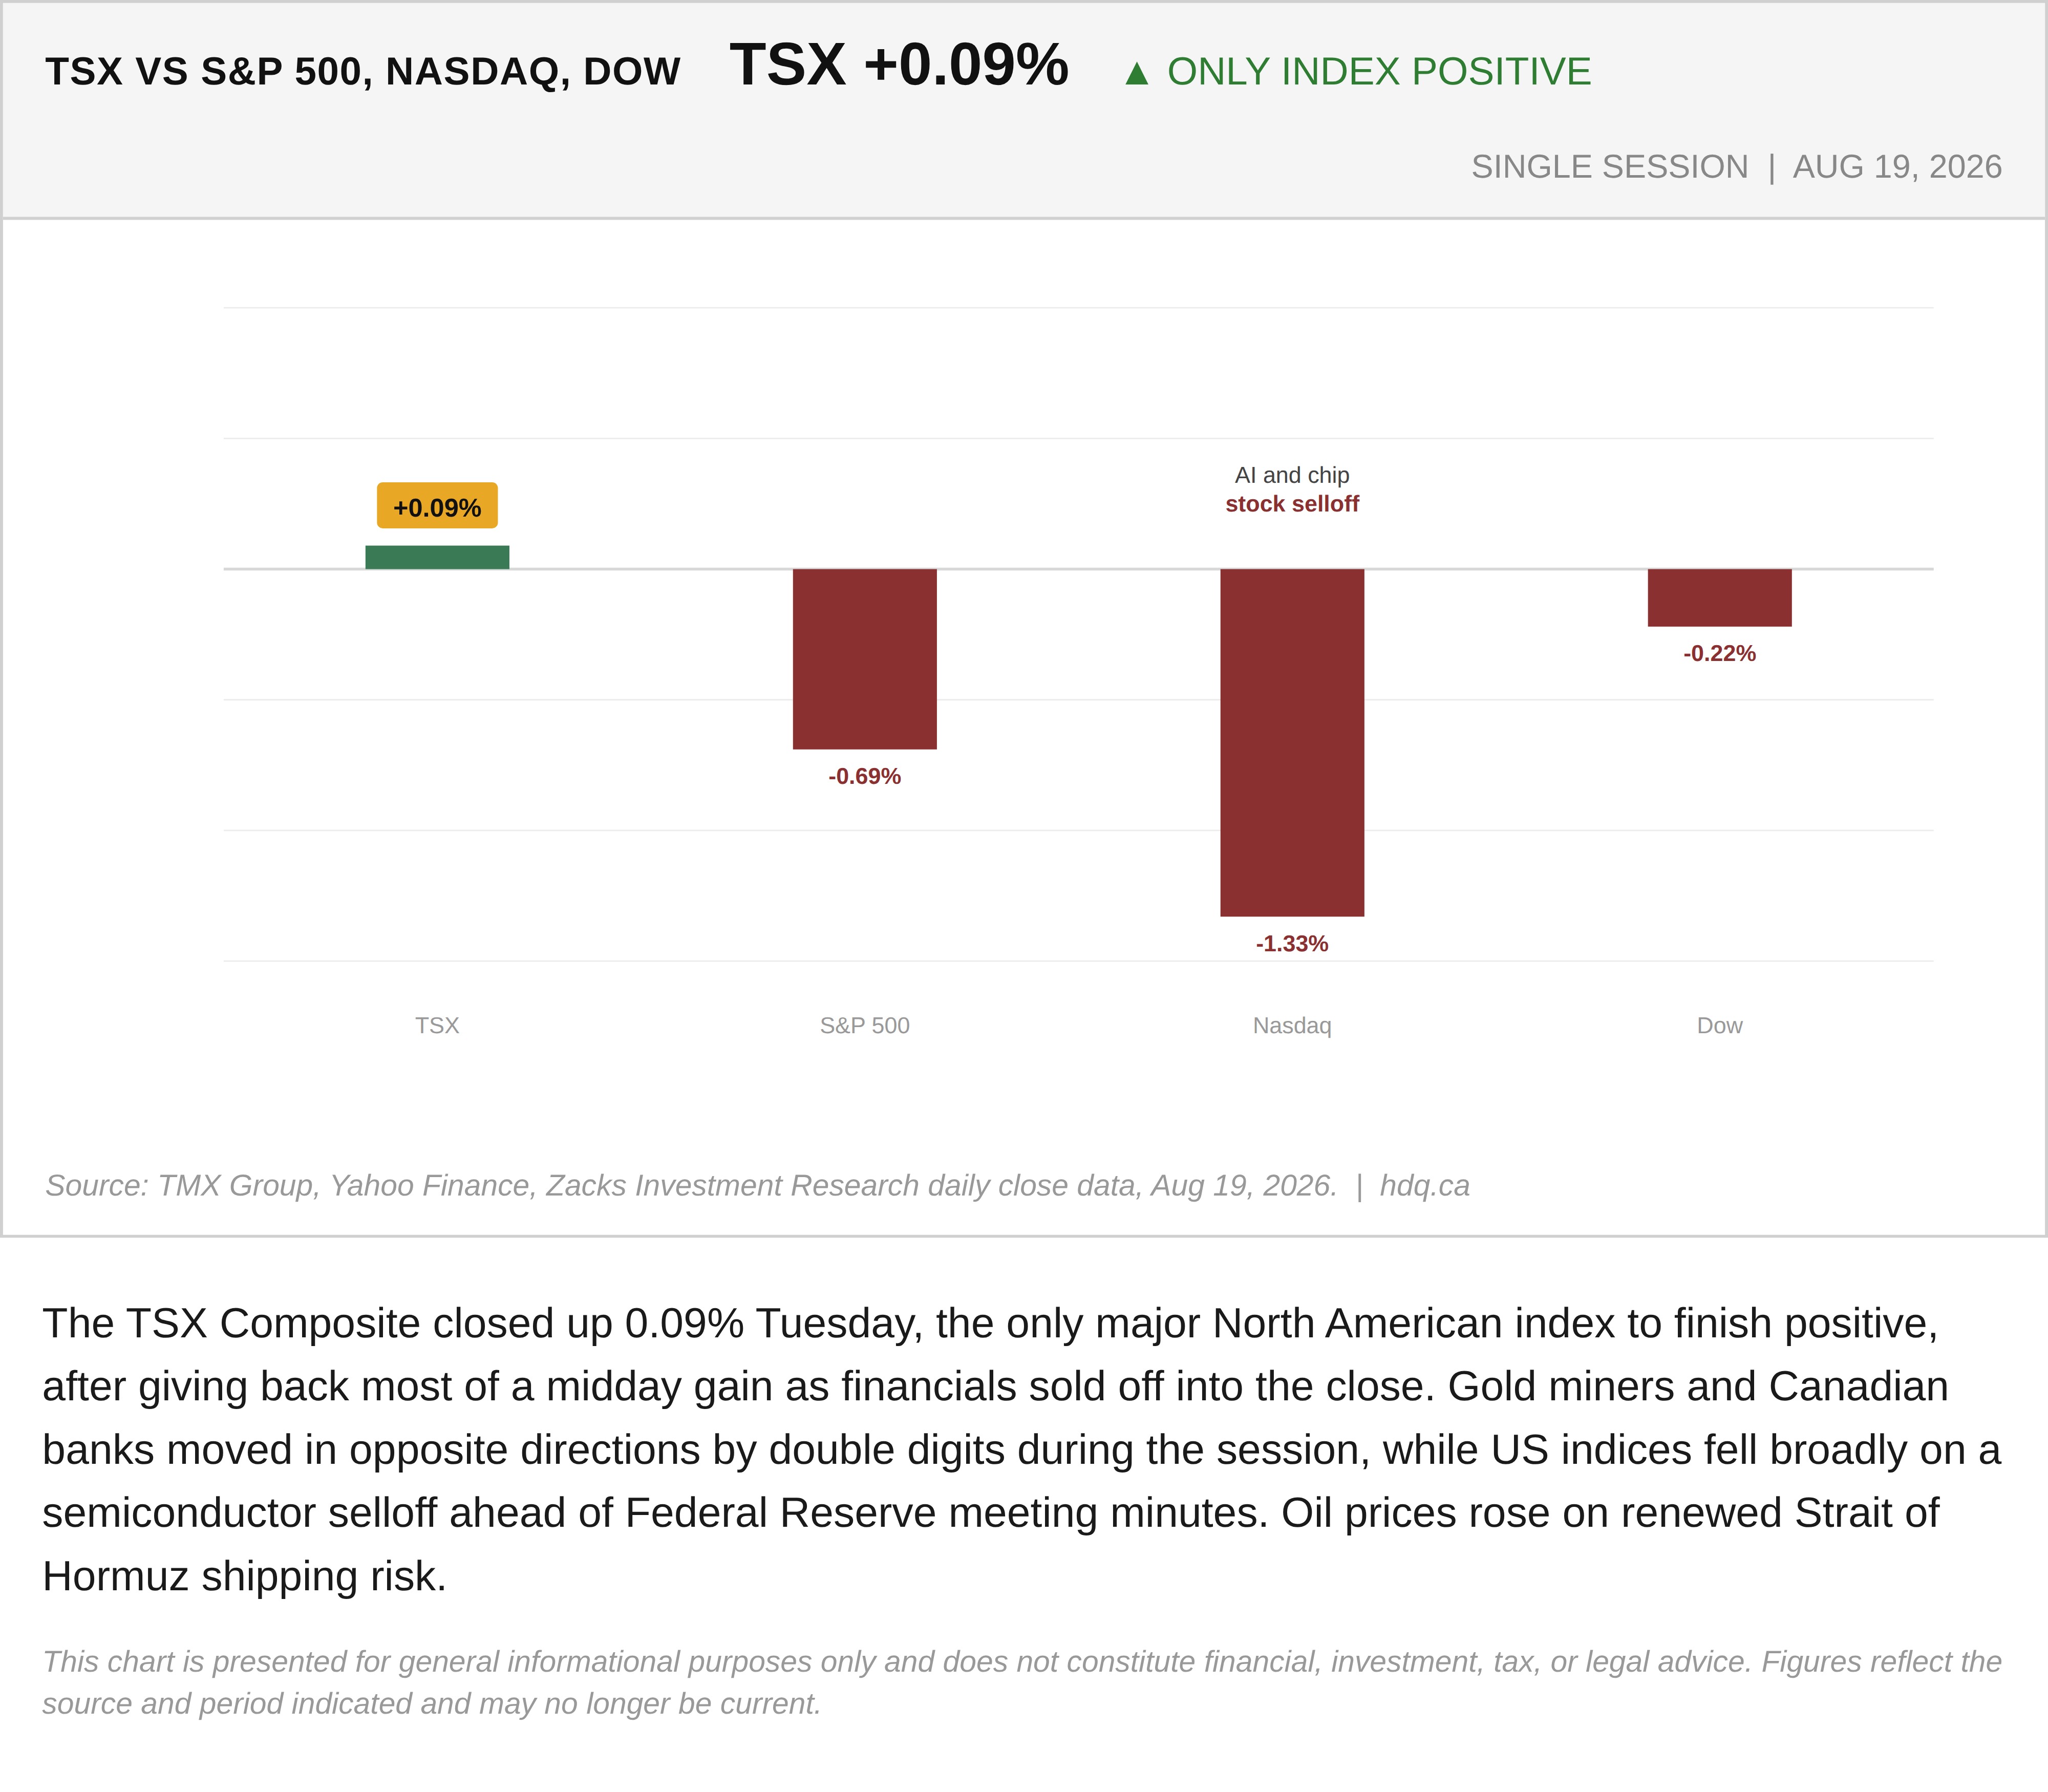
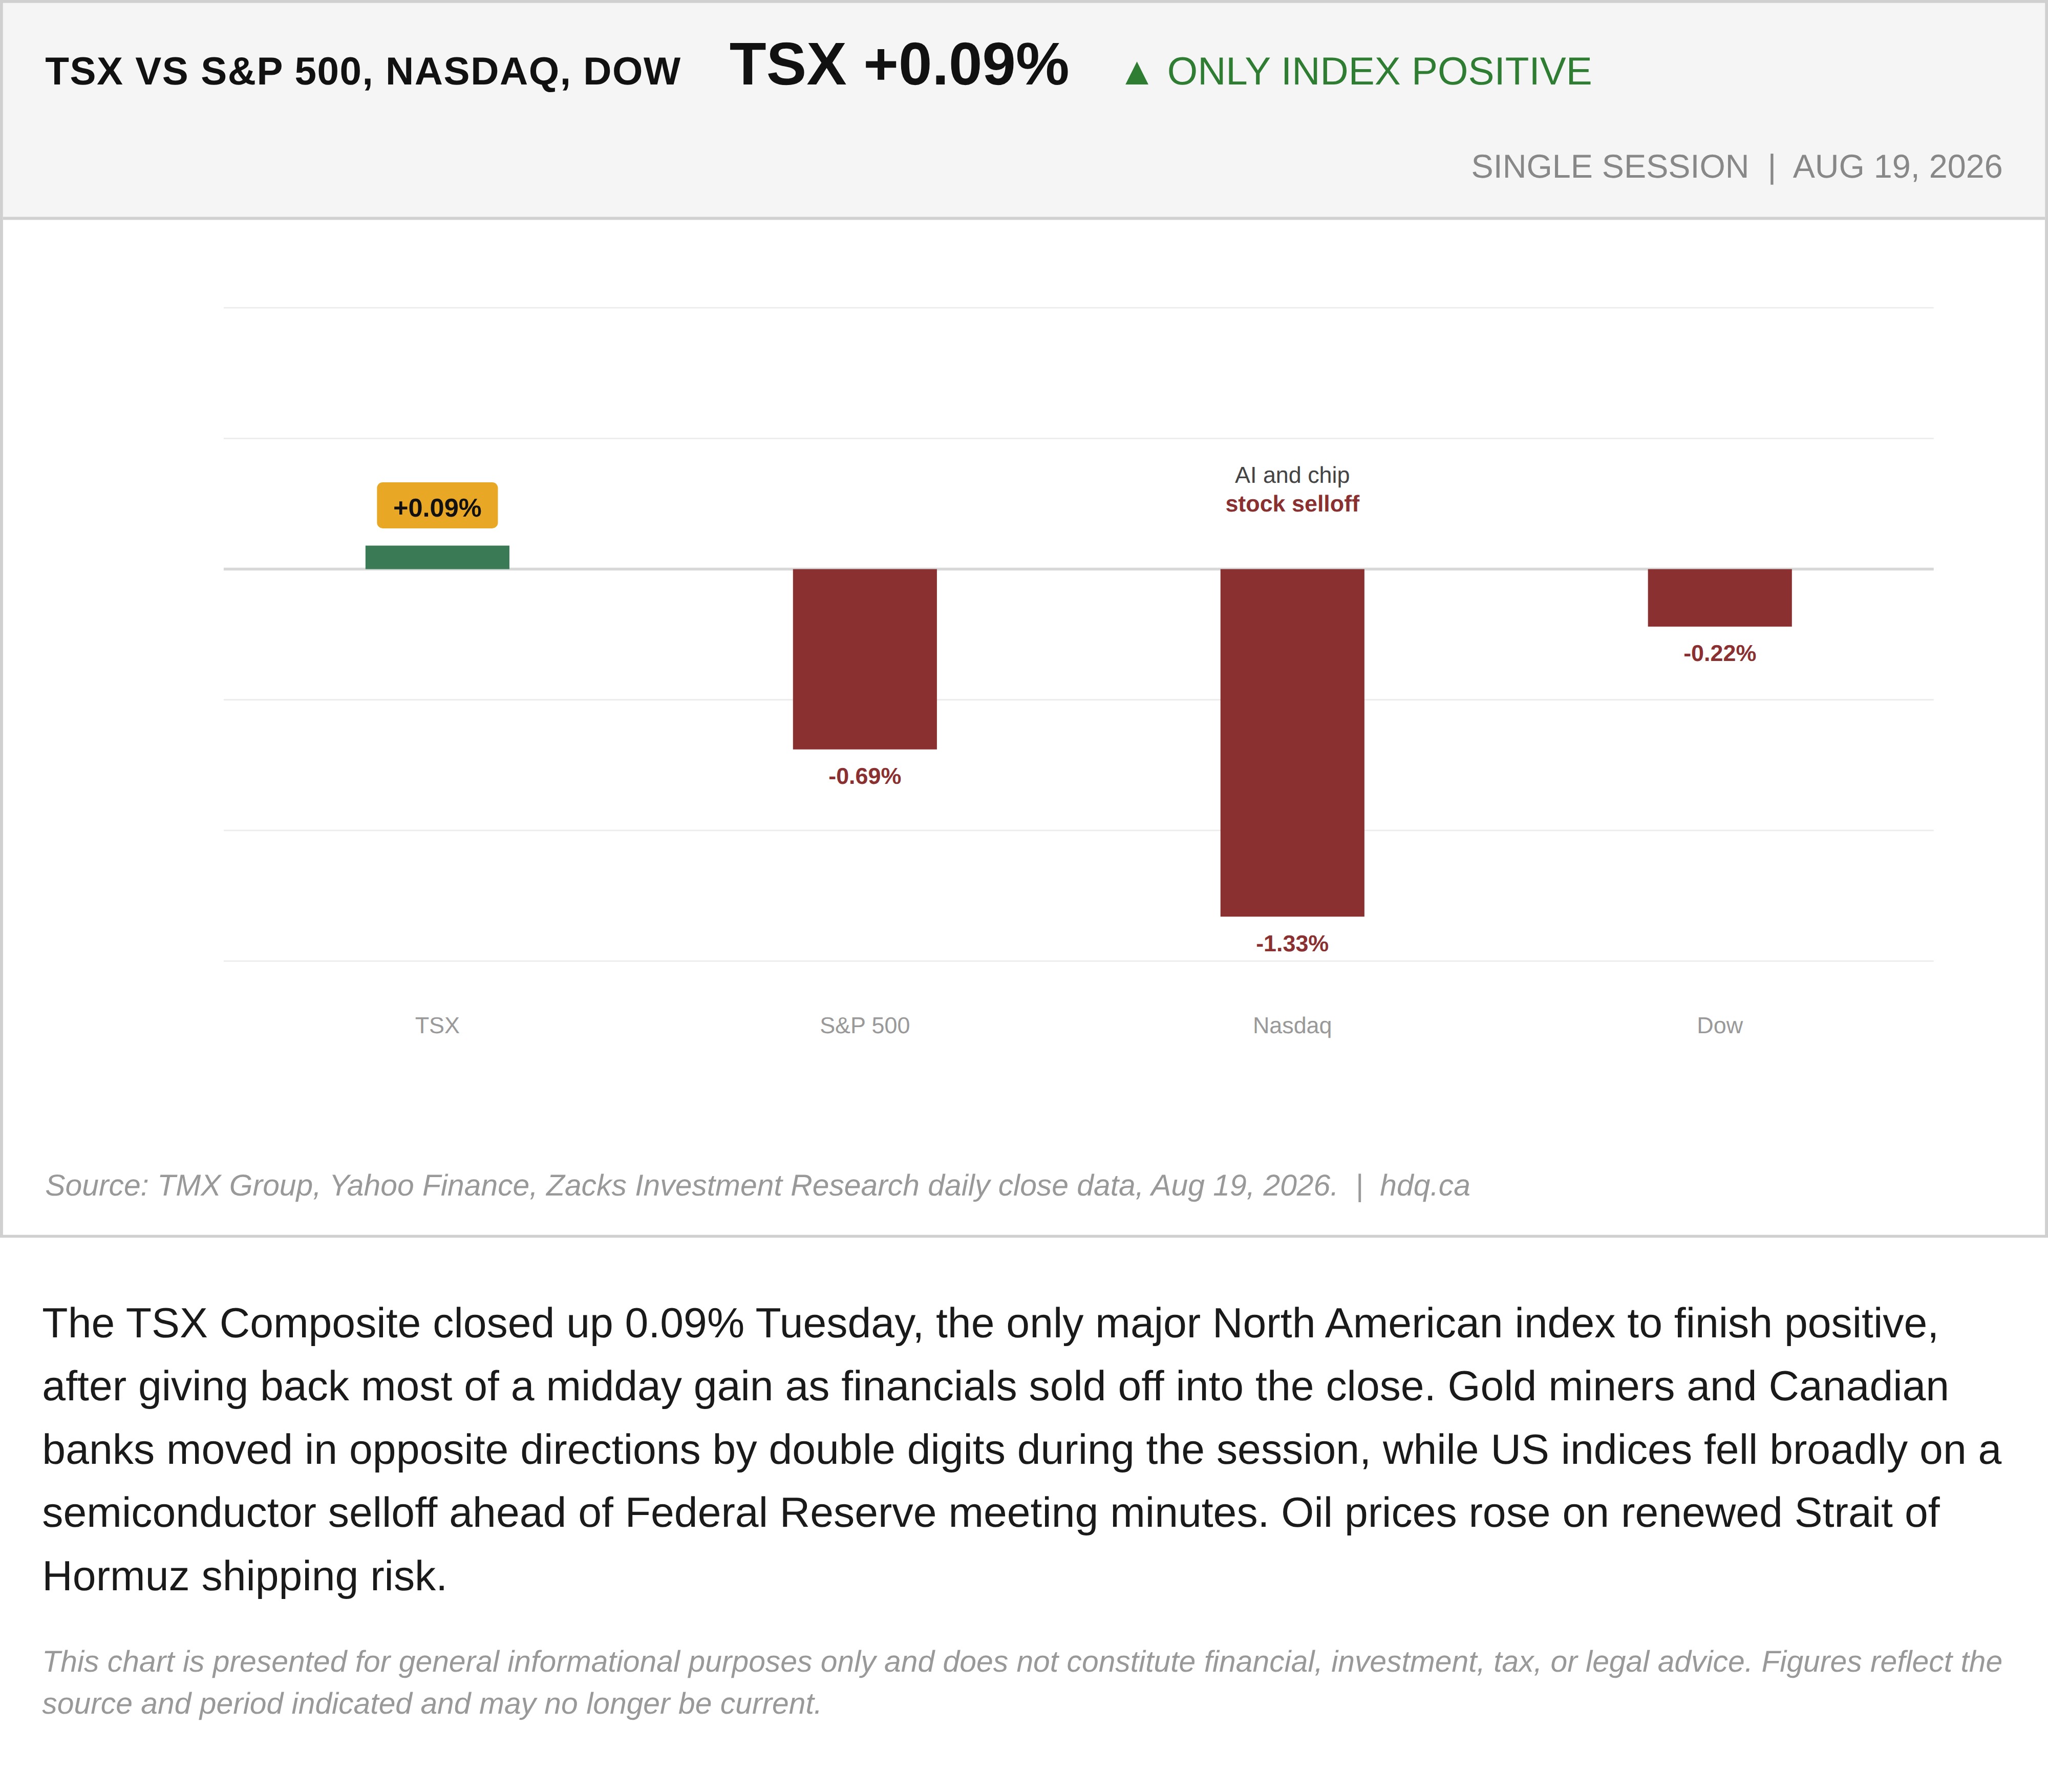
The TSX Composite closed up 0.09% Tuesday, the only major North American index to finish positive, after giving back most of a midday gain as financials sold off into the close. Gold miners and Canadian banks moved in opposite directions by double digits during the session, while US indices fell broadly on a semiconductor selloff ahead of Federal Reserve meeting minutes. Oil prices rose on renewed Strait of Hormuz shipping risk.
This chart is presented for general informational purposes only and does not constitute financial, investment, tax, or legal advice. Figures reflect the source and period indicated and may no longer be current.
Related charts
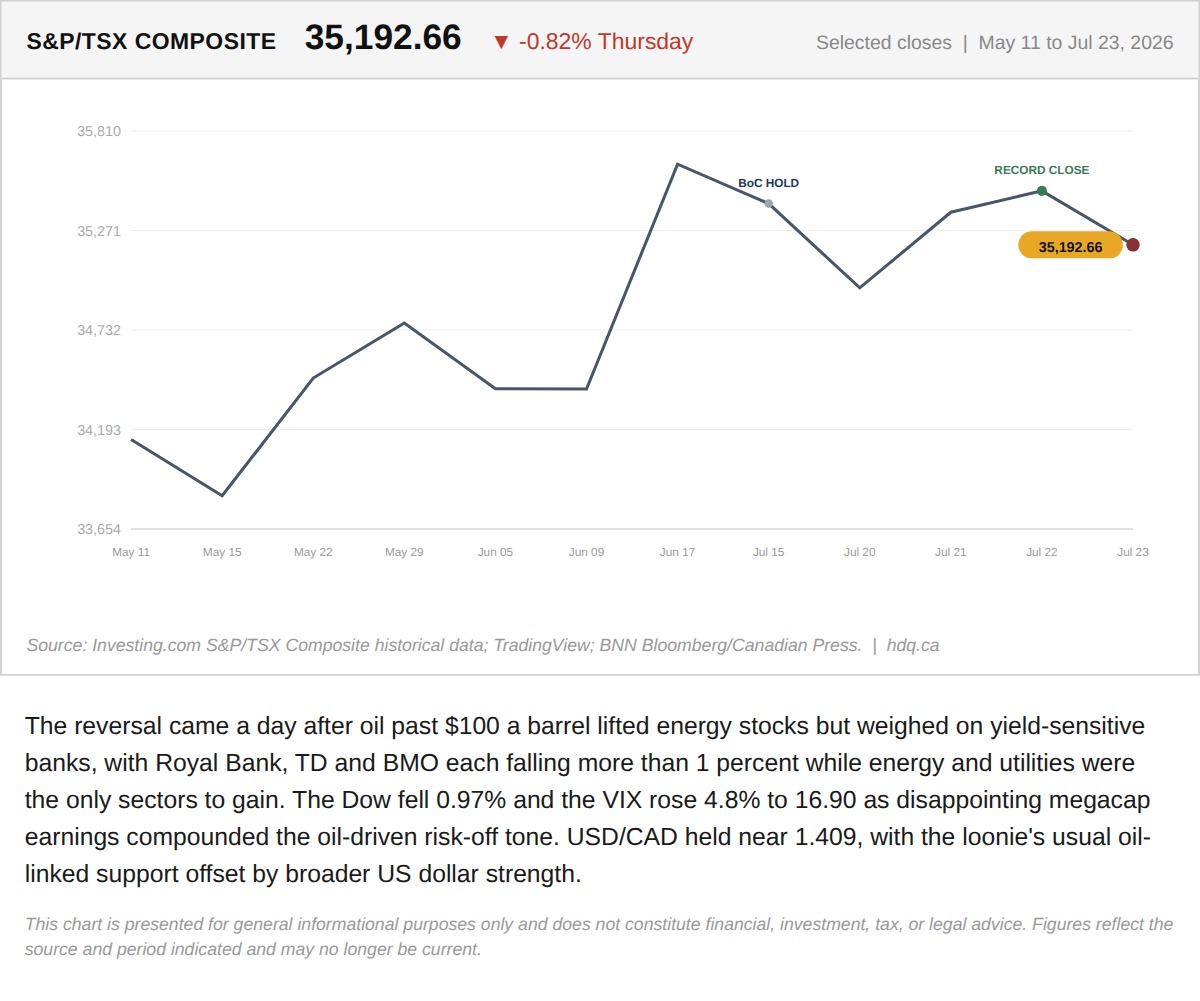
The reversal came a day after oil past $100 a barrel lifted energy stocks but weighed on yield-sensitive banks, with Royal Bank, TD and BMO…
Record High, Then a Bank-Led Reversal: Inside Thursday's TSX Split
July 24, 2026
View chart & download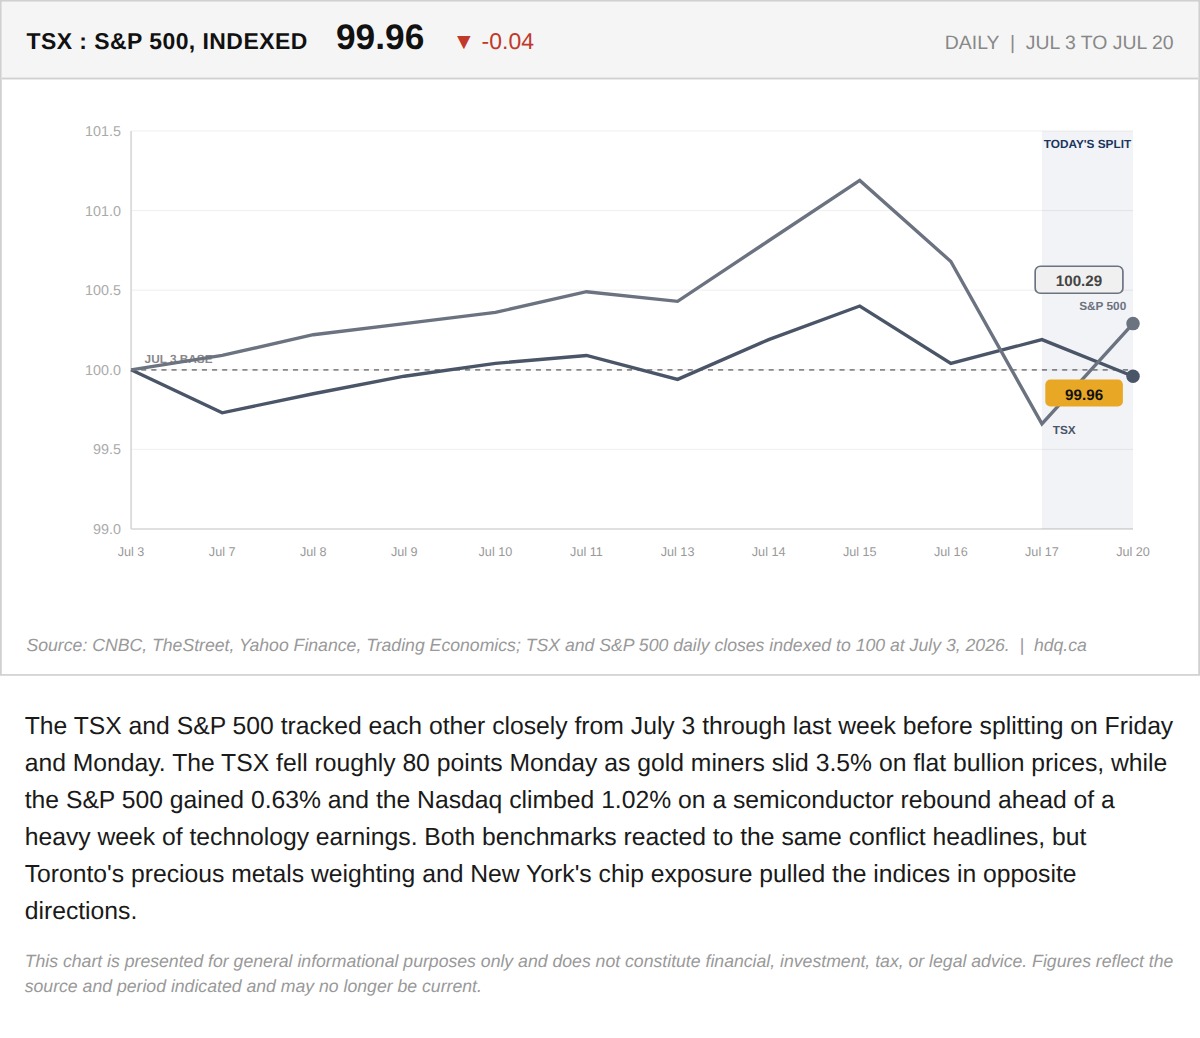
The TSX and S&P 500 tracked each other closely from July 3 through last week before splitting on Friday and Monday.
TSX Falls 80 Points as Gold Miners Slide 3.5%. The S&P 500 Rose 0.6% on the Exact Same Day.
July 20, 2026
View chart & download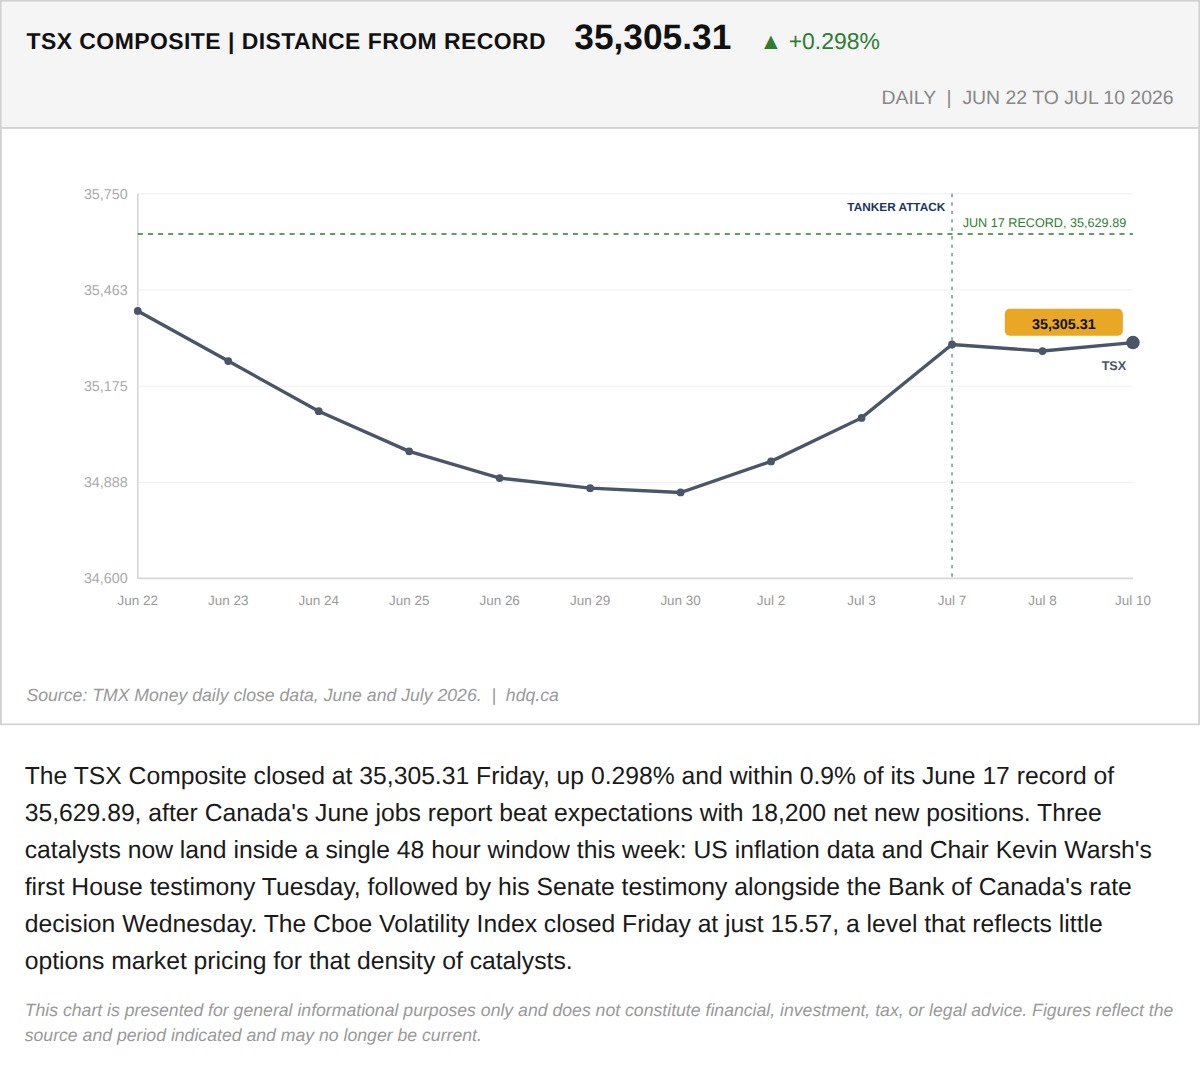
The TSX Composite closed at 35,305.31 Friday, up 0.298% and within 0.9% of its June 17 record of 35,629.89, after Canada's June jobs report…
324 Points From a Record, the TSX Heads Into Its Busiest 48 Hours of the Summer
July 13, 2026
View chart & download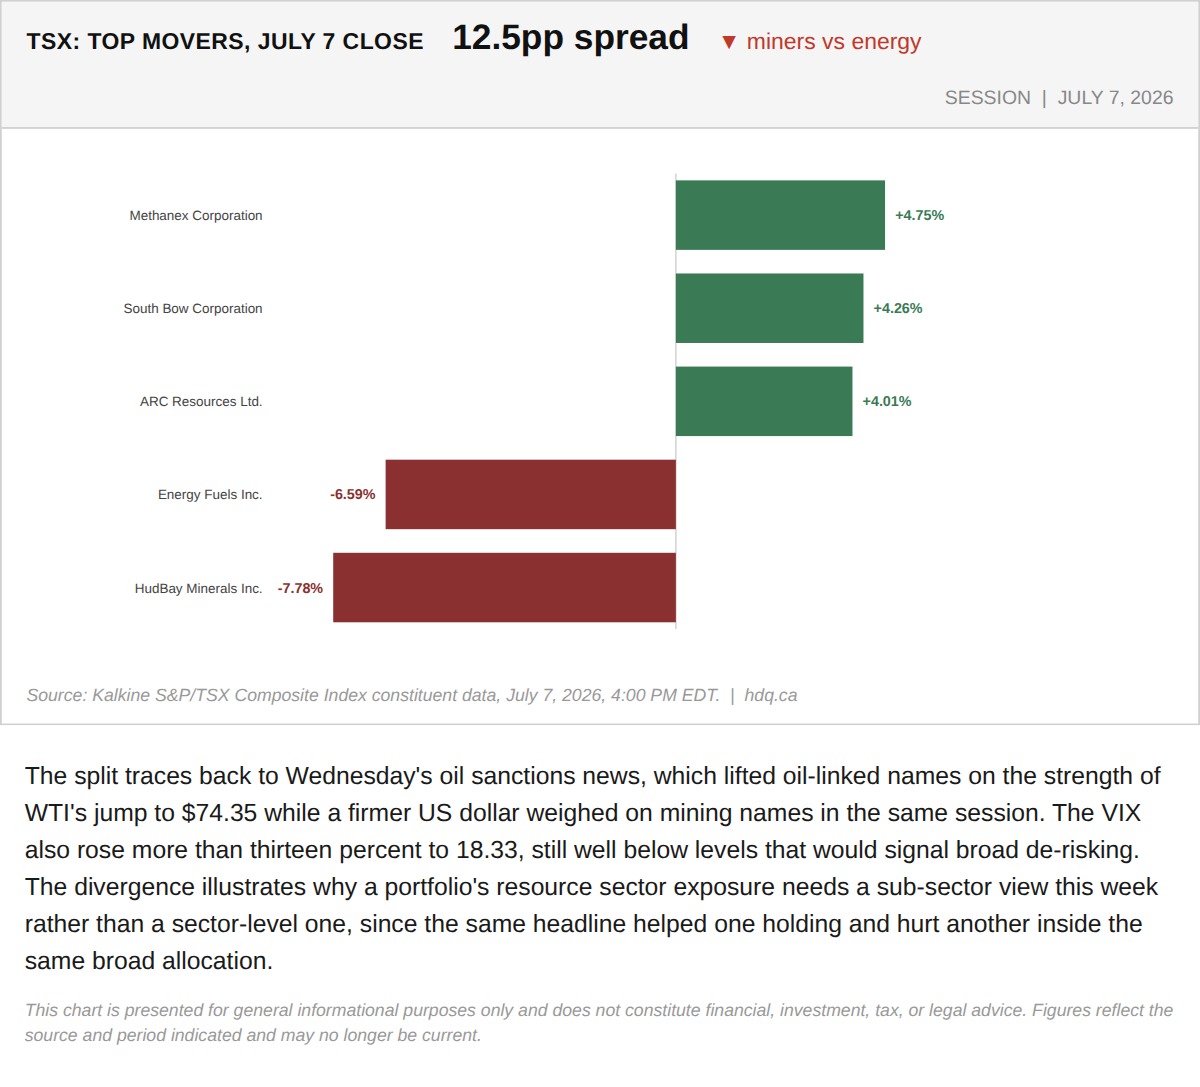
The split traces back to Wednesday's oil sanctions news, which lifted oil-linked names on the strength of WTI's jump to $74.35 while a…
July 8, 2026
View chart & download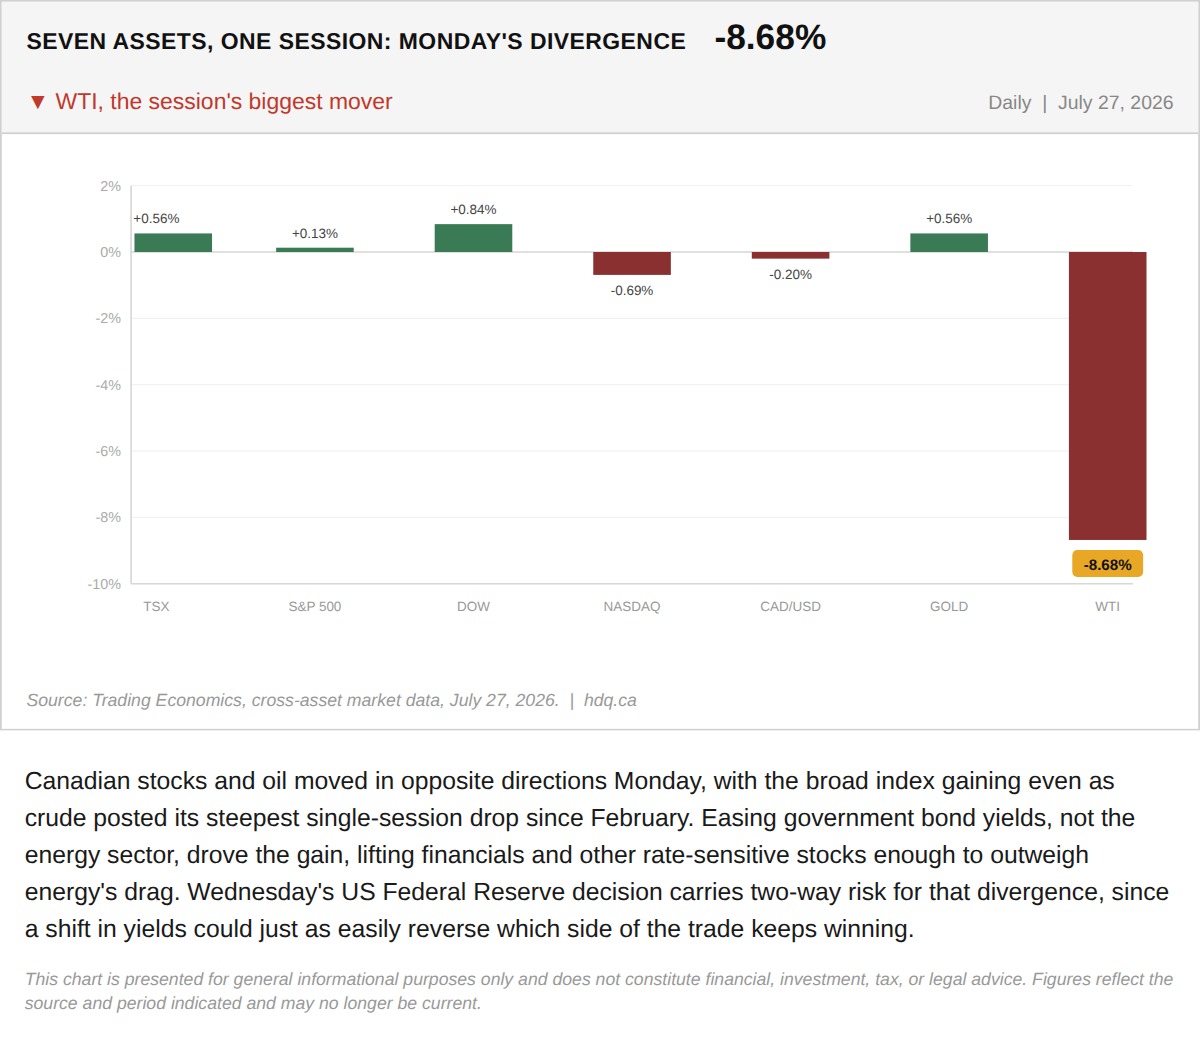
Canadian stocks and oil moved in opposite directions Monday, with the broad index gaining even as crude posted its steepest single-session drop since February.
The TSX Gained 0.56% Monday While Oil Fell 8.7%. That Divergence Is the Trade.
July 28, 2026
View chart & download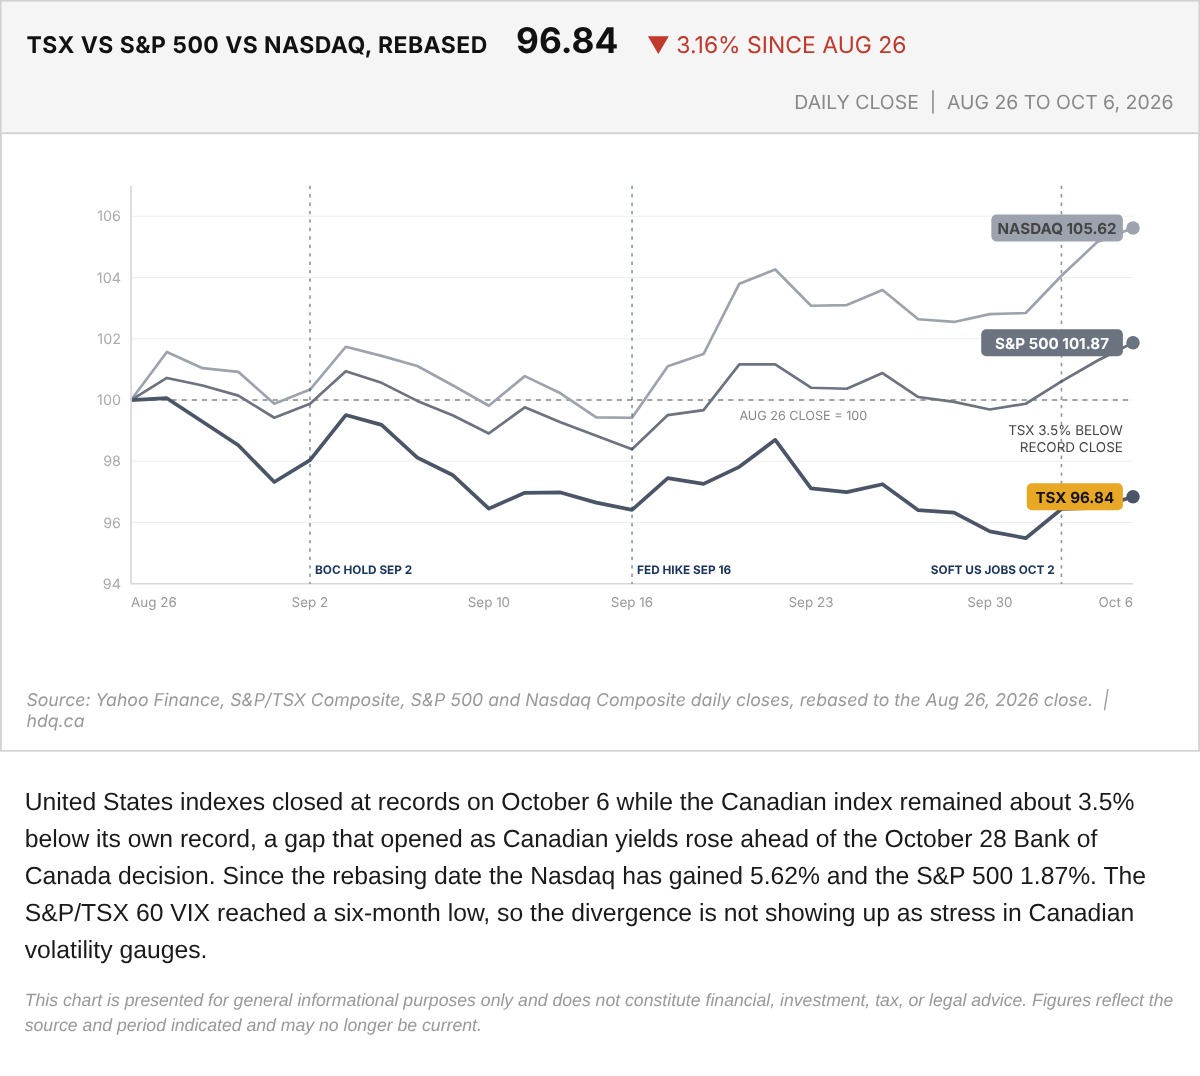
United States indexes closed at records on October 6 while the Canadian index remained about 3.5% below its own record, a gap that opened…
TSX, S&P 500 and Nasdaq Rebased to the August 26 Close
October 7, 2026
View chart & download