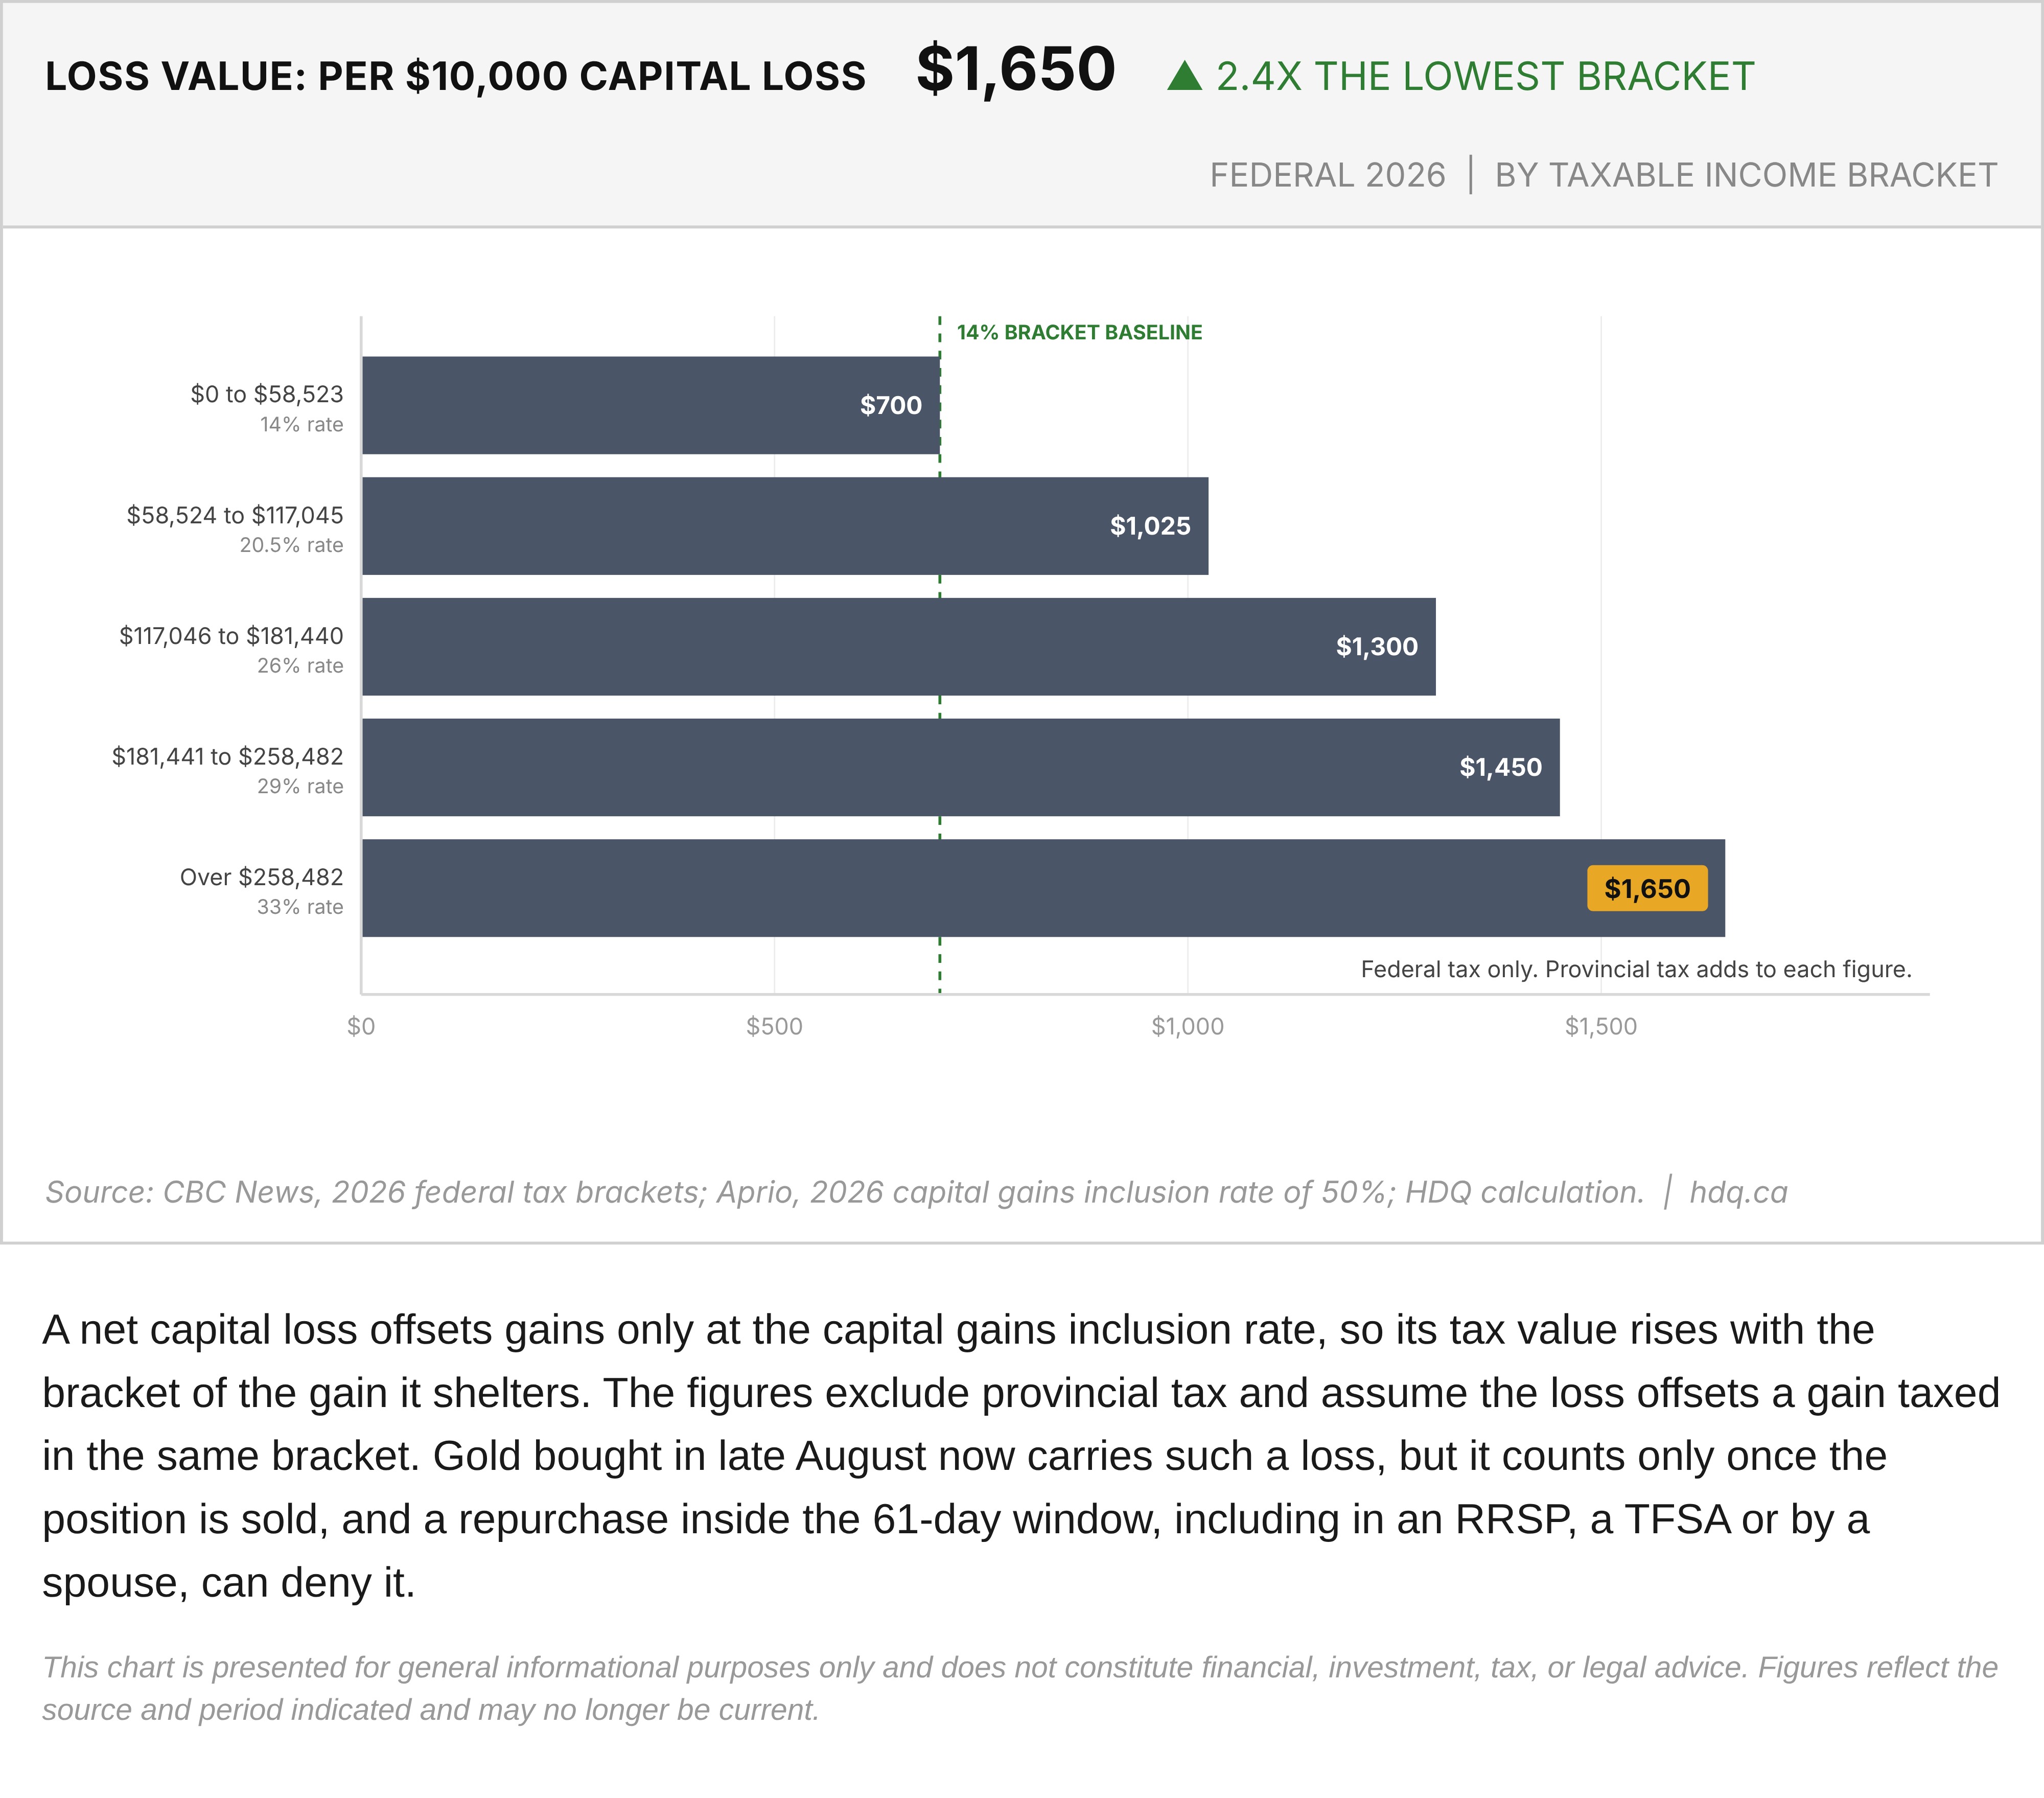
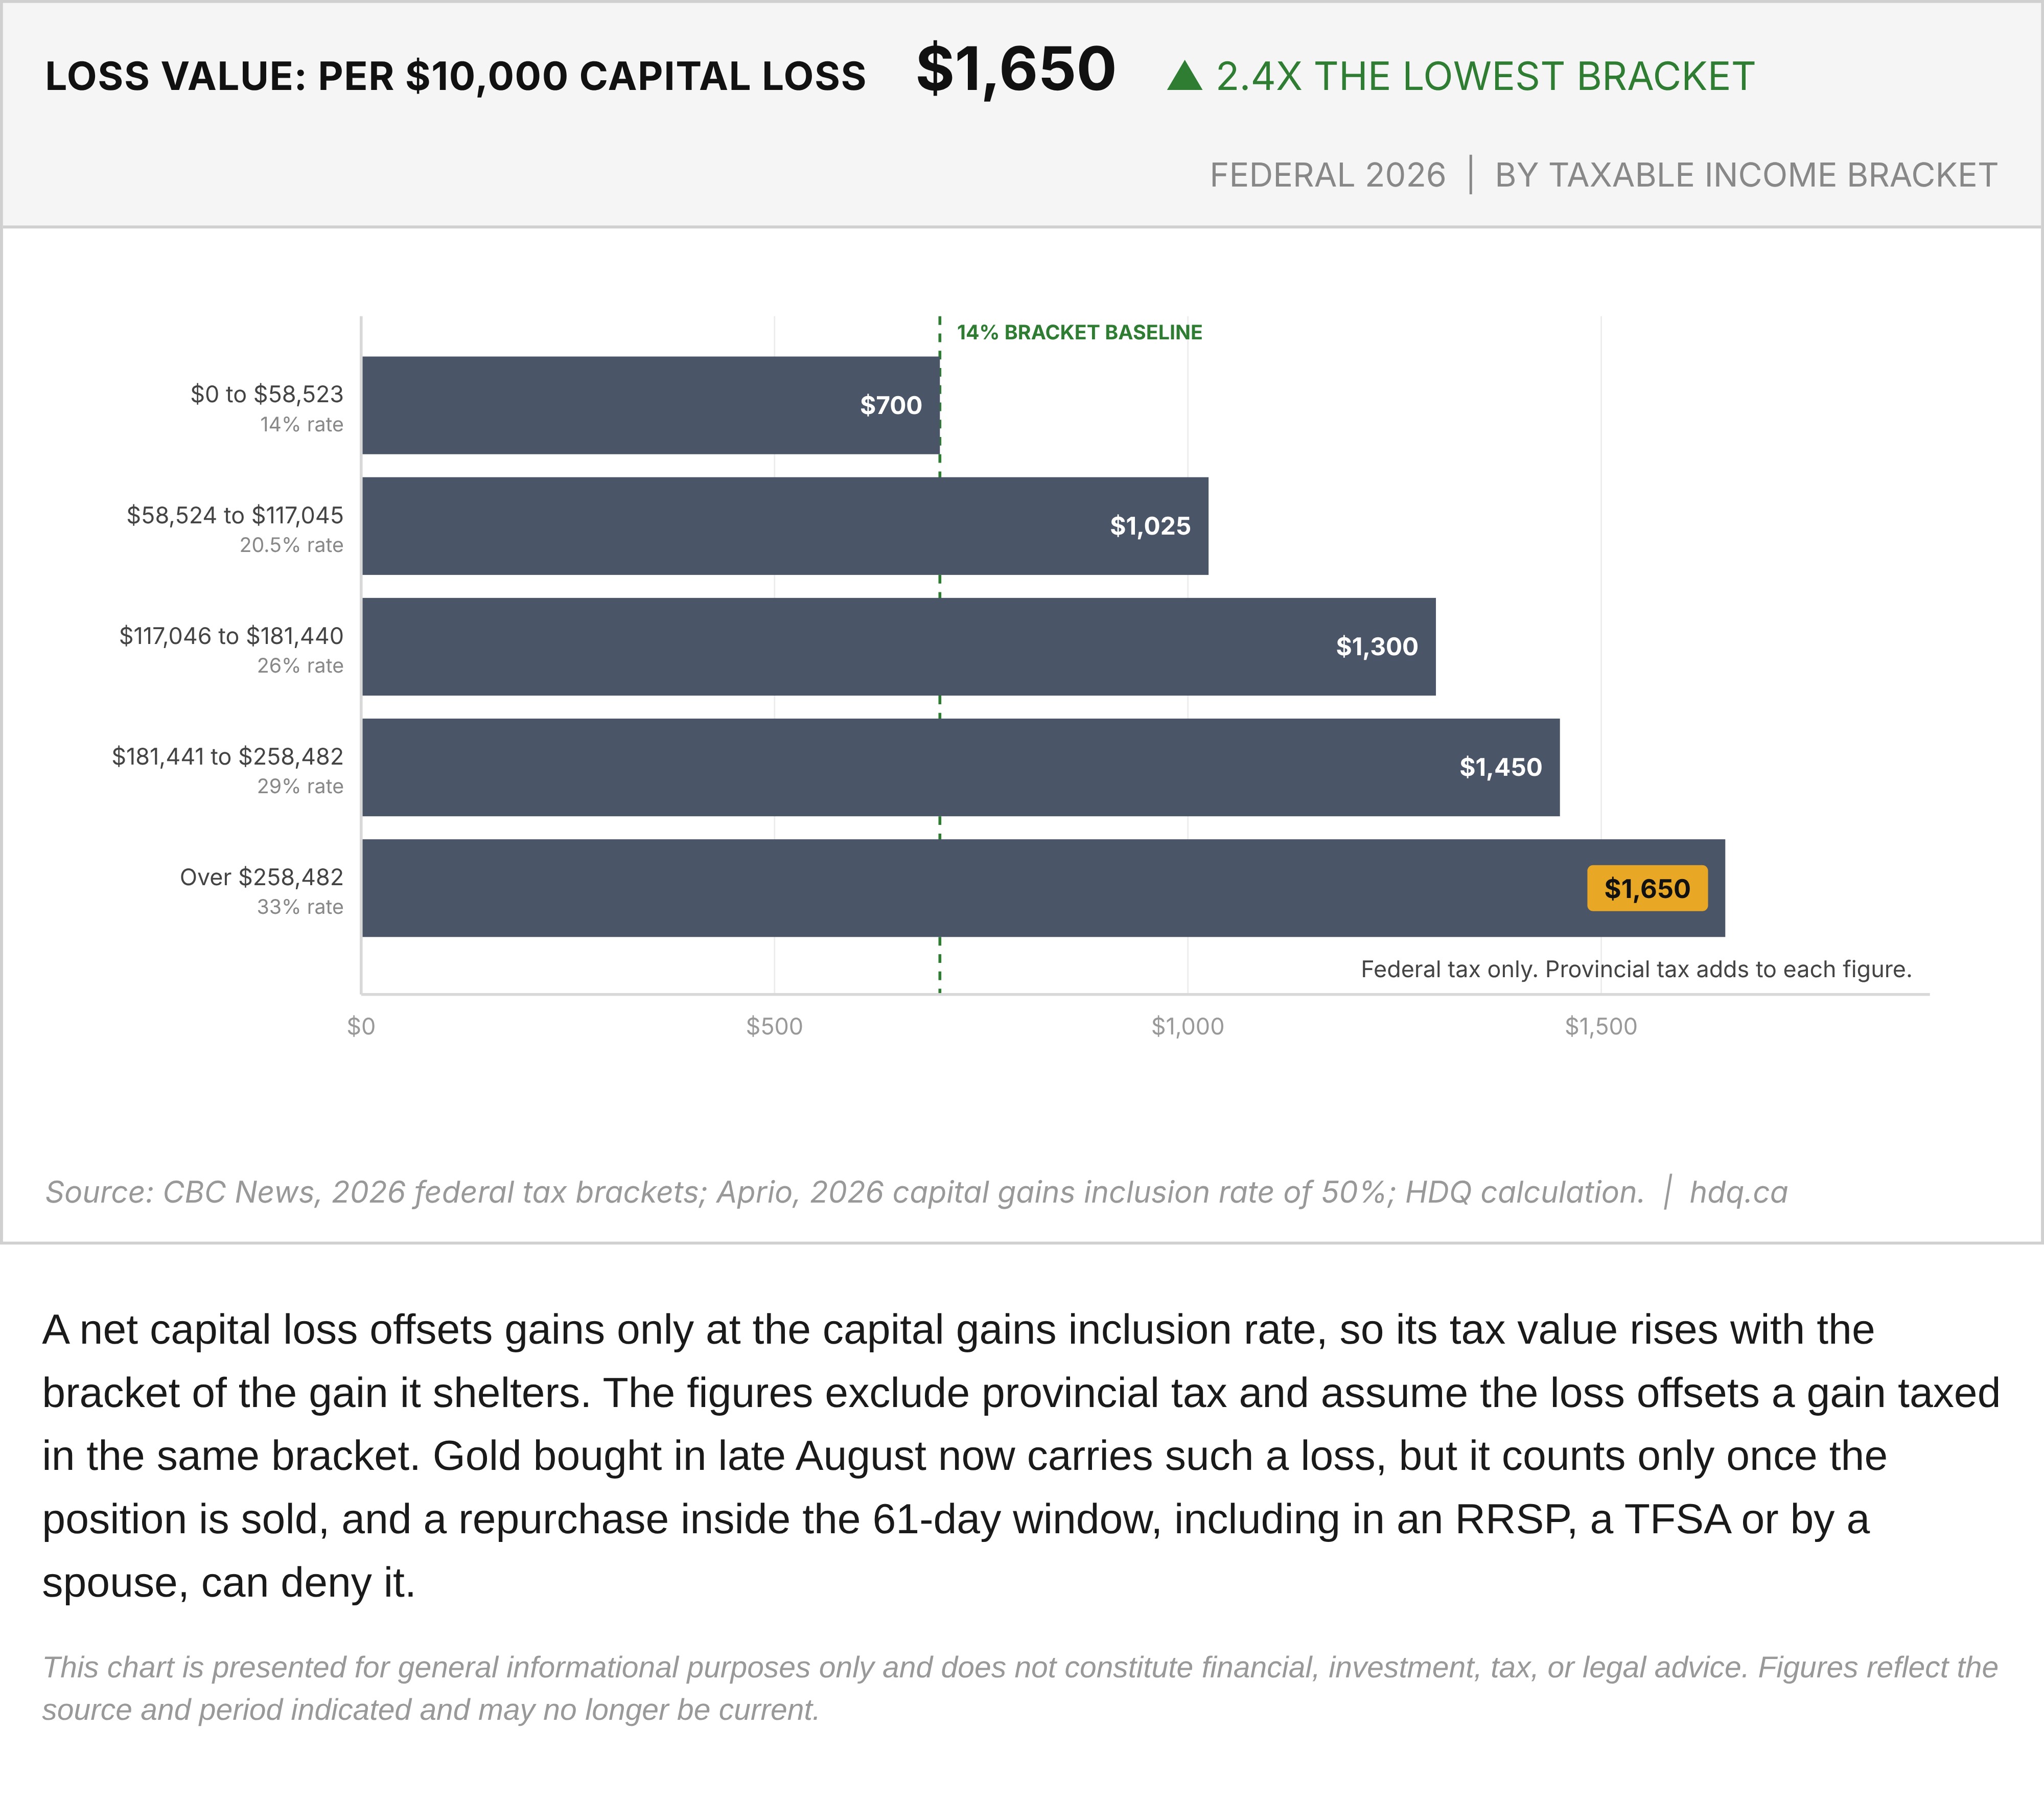
A net capital loss offsets gains only at the capital gains inclusion rate, so its tax value rises with the bracket of the gain it shelters. The figures exclude provincial tax and assume the loss offsets a gain taxed in the same bracket. Gold bought in late August now carries such a loss, but it counts only once the position is sold, and a repurchase inside the 61-day window, including in an RRSP, a TFSA or by a spouse, can deny it.
This chart is presented for general informational purposes only and does not constitute financial, investment, tax, or legal advice. Figures reflect the source and period indicated and may no longer be current.
Related charts
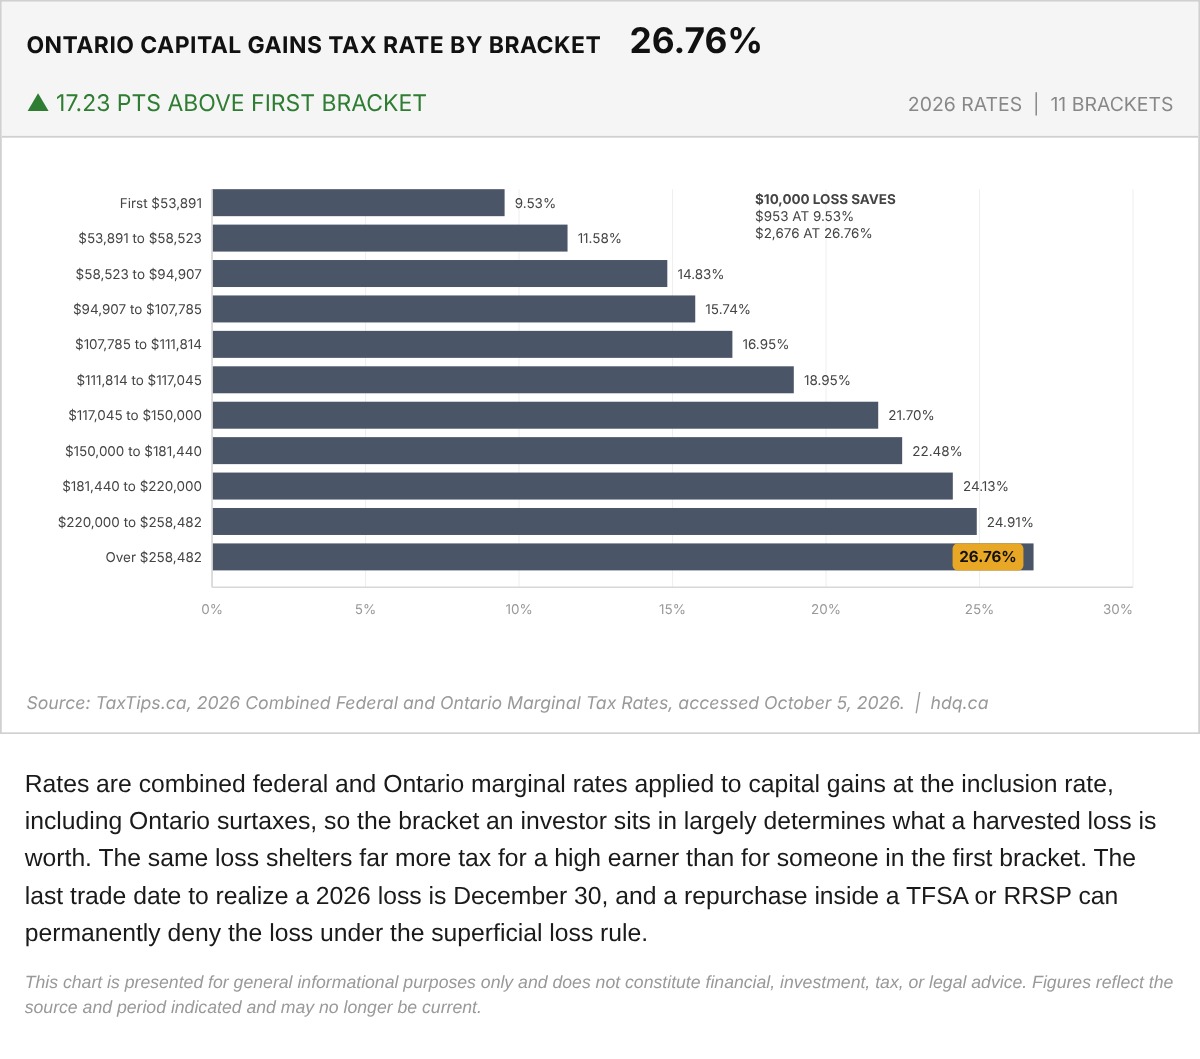
Rates are combined federal and Ontario marginal rates applied to capital gains at the inclusion rate, including Ontario surtaxes, so the…
Ontario Capital Gains Tax Rates by Income Bracket, 2026
October 5, 2026
View chart & download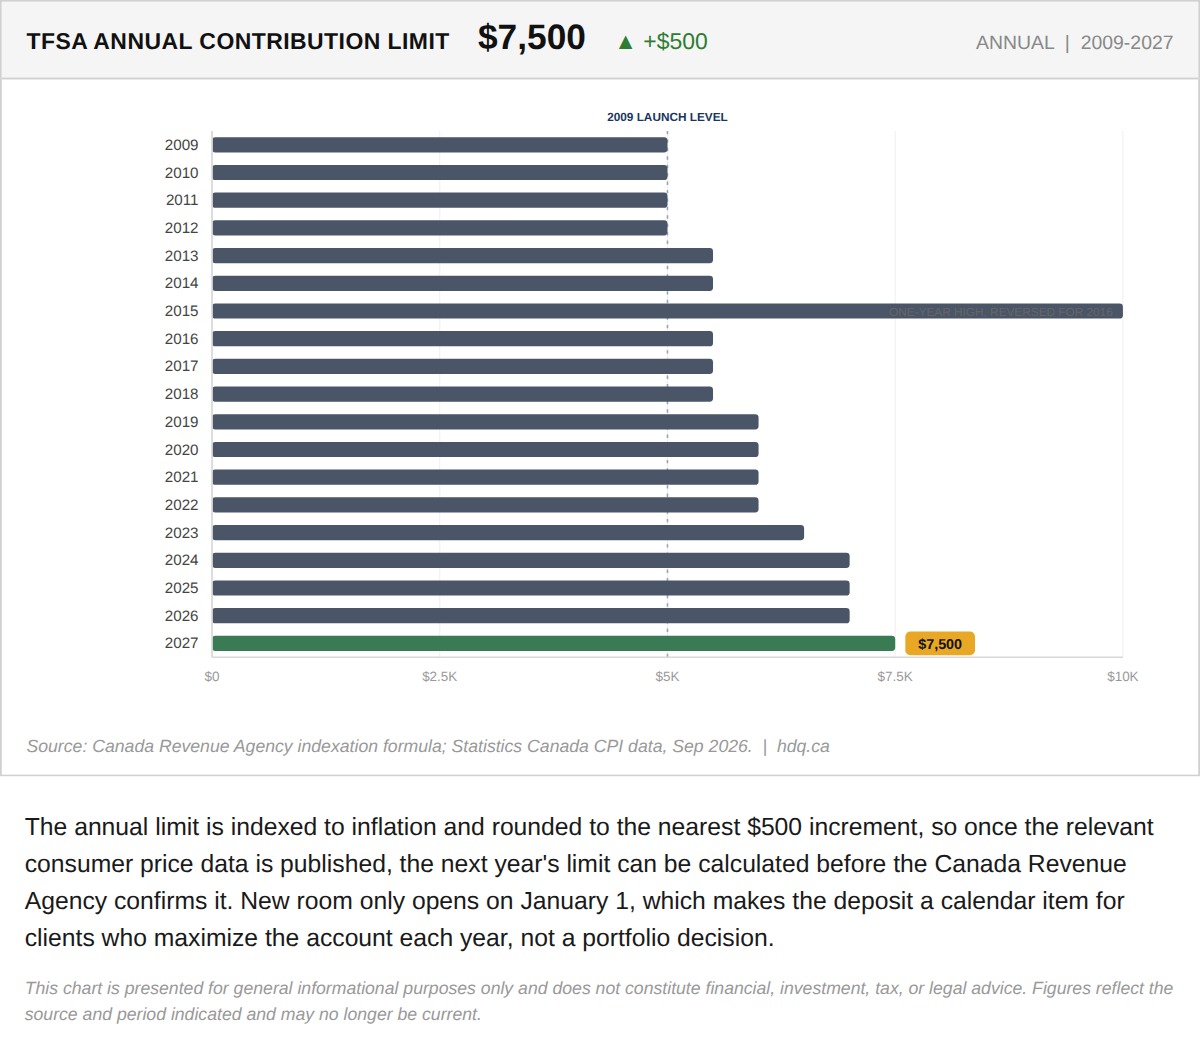
The annual limit is indexed to inflation and rounded to the nearest $500 increment, so once the relevant consumer price data is published,…
TFSA Annual Limit Set to Reach $7,500 in 2027
September 28, 2026
View chart & download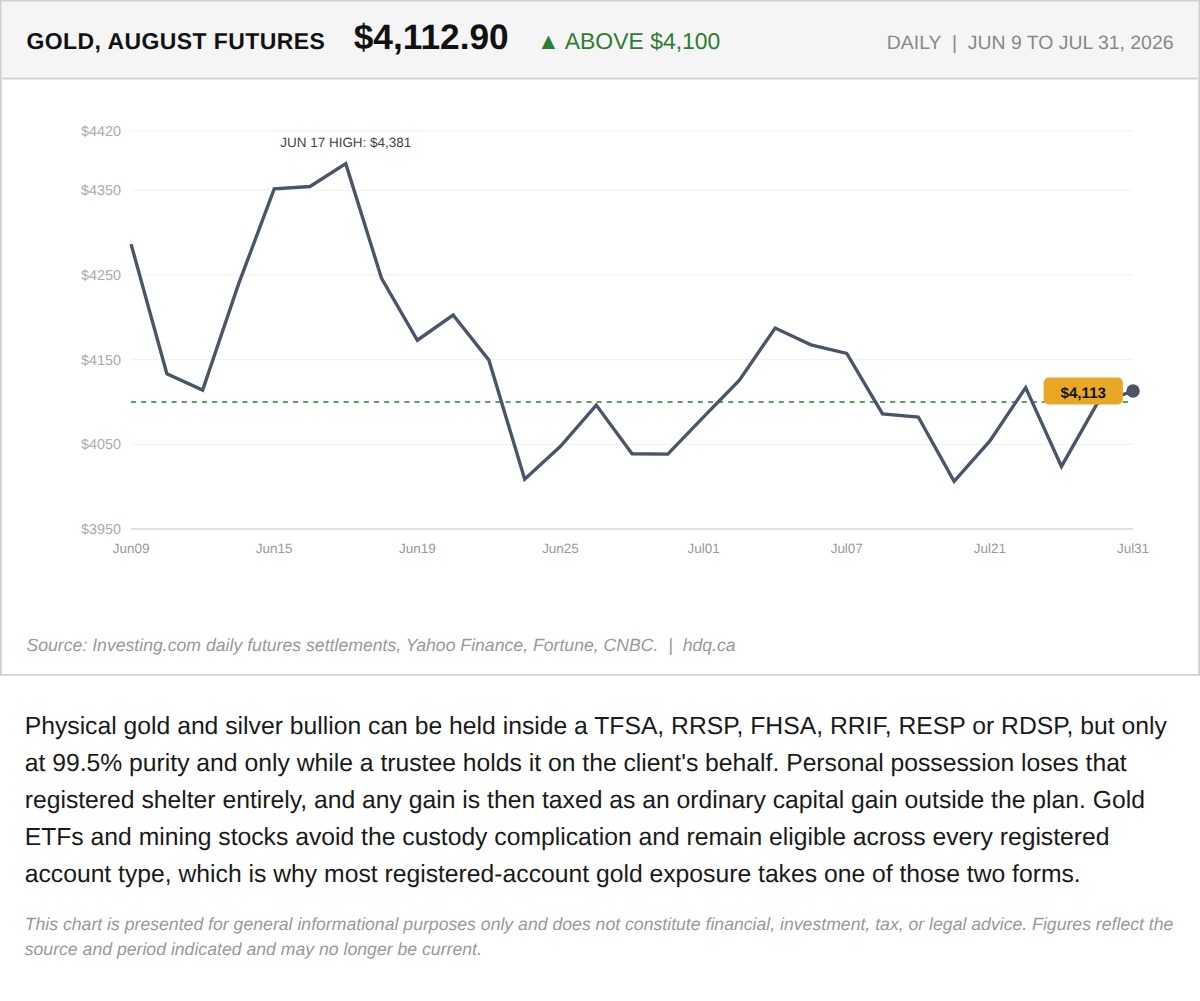
Physical gold and silver bullion can be held inside a TFSA, RRSP, FHSA, RRIF, RESP or RDSP, but only at 99.5% purity and only while a trustee holds it on the client's behalf.
Gold Broke $4,100 This Morning. Where a Client Holds It Decides How Much of the Gain Survives Tax.
July 31, 2026
View chart & download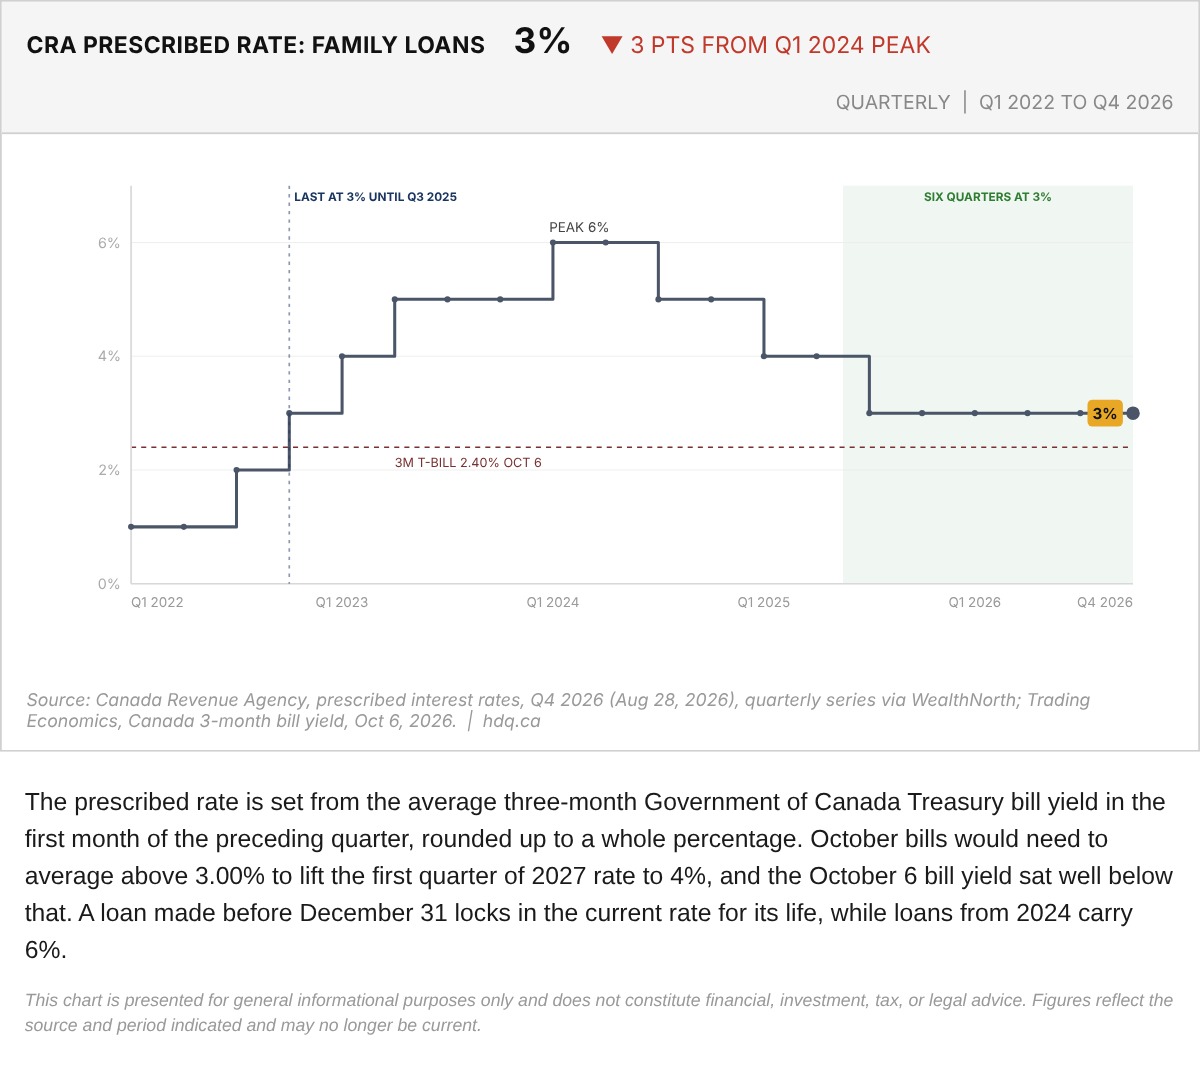
The prescribed rate is set from the average three-month Government of Canada Treasury bill yield in the first month of the preceding quarter, rounded up to a whole percentage.
CRA Prescribed Rate for Family Loans, Q1 2022 to Q4 2026
October 7, 2026
View chart & download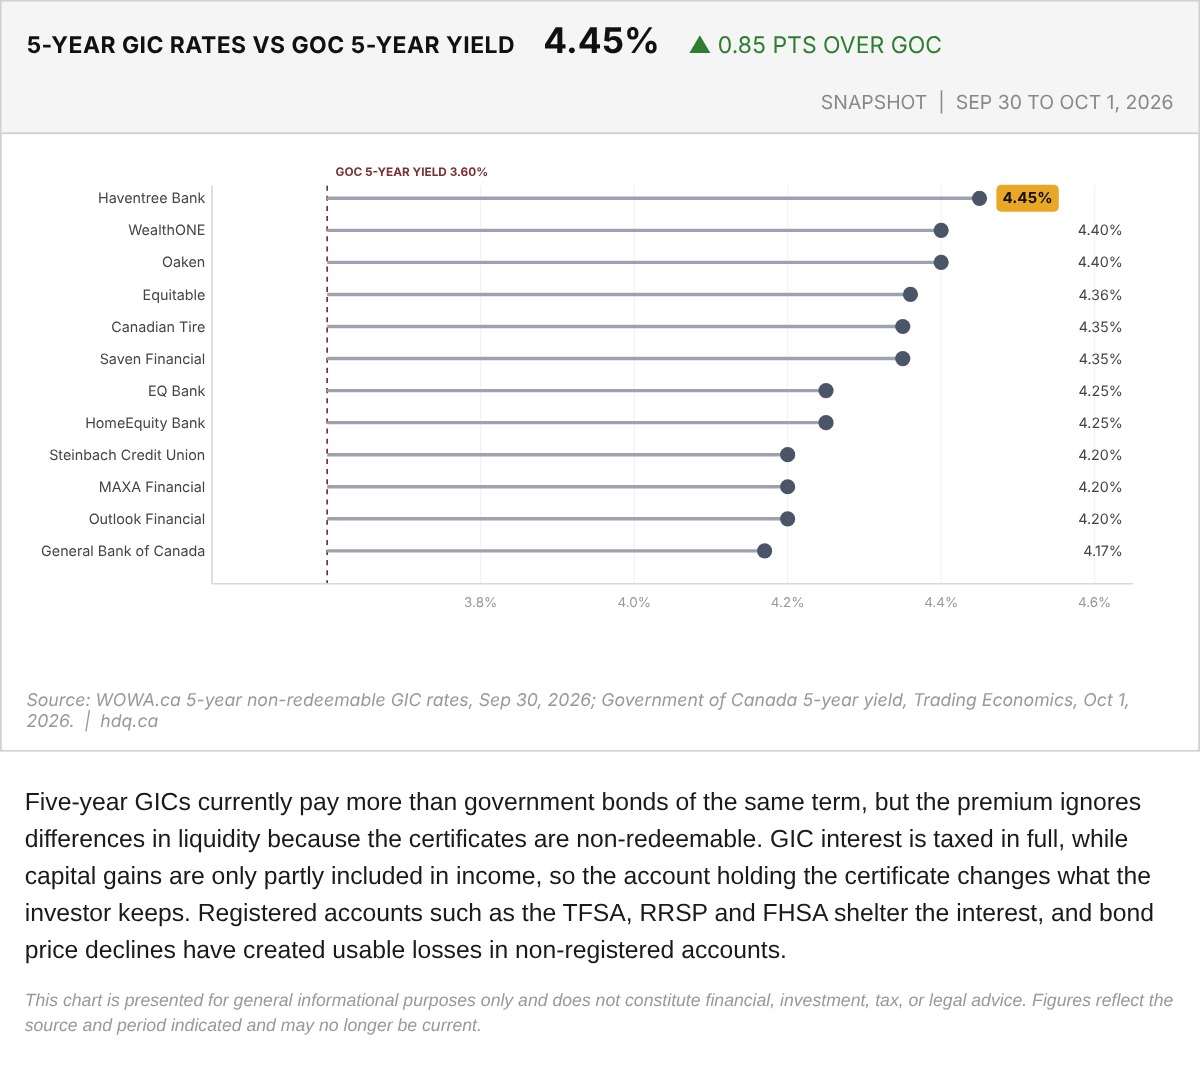
Five-year GICs currently pay more than government bonds of the same term, but the premium ignores differences in liquidity because the certificates are non-redeemable.
Five-Year GIC Rates Versus the Government of Canada 5-Year Yield, September 30 to October 1, 2026
October 2, 2026
View chart & download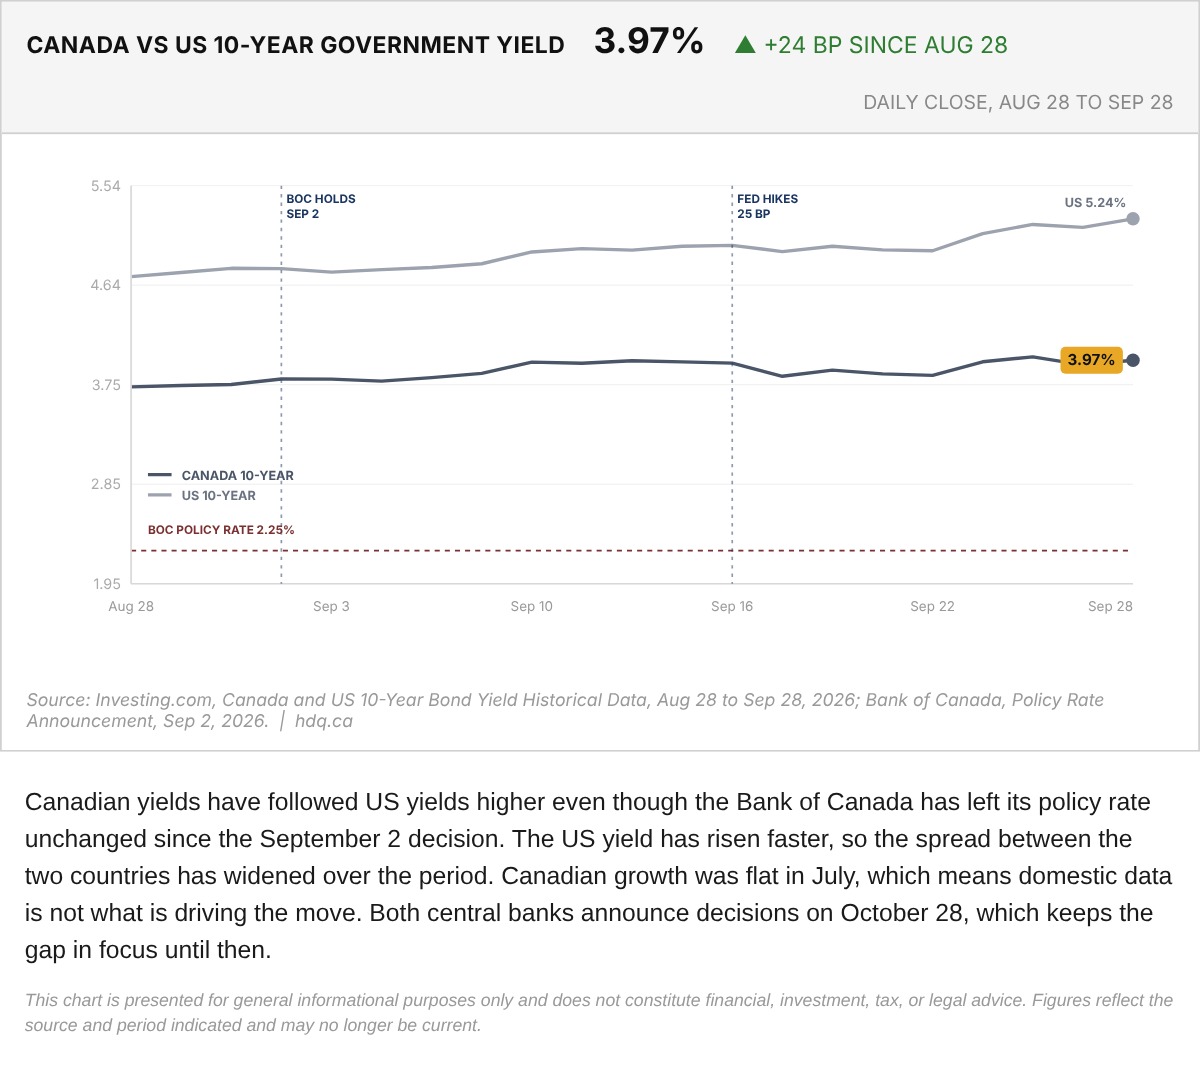
Canadian yields have followed US yields higher even though the Bank of Canada has left its policy rate unchanged since the September 2 decision.
Canada and US 10-Year Government Bond Yields, August 28 to September 28, 2026
September 29, 2026
View chart & download