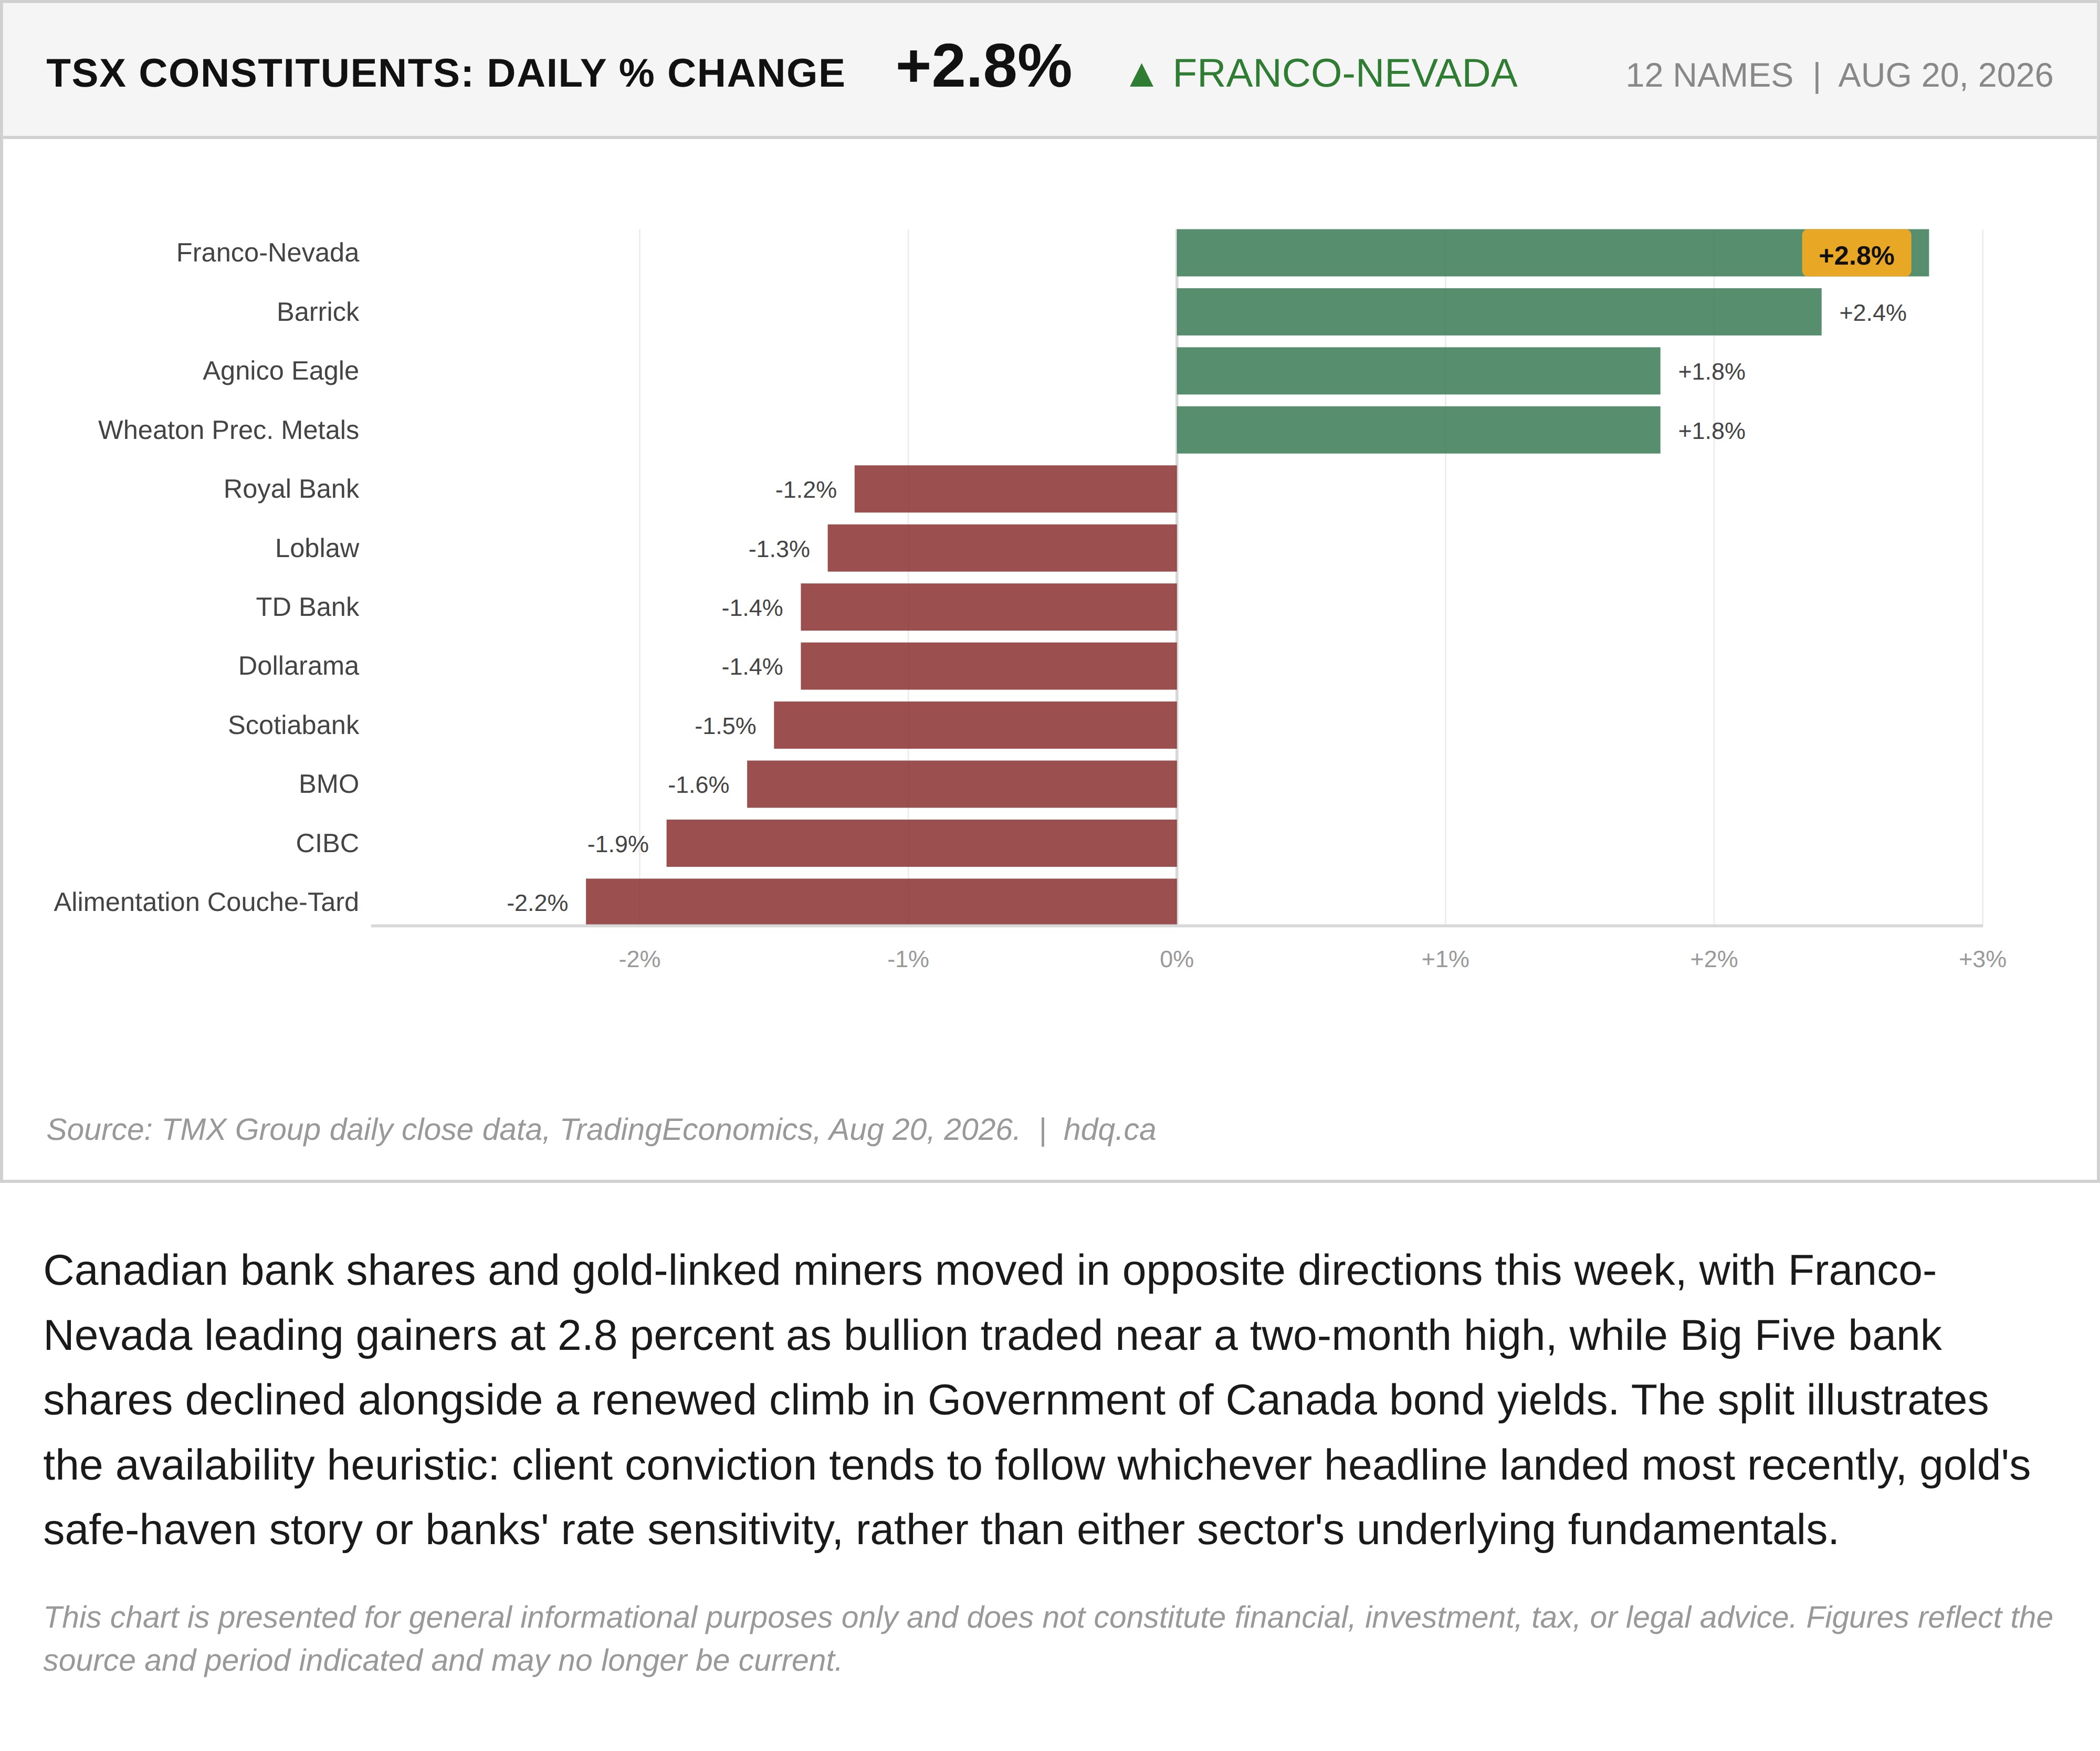
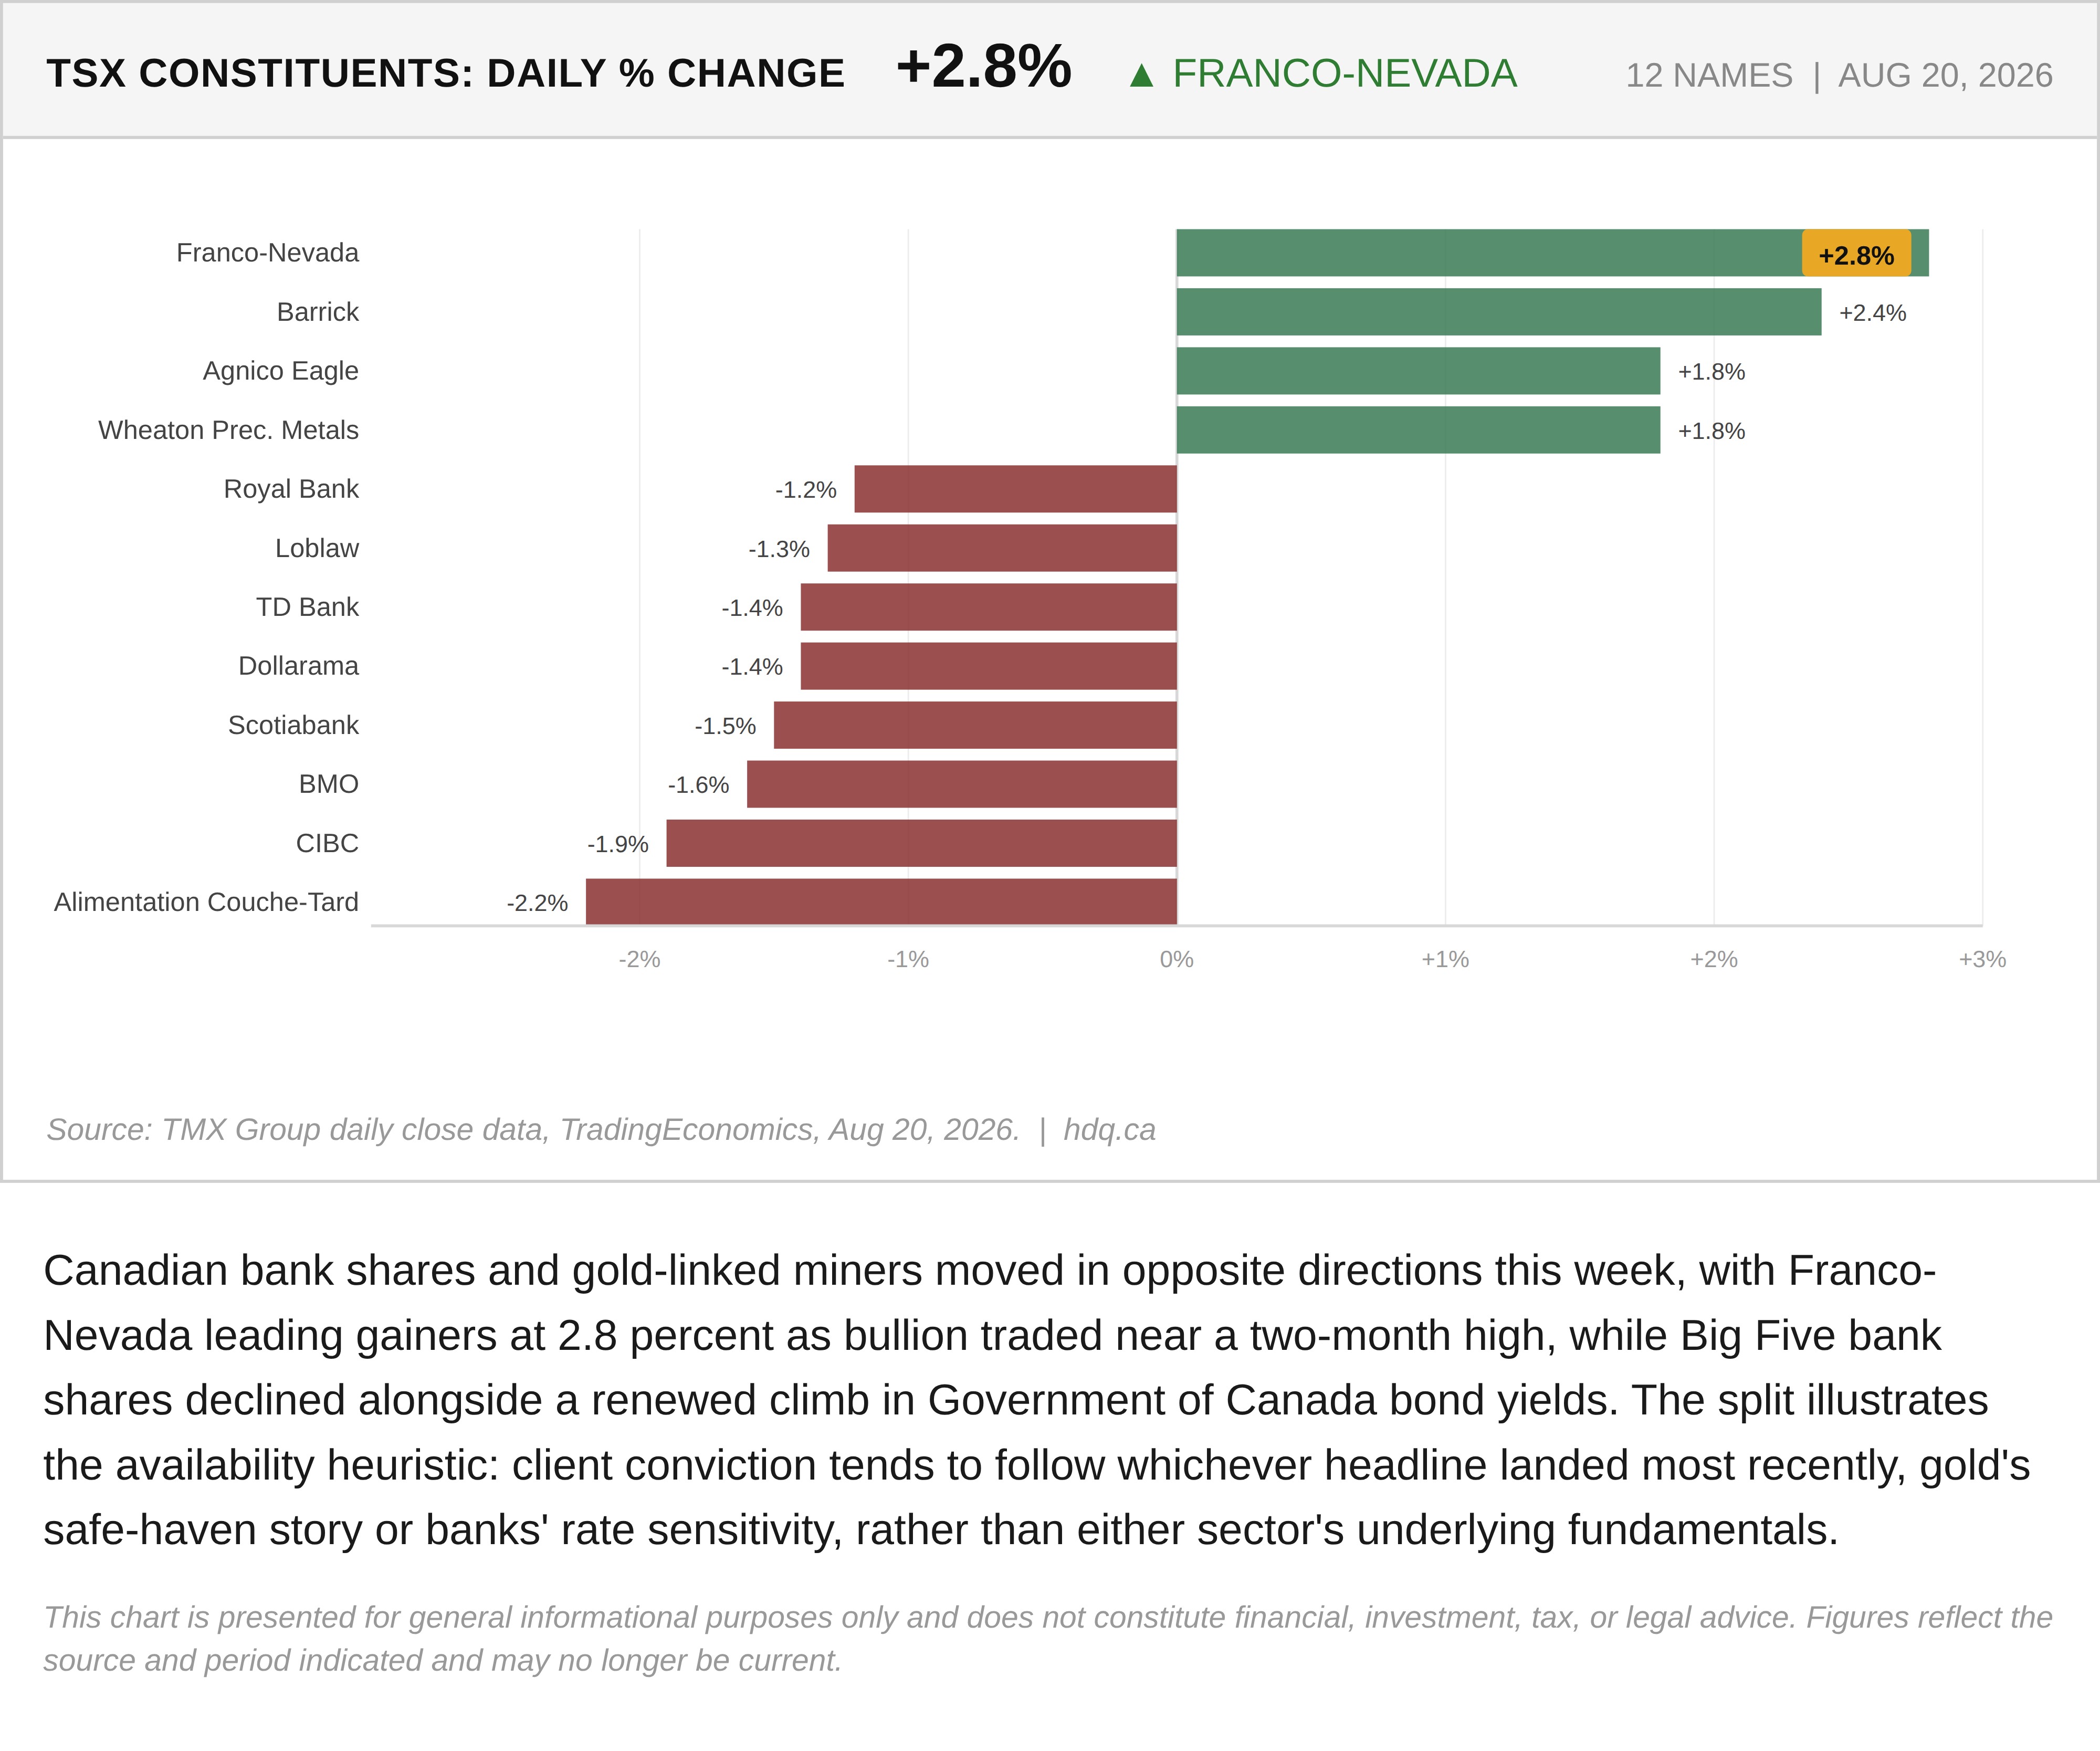
Canadian bank shares and gold-linked miners moved in opposite directions this week, with Franco-Nevada leading gainers at 2.8 percent as bullion traded near a two-month high, while Big Five bank shares declined alongside a renewed climb in Government of Canada bond yields. The split illustrates the availability heuristic: client conviction tends to follow whichever headline landed most recently, gold's safe-haven story or banks' rate sensitivity, rather than either sector's underlying fundamentals.
This chart is presented for general informational purposes only and does not constitute financial, investment, tax, or legal advice. Figures reflect the source and period indicated and may no longer be current.
Related charts
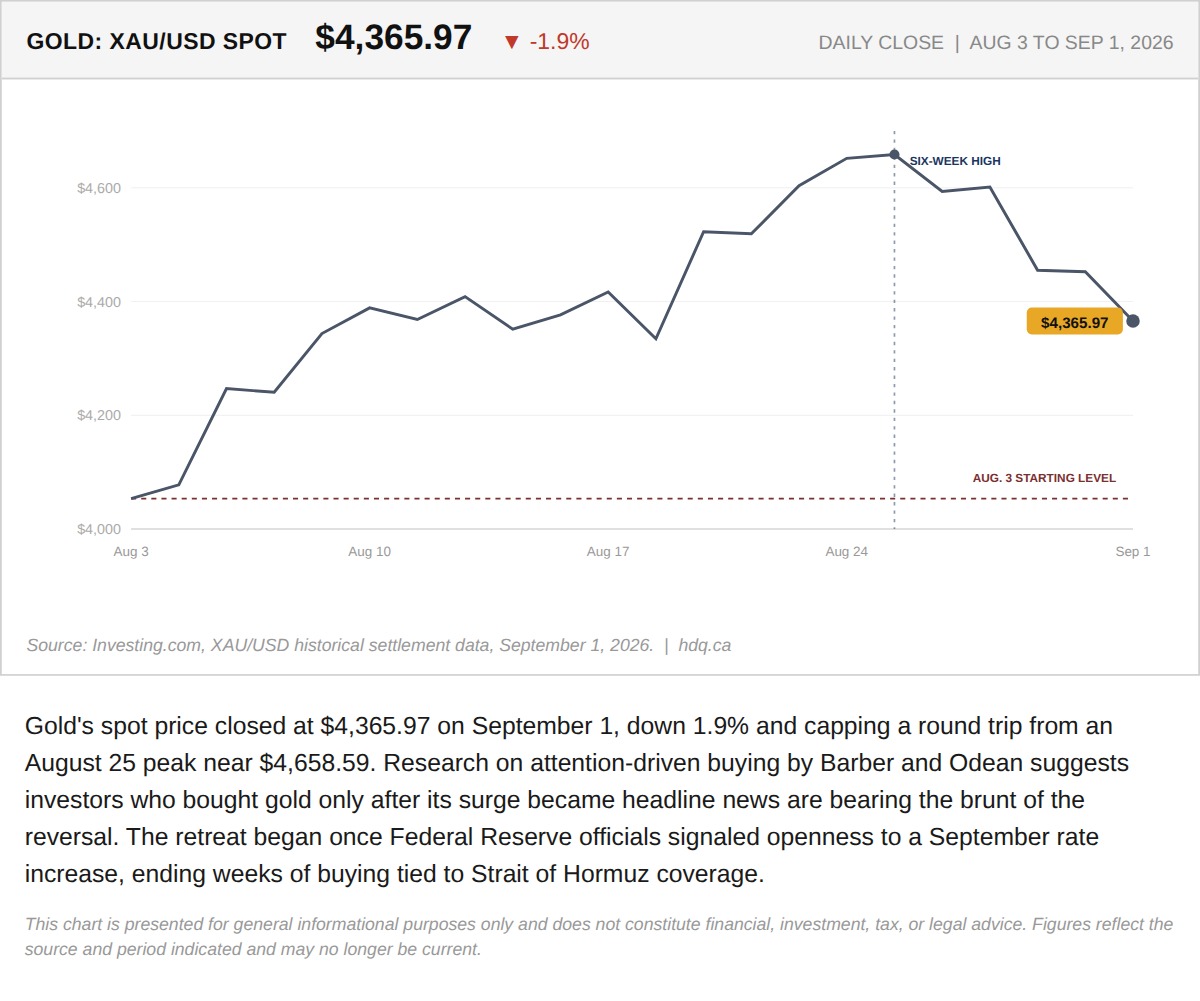
Gold's spot price closed at $4,365.97 on September 1, down 1.9% and capping a round trip from an August 25 peak near $4,658.59.
Gold's Spot Price Pulls Back 1.9% After an Attention-Driven August Surge
September 2, 2026
View chart & download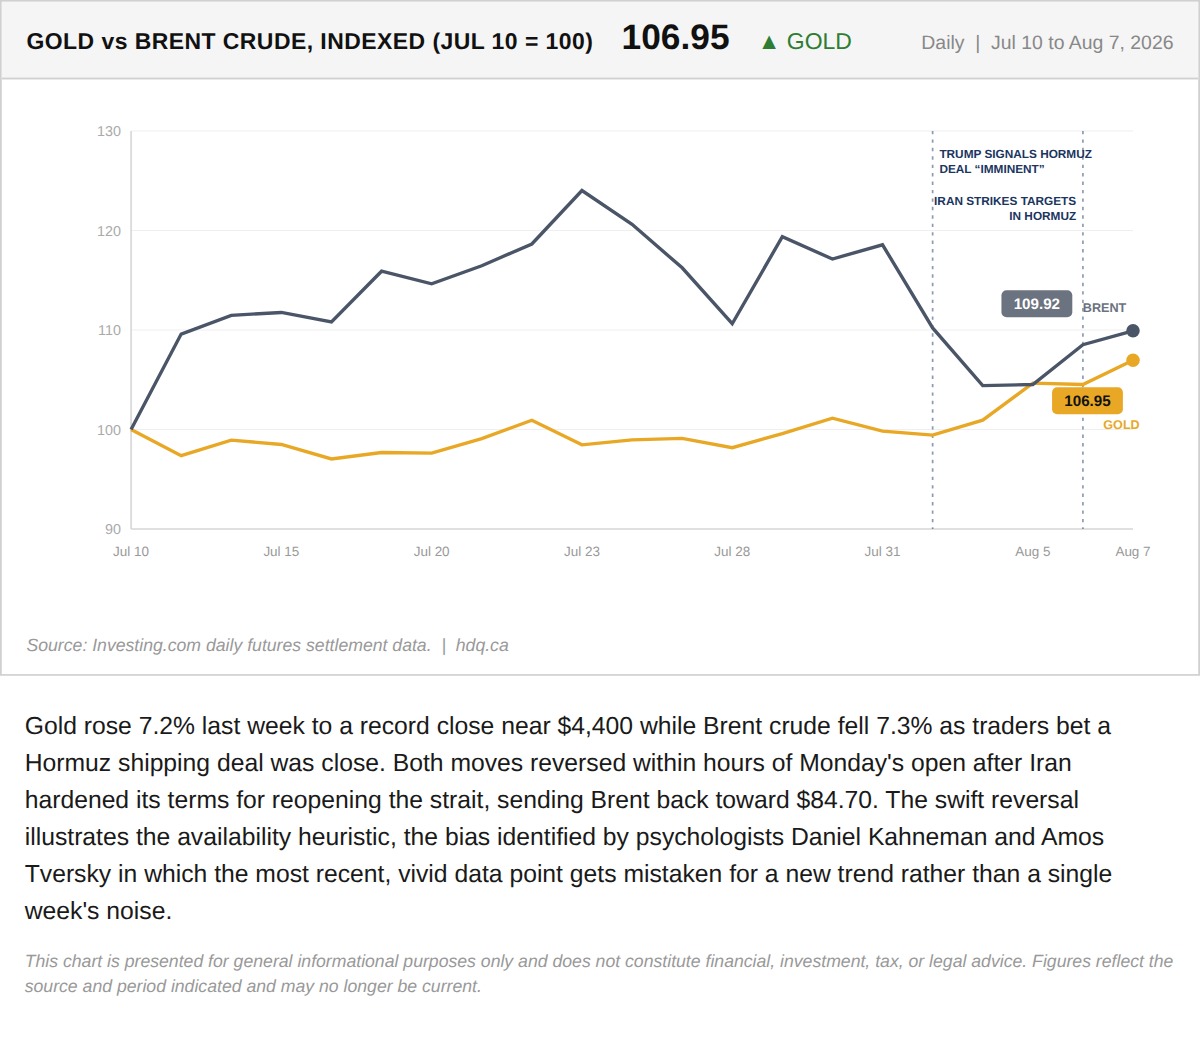
Gold rose 7.2% last week to a record close near $4,400 while Brent crude fell 7.3% as traders bet a Hormuz shipping deal was close.
Gold's Record Week Made the Story Feel Settled. Monday Already Disagrees.
August 10, 2026
View chart & download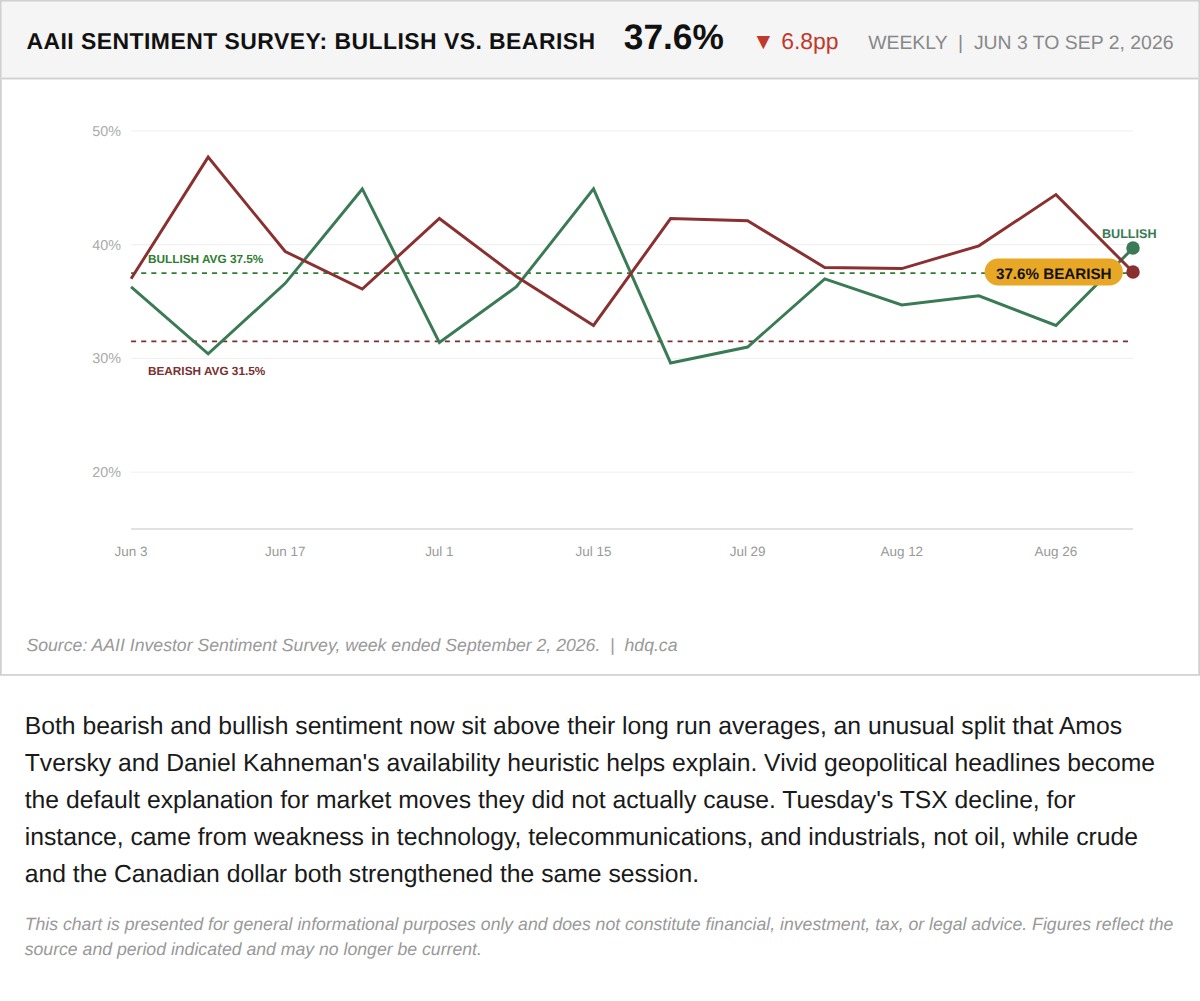
Both bearish and bullish sentiment now sit above their long run averages, an unusual split that Amos Tversky and Daniel Kahneman's availability heuristic helps explain.
Investors Are More Bearish and More Bullish Than Usual, and Tuesday's TSX Move Shows Why
September 9, 2026
View chart & download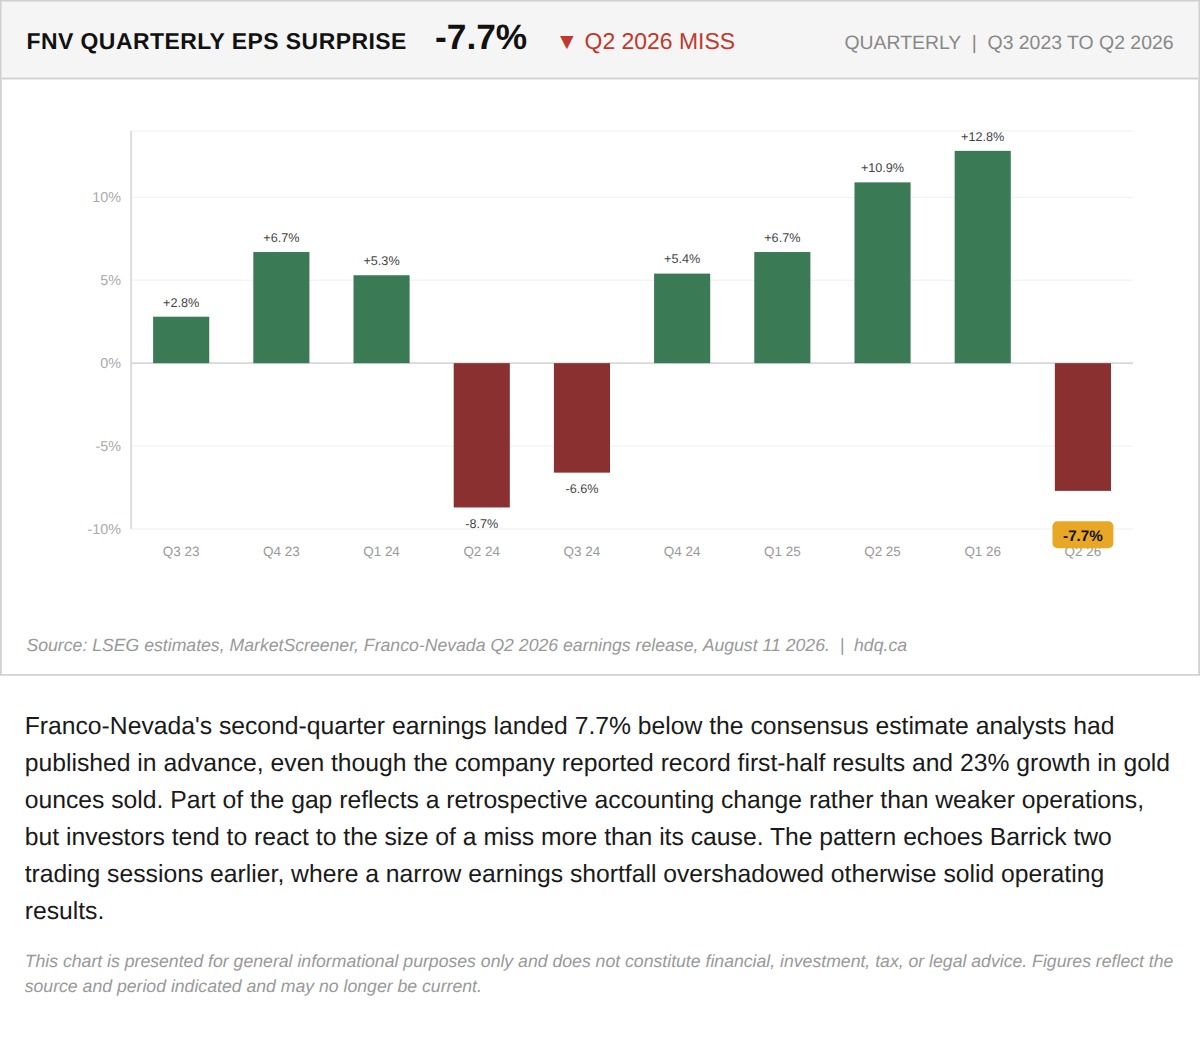
Franco-Nevada's second-quarter earnings landed 7.7% below the consensus estimate analysts had published in advance, even though the company…
Franco-Nevada Beat on Almost Everything. The Market Will Only Remember One Number.
August 12, 2026
View chart & download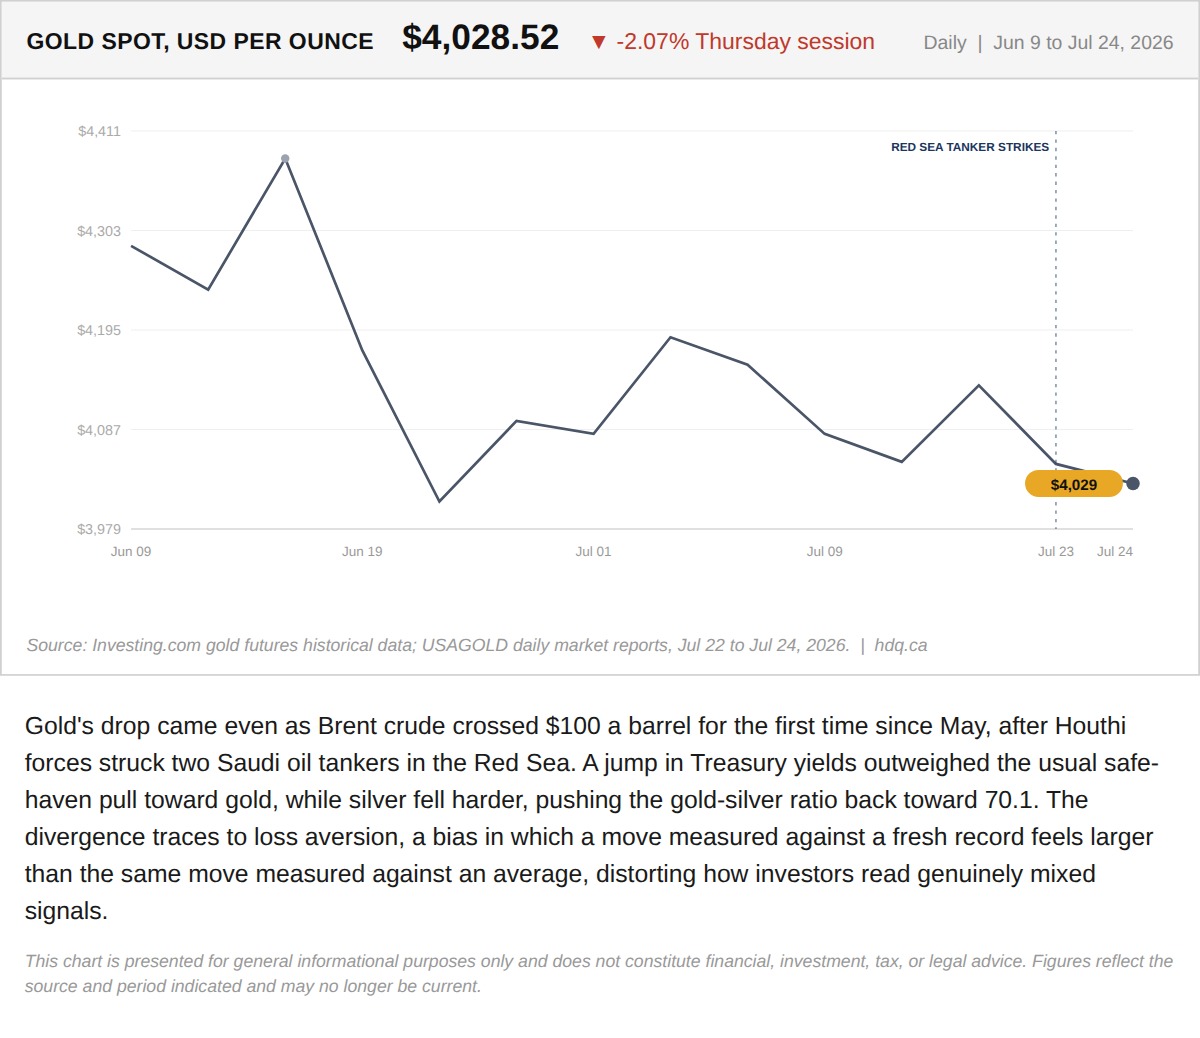
Gold's drop came even as Brent crude crossed $100 a barrel for the first time since May, after Houthi forces struck two Saudi oil tankers in the Red Sea.
Record High, Sharp Reversal: A Lesson in Loss Aversion
July 24, 2026
View chart & download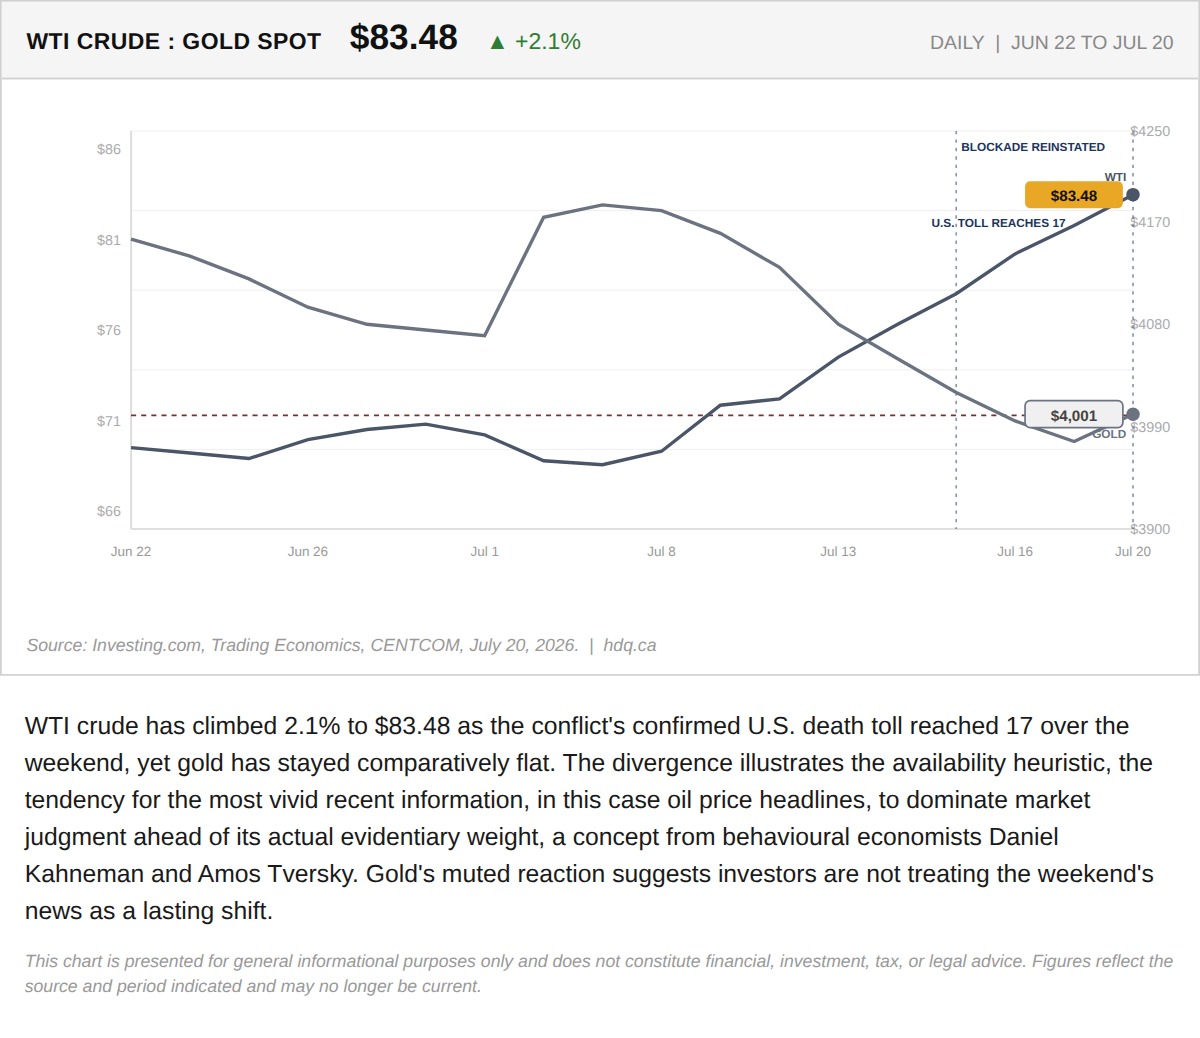
WTI crude has climbed 2.1% to $83.48 as the conflict's confirmed U.S.
Oil Spiked Past $85 as the War's U.S. Death Toll Hit 17. It Gave Back Most of the Move by Noon.
July 20, 2026
View chart & download