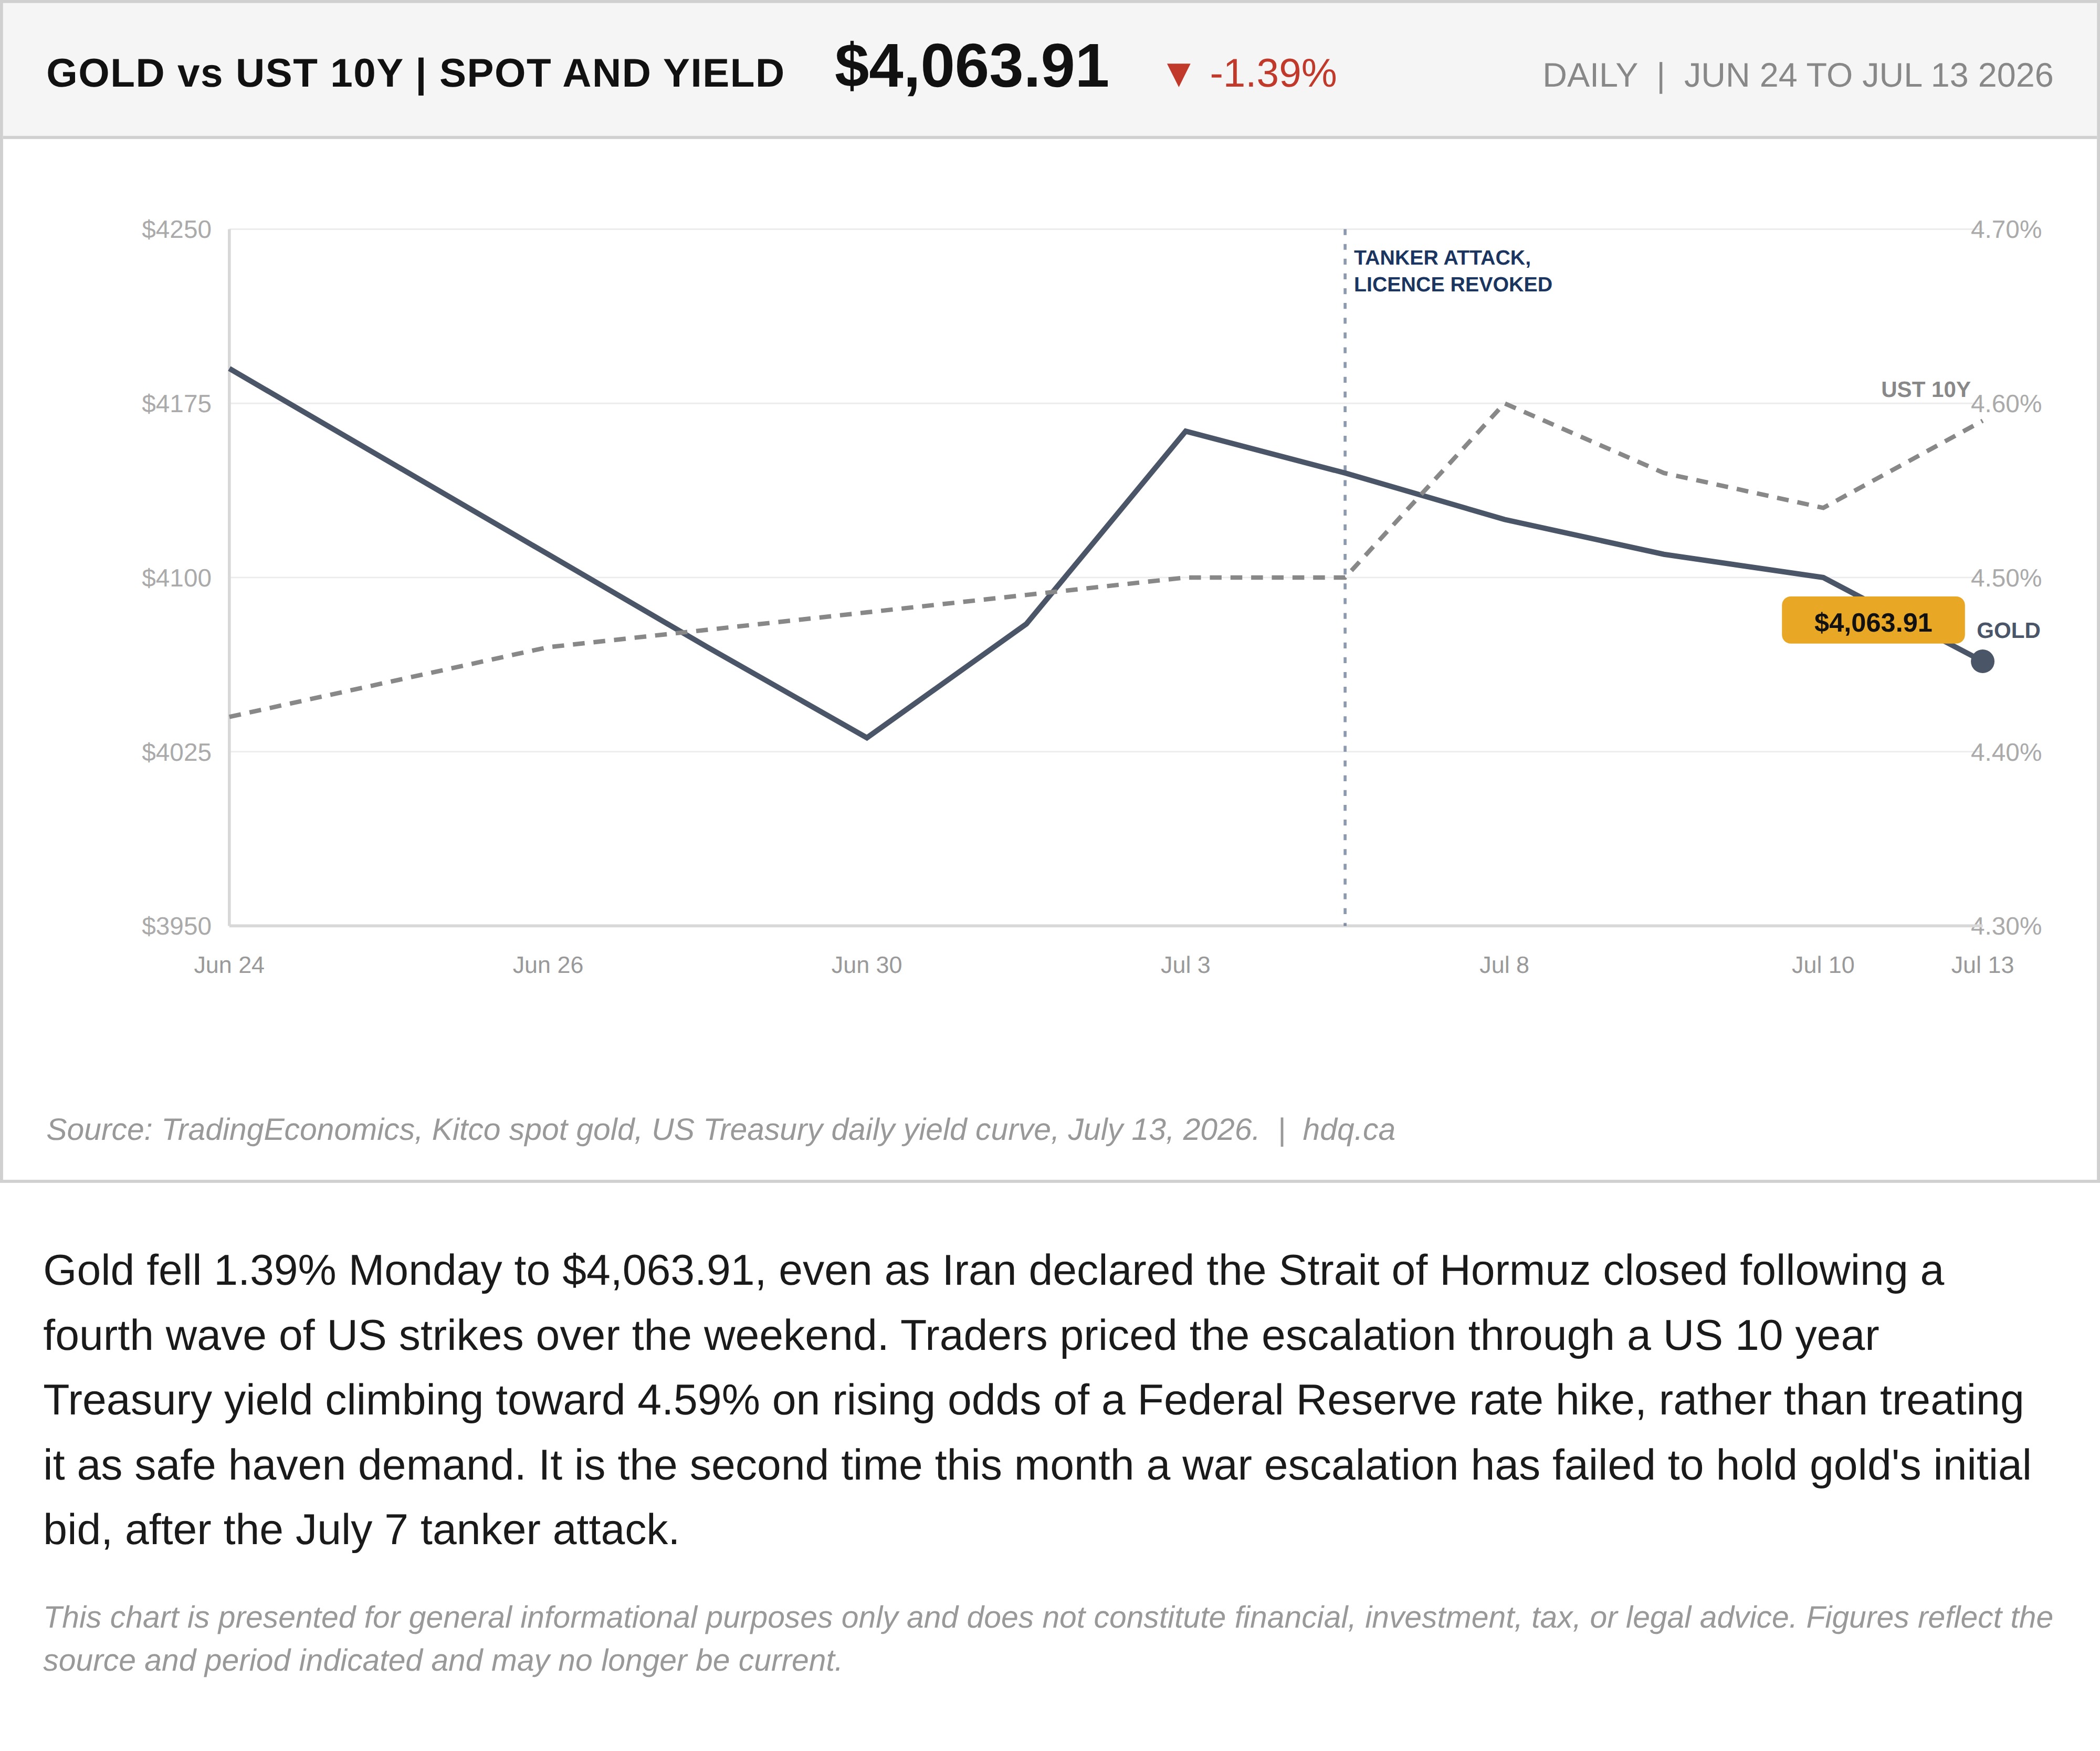
Gold fell 1.39% Monday to $4,063.91, even as Iran declared the Strait of Hormuz closed following a fourth wave of US strikes over the weekend. Traders priced the escalation through a US 10 year Treasury yield climbing toward 4.59% on rising odds of a Federal Reserve rate hike, rather than treating it as safe haven demand. It is the second time this month a war escalation has failed to hold gold's initial bid, after the July 7 tanker attack.
This chart is presented for general informational purposes only and does not constitute financial, investment, tax, or legal advice. Figures reflect the source and period indicated and may no longer be current.

Related charts
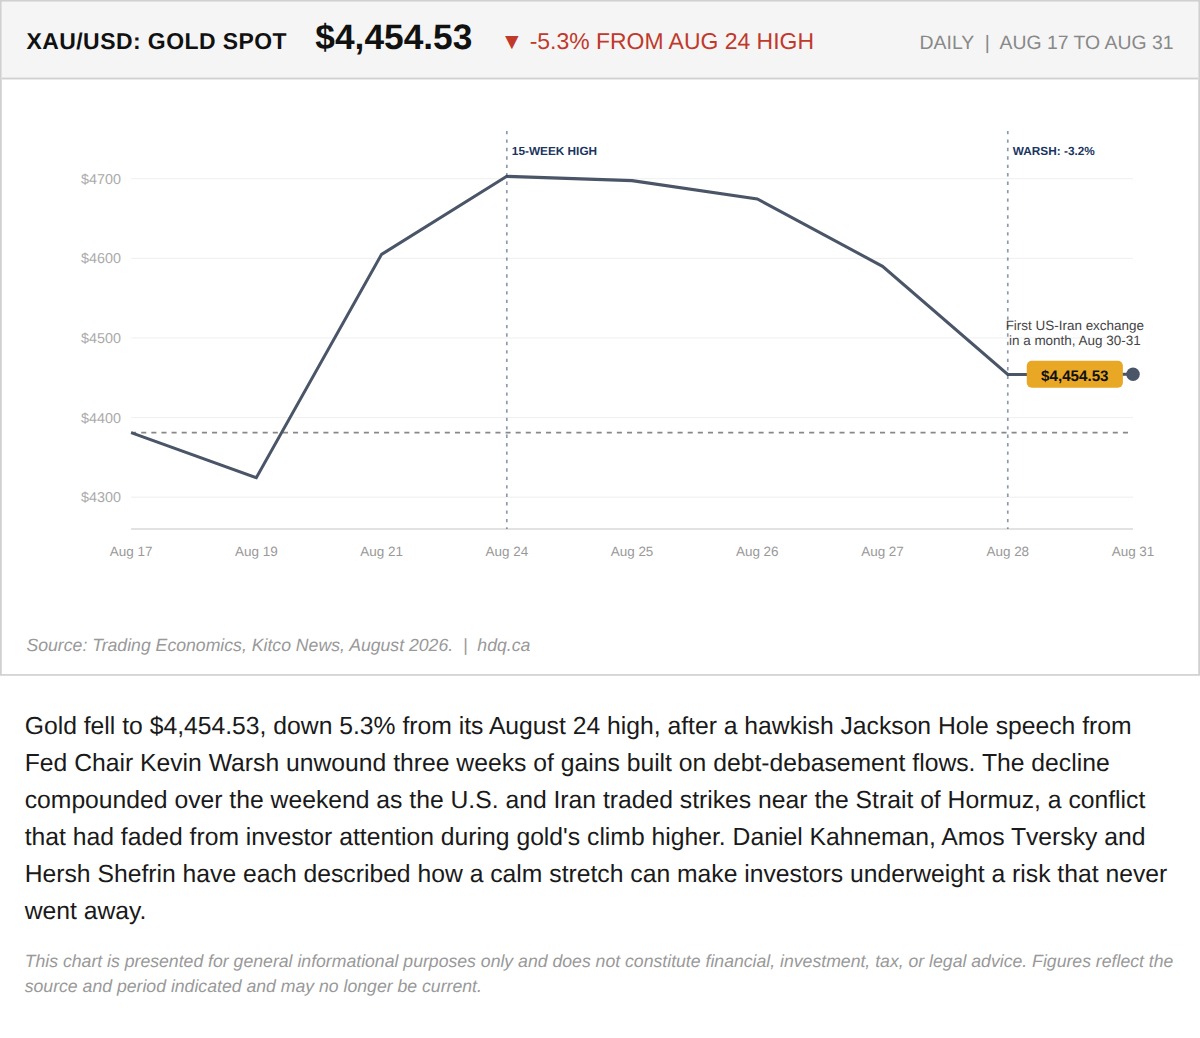
Gold fell to $4,454.53, down 5.3% from its August 24 high, after a hawkish Jackson Hole speech from Fed Chair Kevin Warsh unwound three weeks of gains built on debt-debasement flows.
Gold's Quiet Climb to a 15-Week High Hid the Risk That Just Came Back
August 31, 2026
View chart & download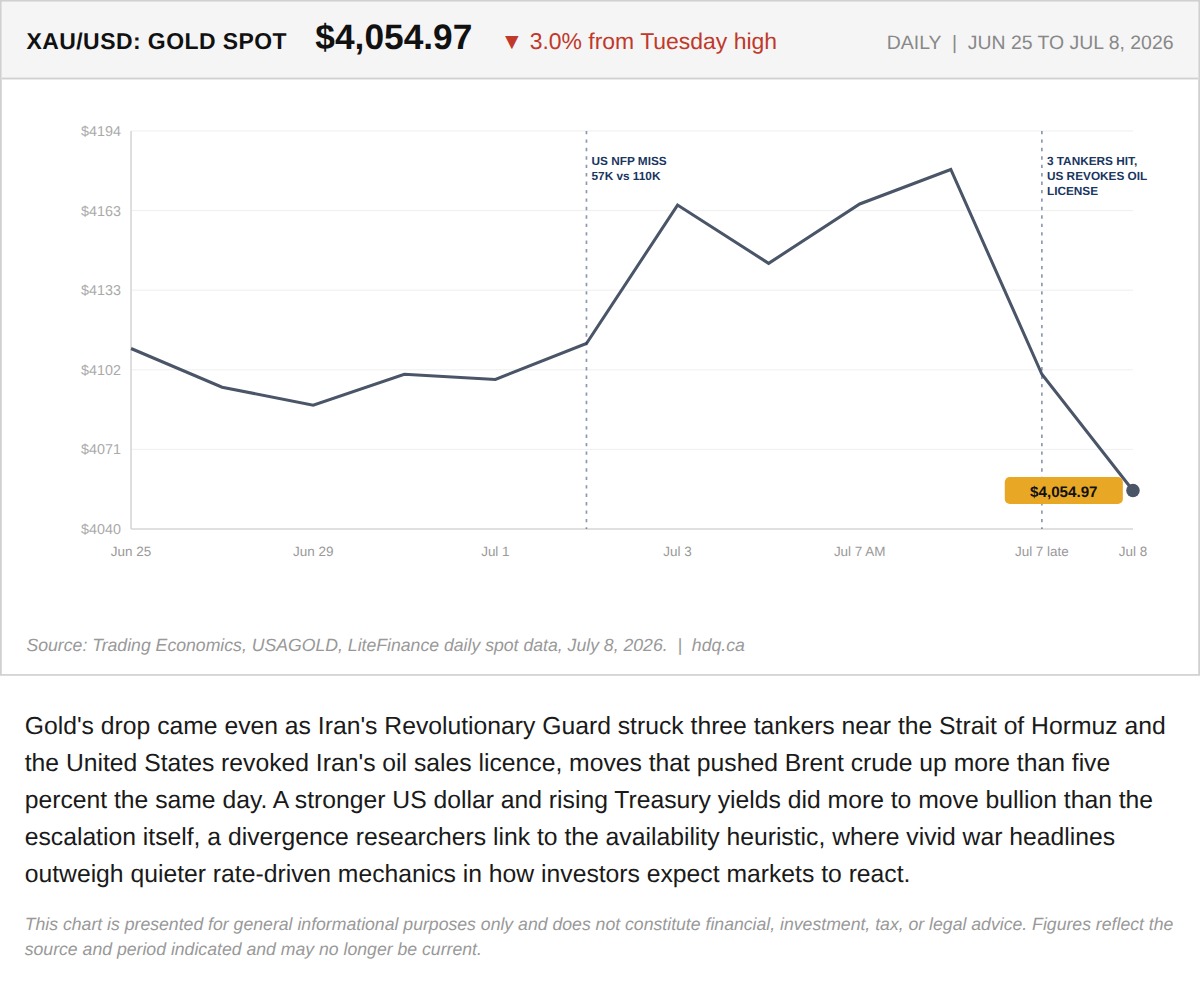
Gold's drop came even as Iran's Revolutionary Guard struck three tankers near the Strait of Hormuz and the United States revoked Iran's oil…
Gold Fell 3% While Iran Attacked Tankers in the Strait of Hormuz
July 8, 2026
View chart & download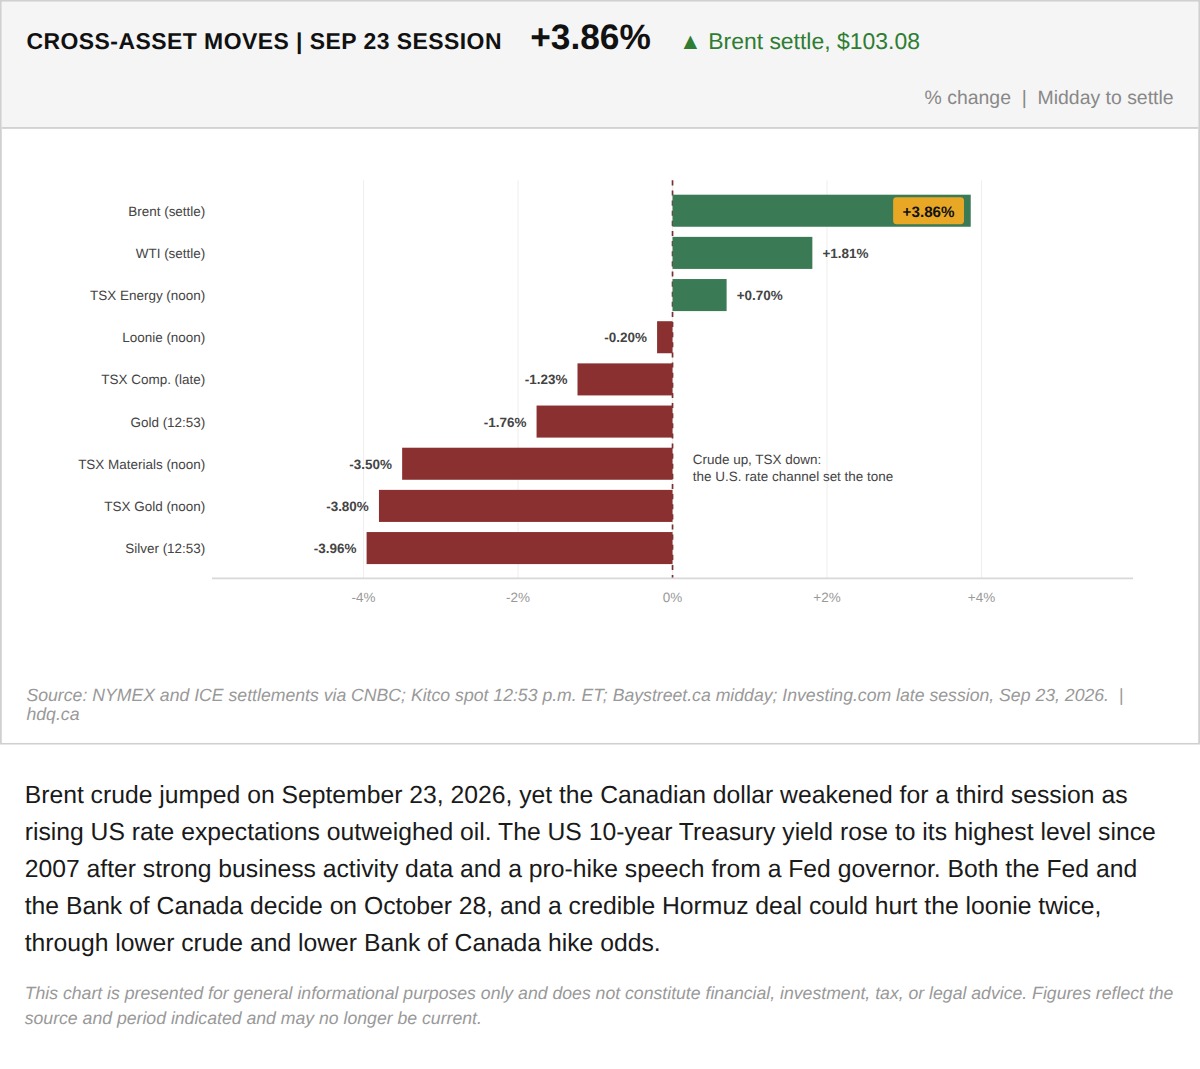
Brent crude jumped on September 23, 2026, yet the Canadian dollar weakened for a third session as rising US rate expectations outweighed oil.
Brent Jumps While the Canadian Dollar and TSX Fall in the September 23 Session
September 23, 2026
View chart & download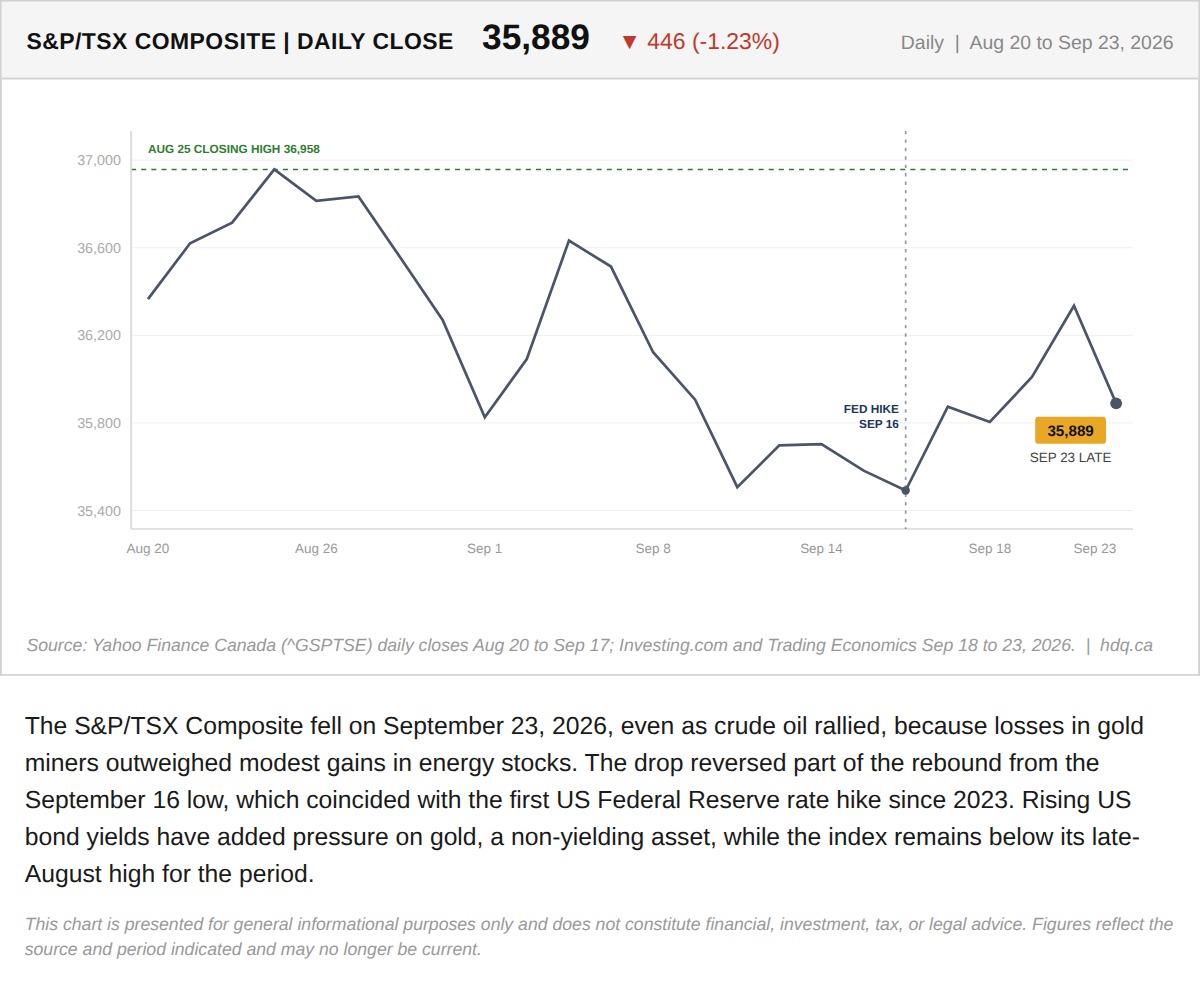
The S&P/TSX Composite fell on September 23, 2026, even as crude oil rallied, because losses in gold miners outweighed modest gains in energy stocks.
TSX Composite Falls Despite an Oil Rally as Gold Stocks Slide
September 23, 2026
View chart & download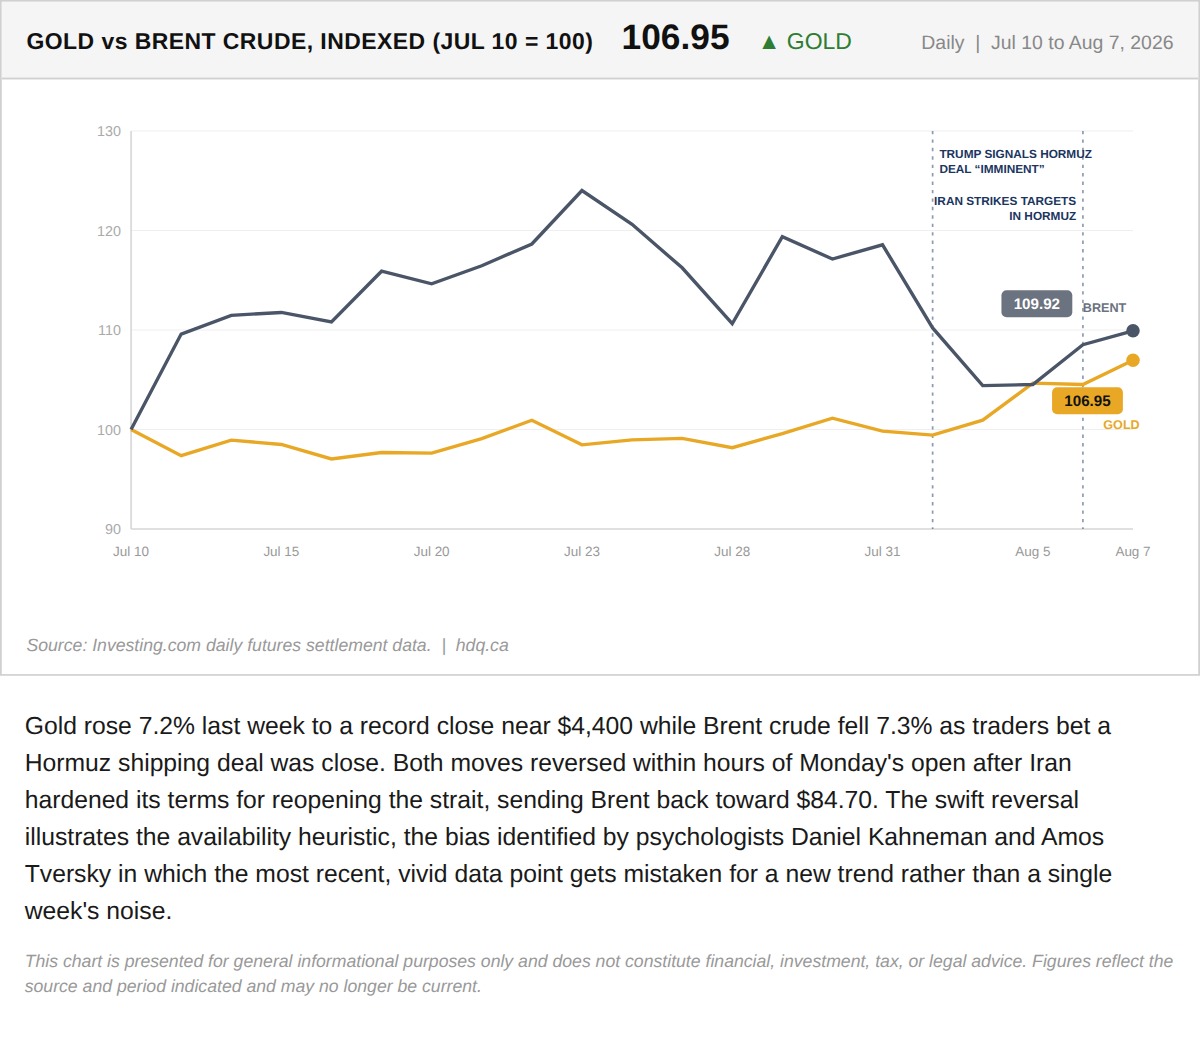
Gold rose 7.2% last week to a record close near $4,400 while Brent crude fell 7.3% as traders bet a Hormuz shipping deal was close.
Gold's Record Week Made the Story Feel Settled. Monday Already Disagrees.
August 10, 2026
View chart & download
Brent was the only one of the three to finish above its starting level, while the index and gold both fell.
Brent, TSX and Gold Rebased to the August 31 Close
September 30, 2026
View chart & download