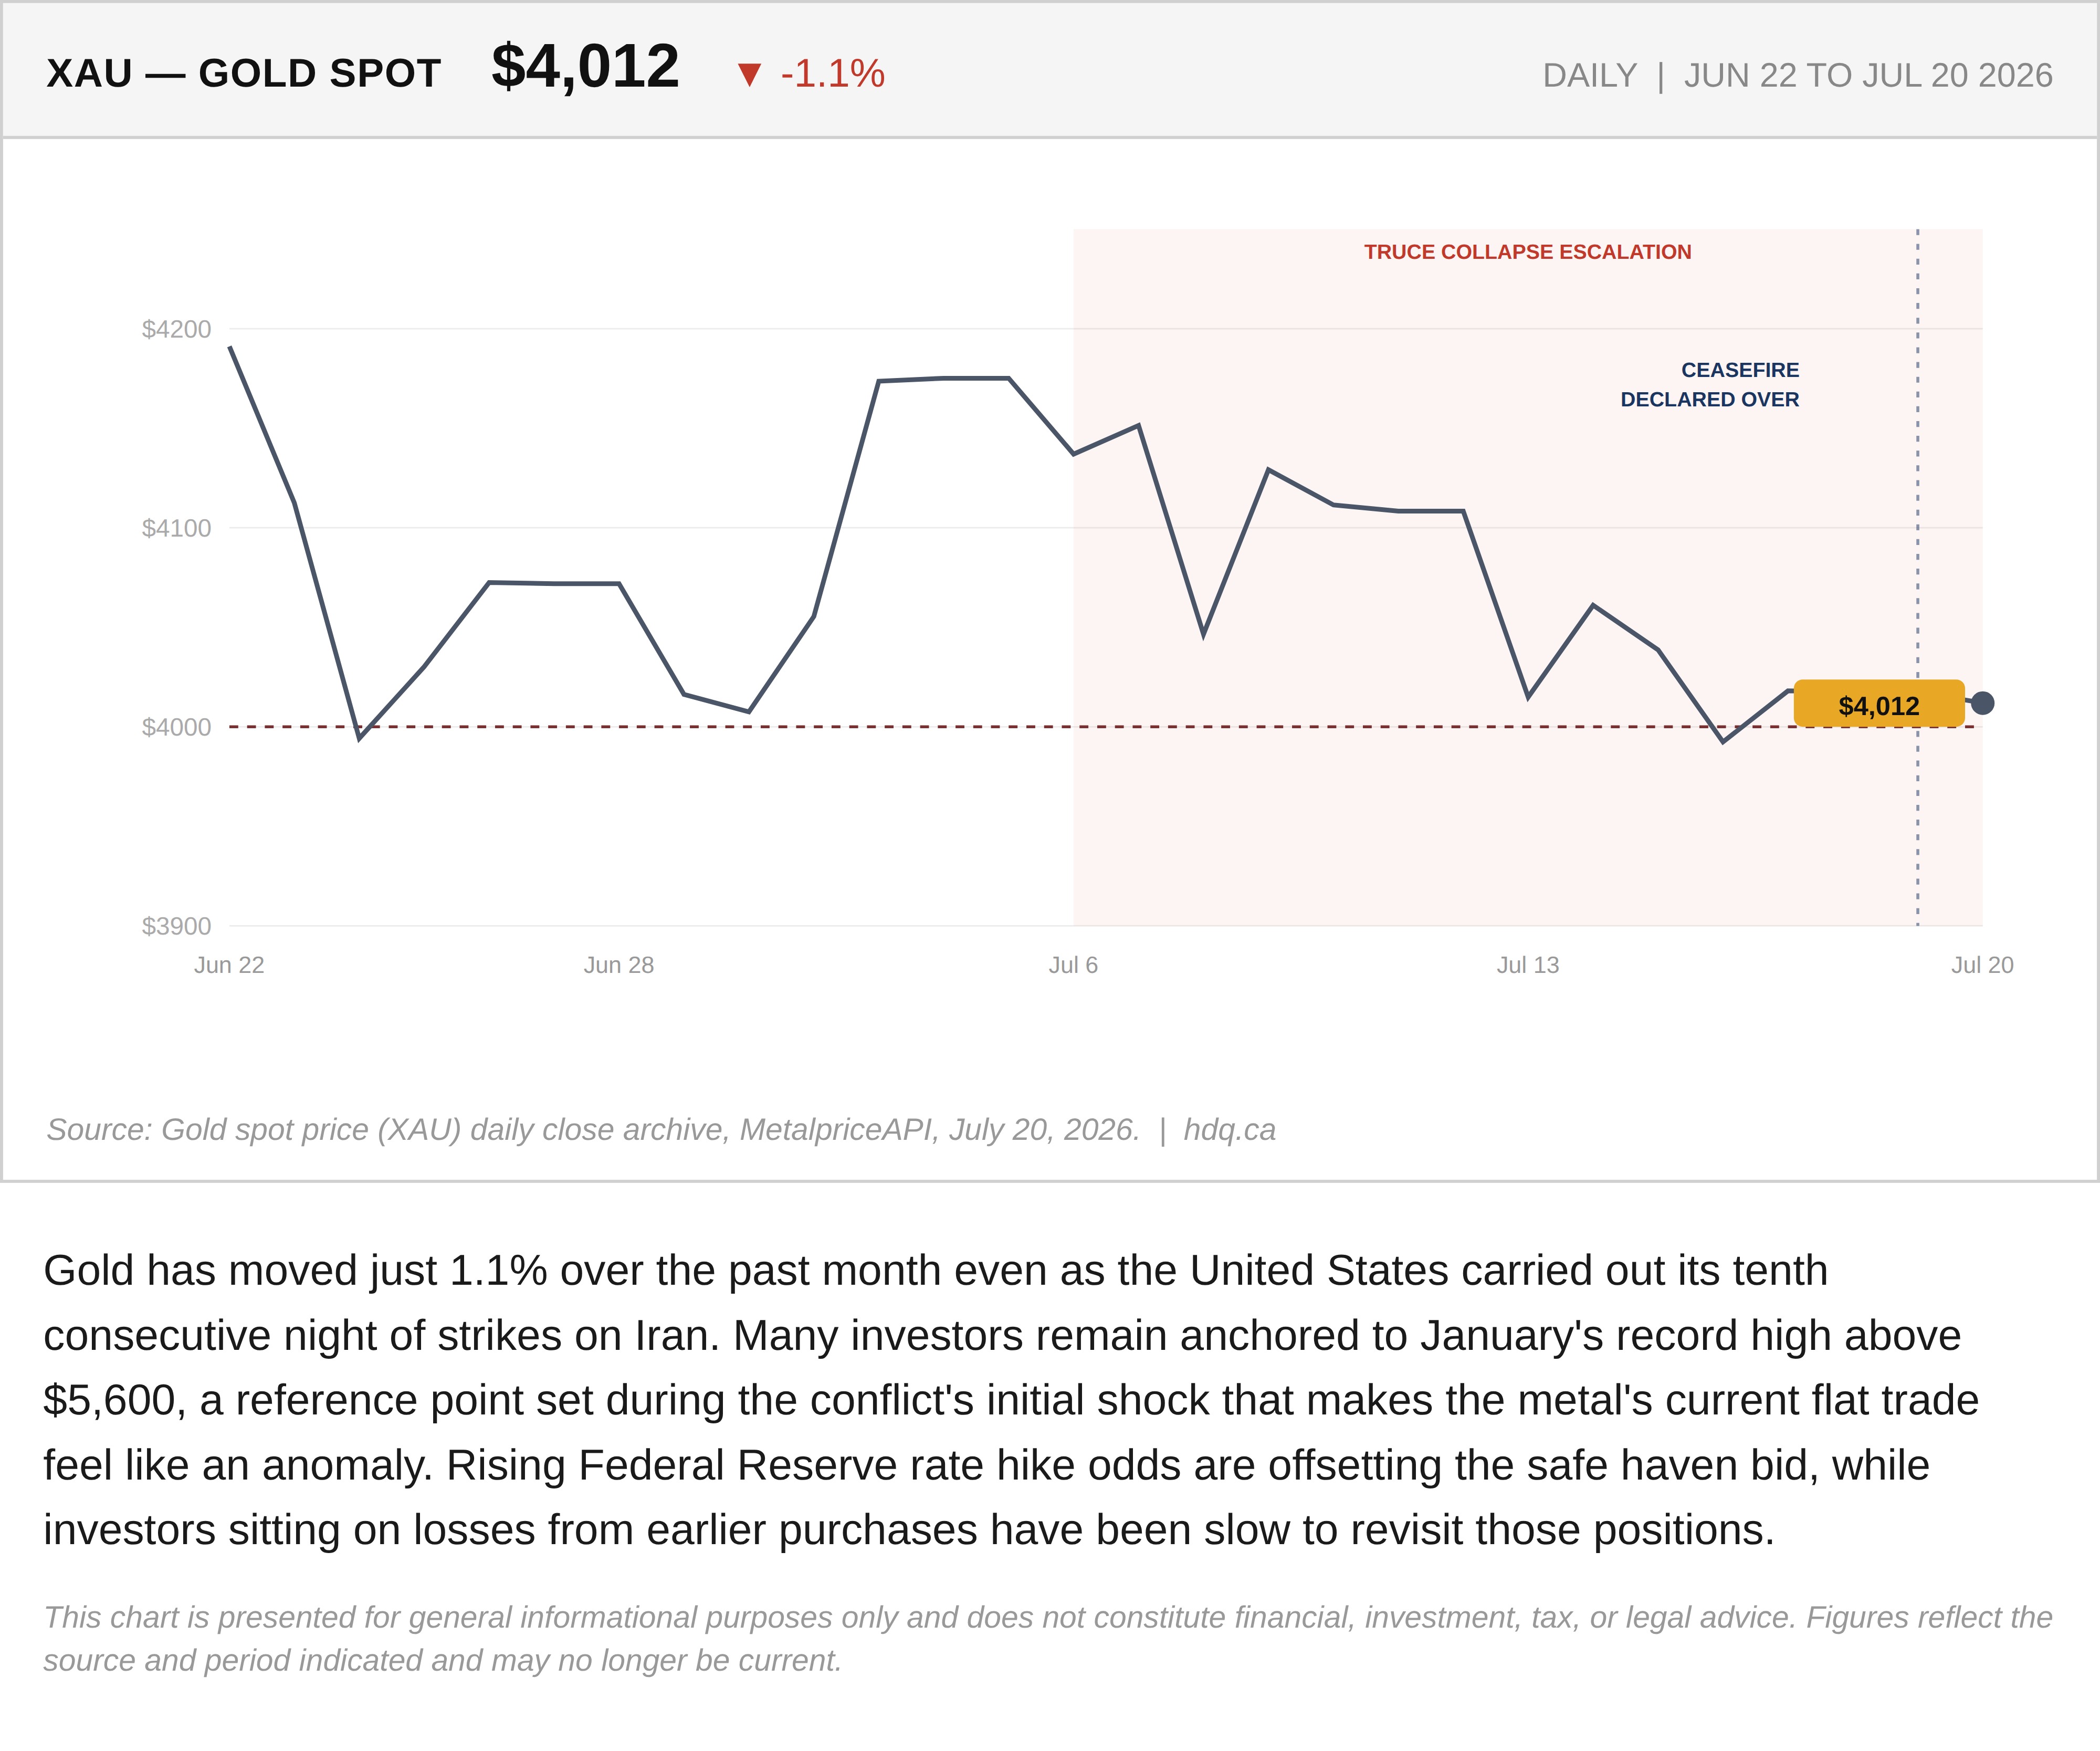
Gold has moved just 1.1% over the past month even as the United States carried out its tenth consecutive night of strikes on Iran. Many investors remain anchored to January's record high above $5,600, a reference point set during the conflict's initial shock that makes the metal's current flat trade feel like an anomaly. Rising Federal Reserve rate hike odds are offsetting the safe haven bid, while investors sitting on losses from earlier purchases have been slow to revisit those positions.
This chart is presented for general informational purposes only and does not constitute financial, investment, tax, or legal advice. Figures reflect the source and period indicated and may no longer be current.

Related charts
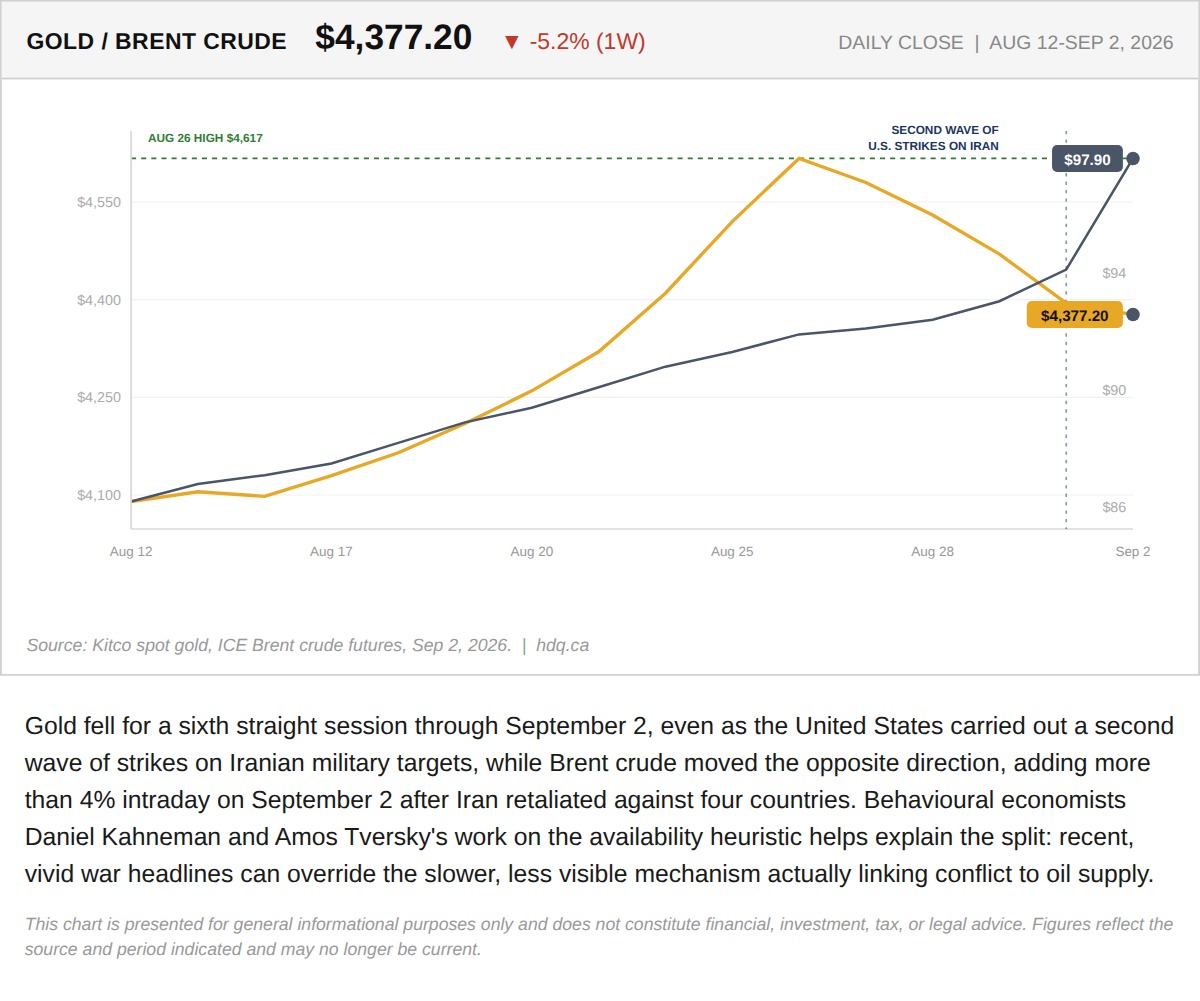
Gold fell for a sixth straight session through September 2, even as the United States carried out a second wave of strikes on Iranian…
Gold's War Premium Is Cracking as the Conflict Widens
September 3, 2026
View chart & download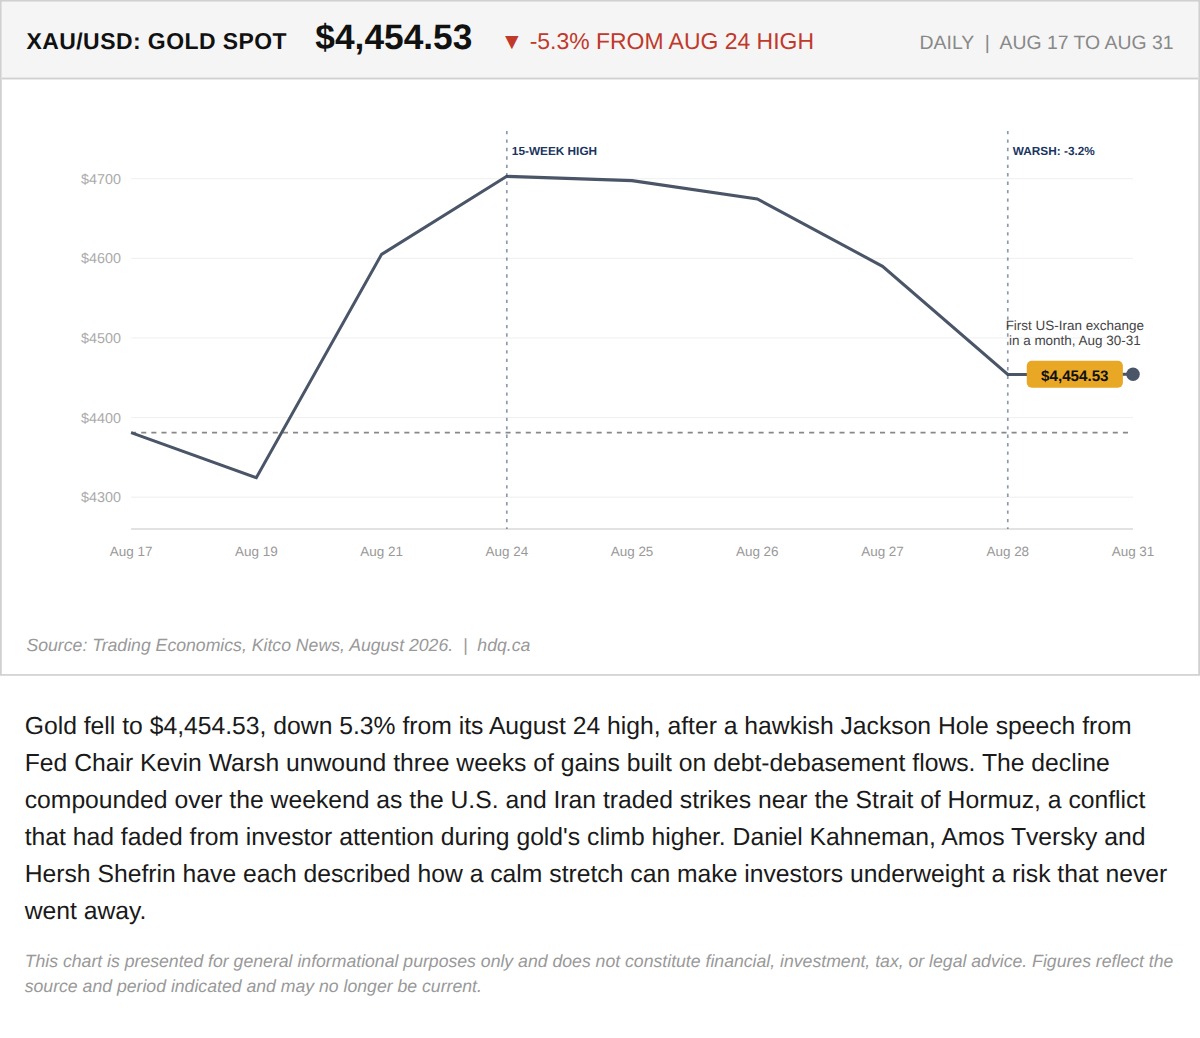
Gold fell to $4,454.53, down 5.3% from its August 24 high, after a hawkish Jackson Hole speech from Fed Chair Kevin Warsh unwound three weeks of gains built on debt-debasement flows.
Gold's Quiet Climb to a 15-Week High Hid the Risk That Just Came Back
August 31, 2026
View chart & download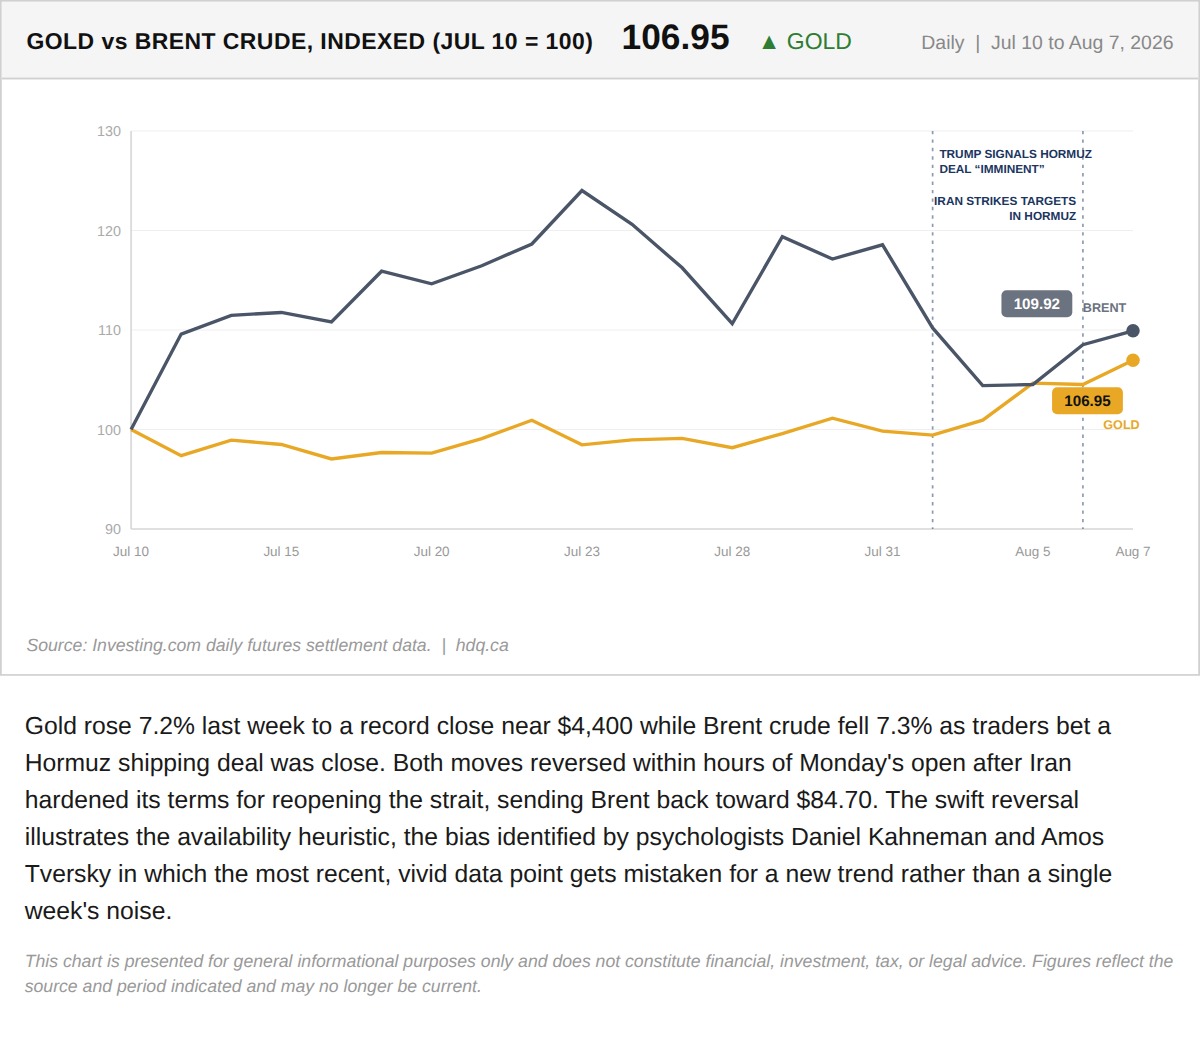
Gold rose 7.2% last week to a record close near $4,400 while Brent crude fell 7.3% as traders bet a Hormuz shipping deal was close.
Gold's Record Week Made the Story Feel Settled. Monday Already Disagrees.
August 10, 2026
View chart & download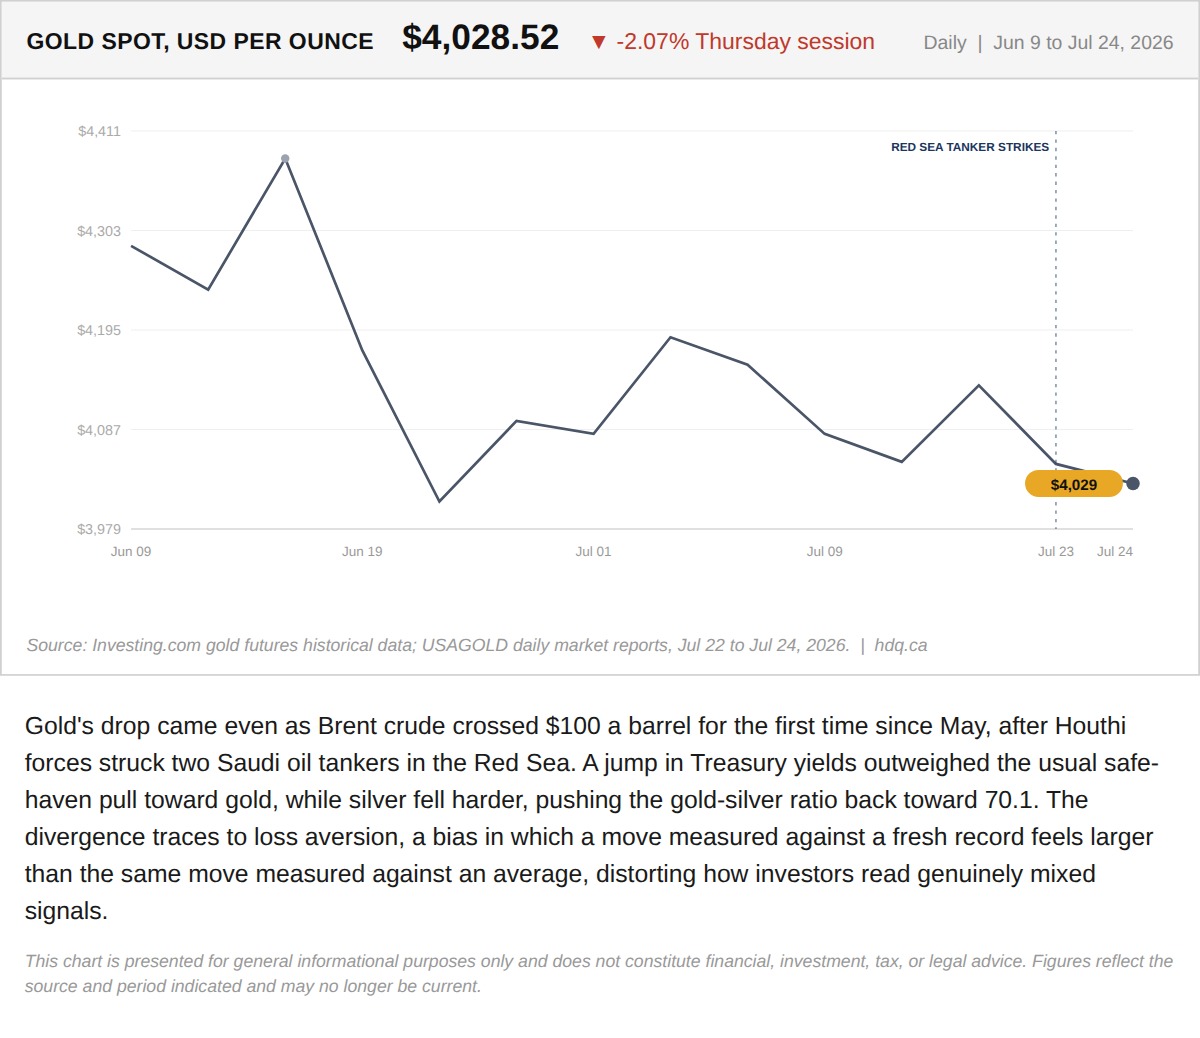
Gold's drop came even as Brent crude crossed $100 a barrel for the first time since May, after Houthi forces struck two Saudi oil tankers in the Red Sea.
Record High, Sharp Reversal: A Lesson in Loss Aversion
July 24, 2026
View chart & download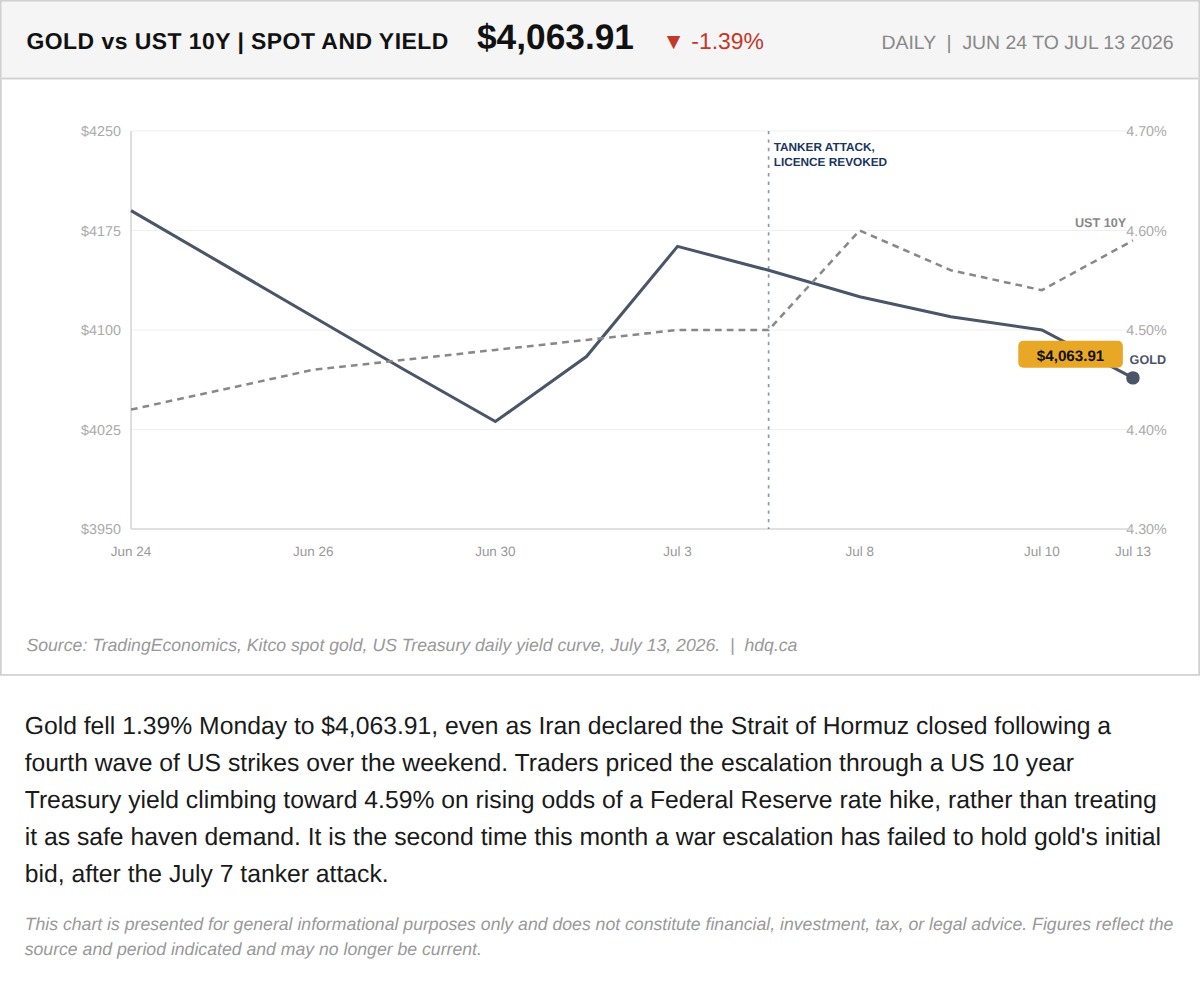
Gold fell 1.39% Monday to $4,063.91, even as Iran declared the Strait of Hormuz closed following a fourth wave of US strikes over the weekend.
Gold Fell on the Worst Hormuz Escalation in Months. That Is Not a Contradiction.
July 13, 2026
View chart & download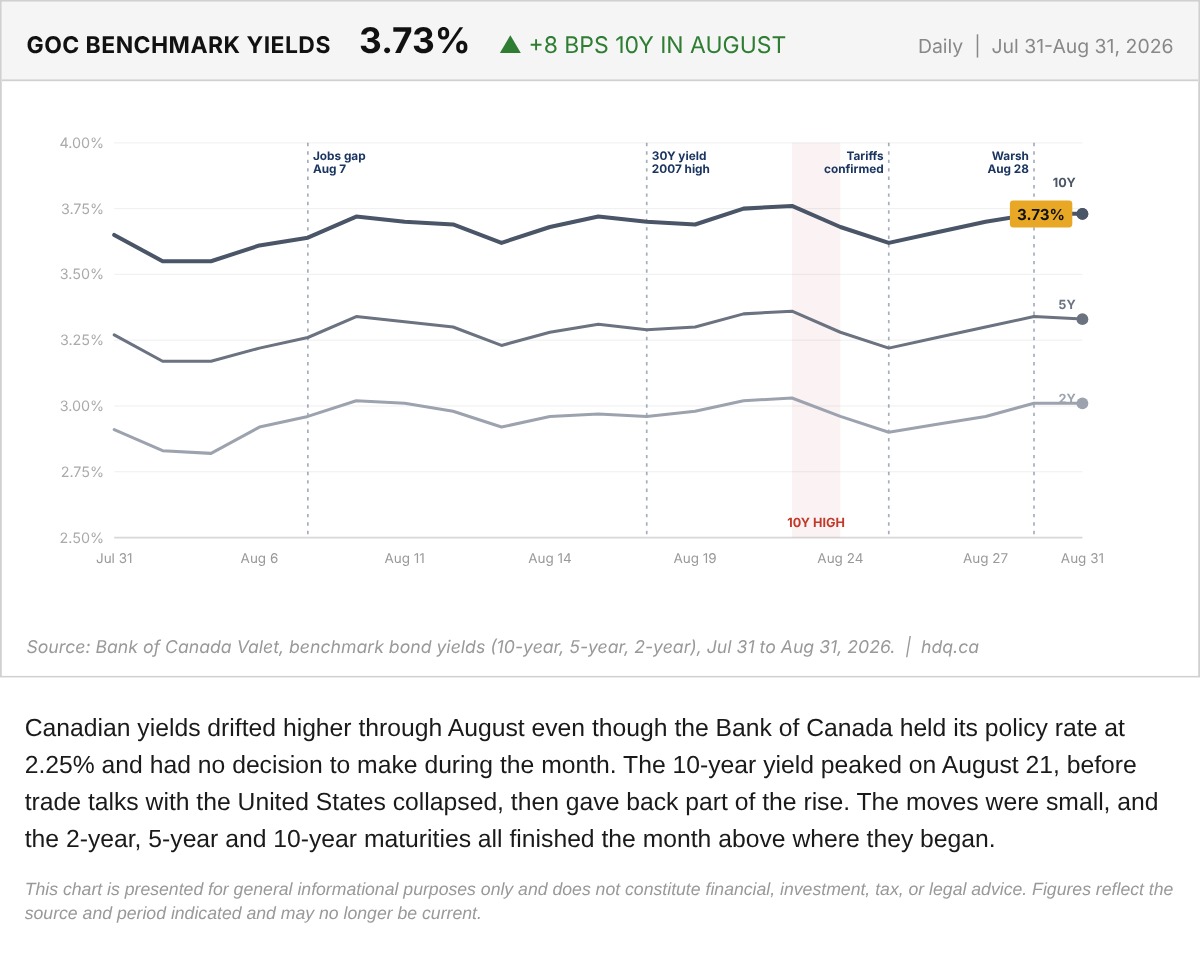
Canadian yields drifted higher through August even though the Bank of Canada held its policy rate at 2.25% and had no decision to make during the month.
Government of Canada Benchmark Yields, August 2026
August 31, 2026
View chart & download