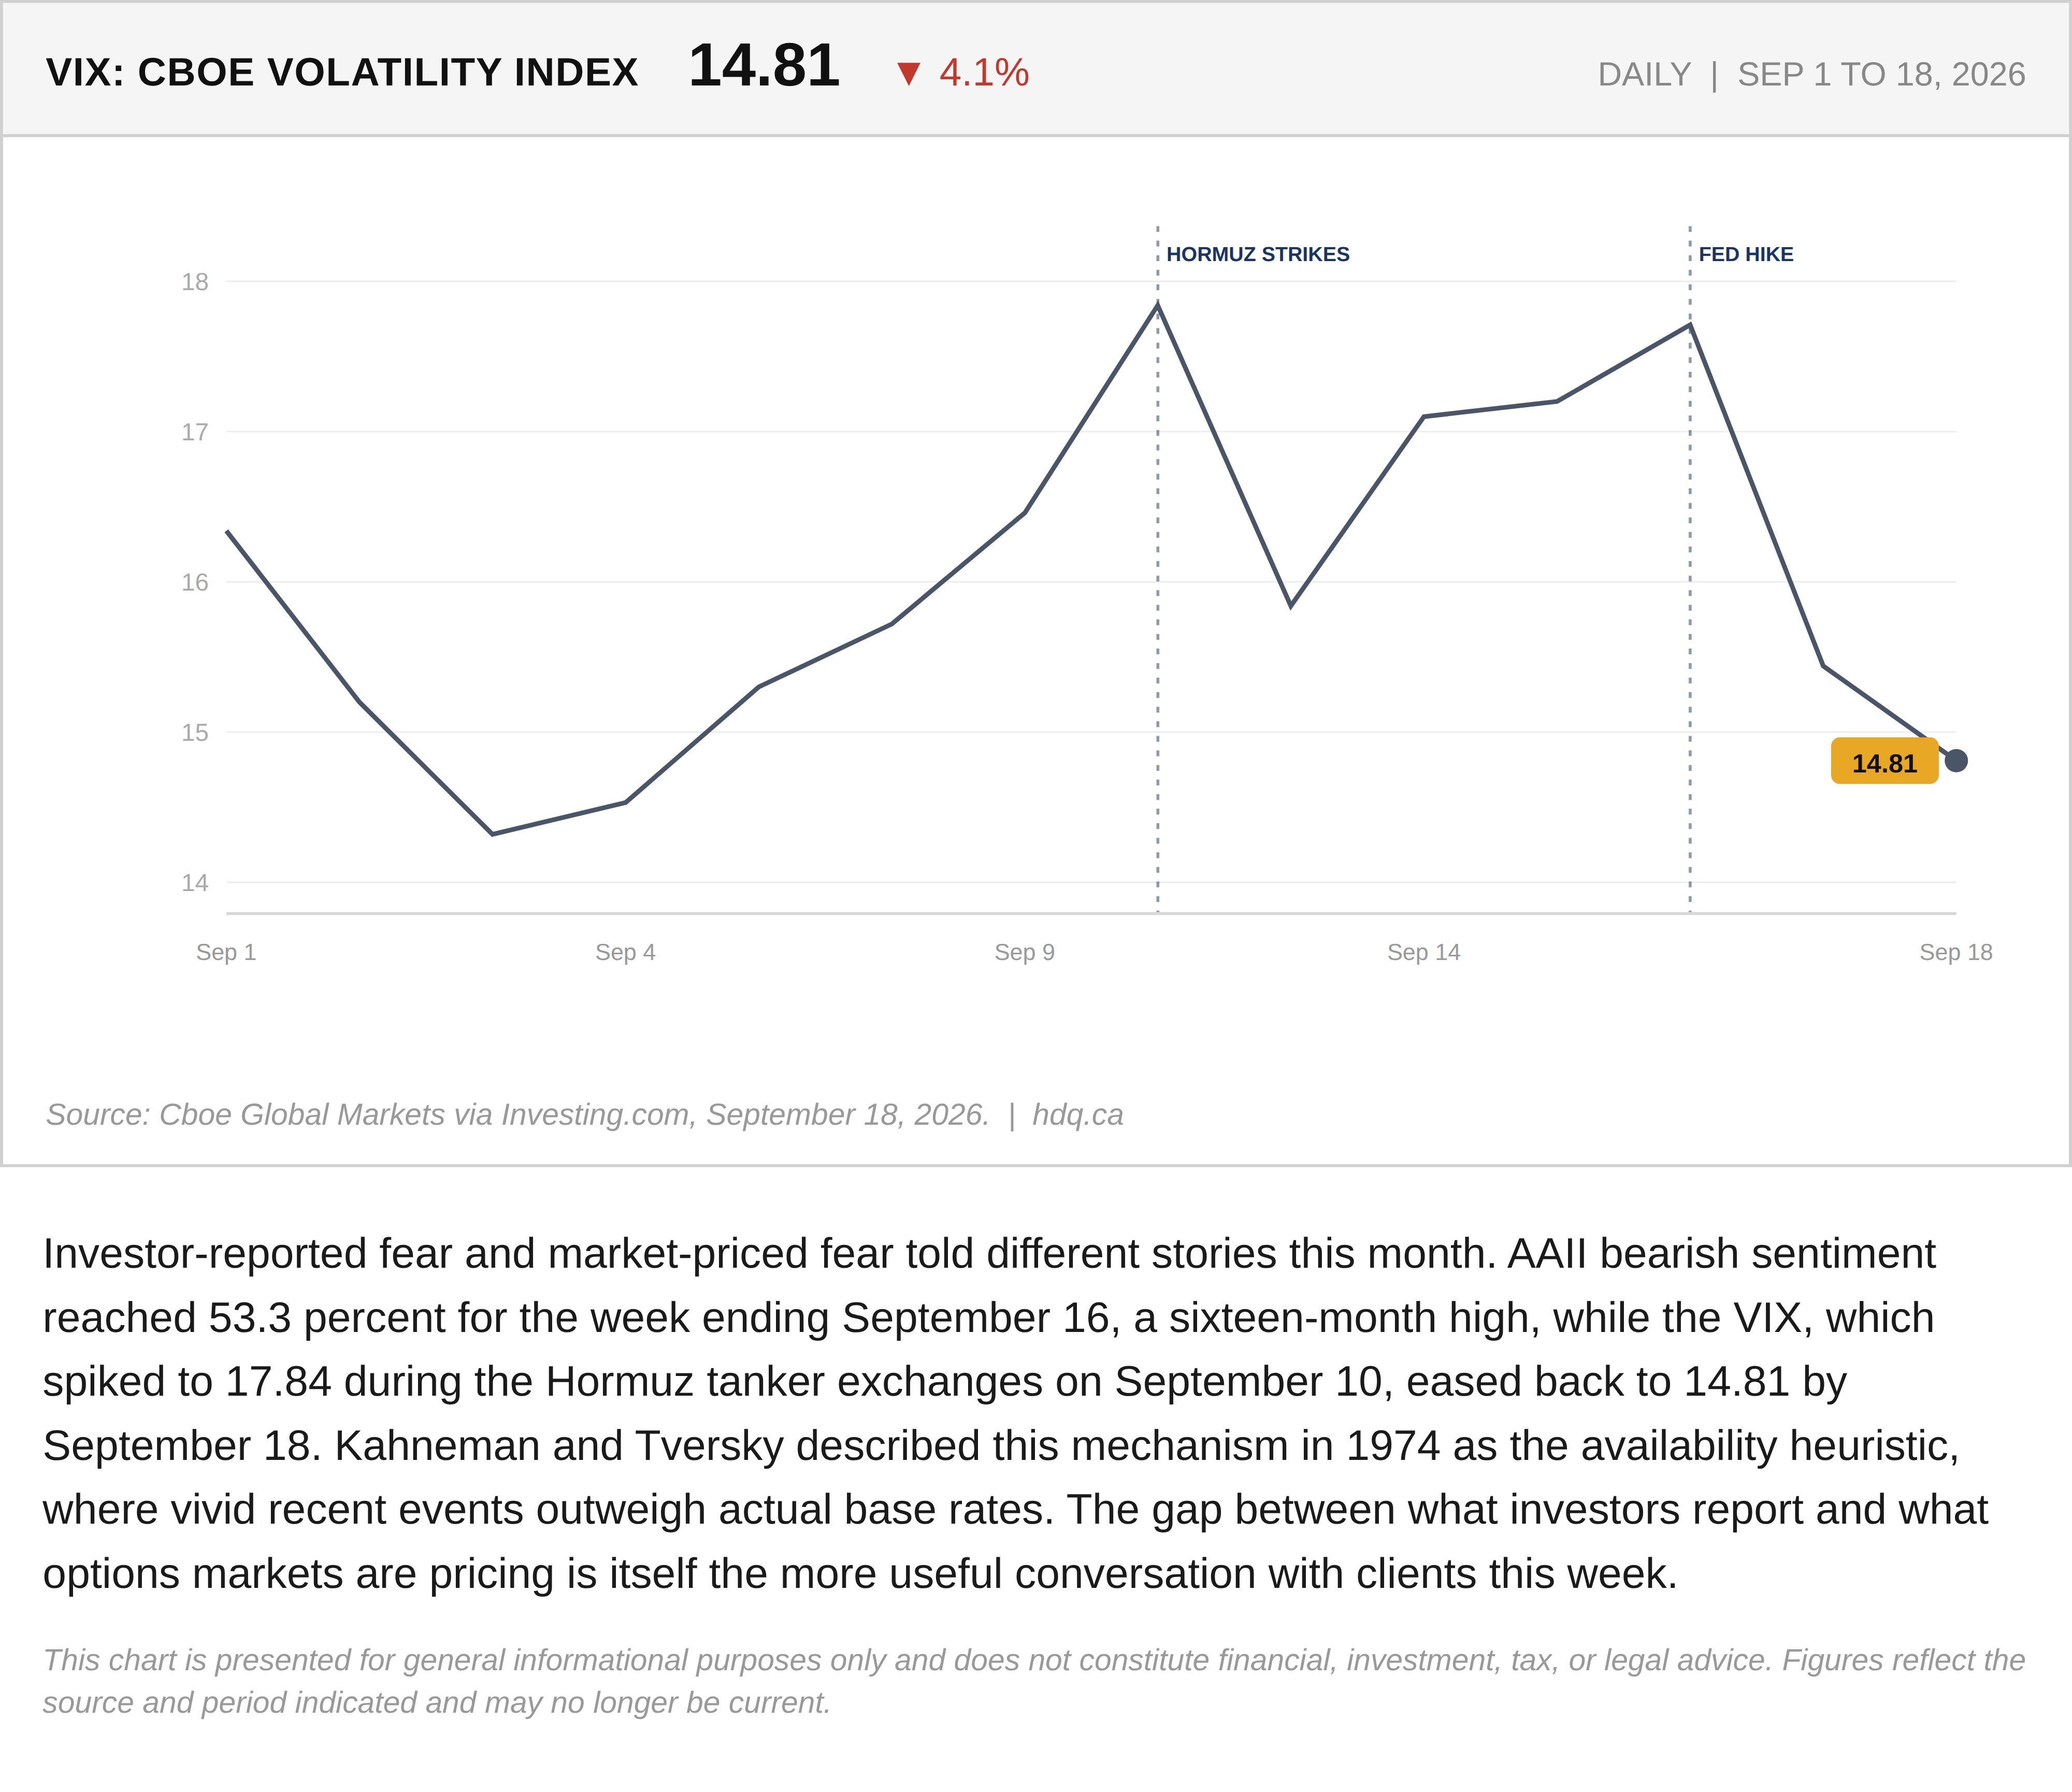
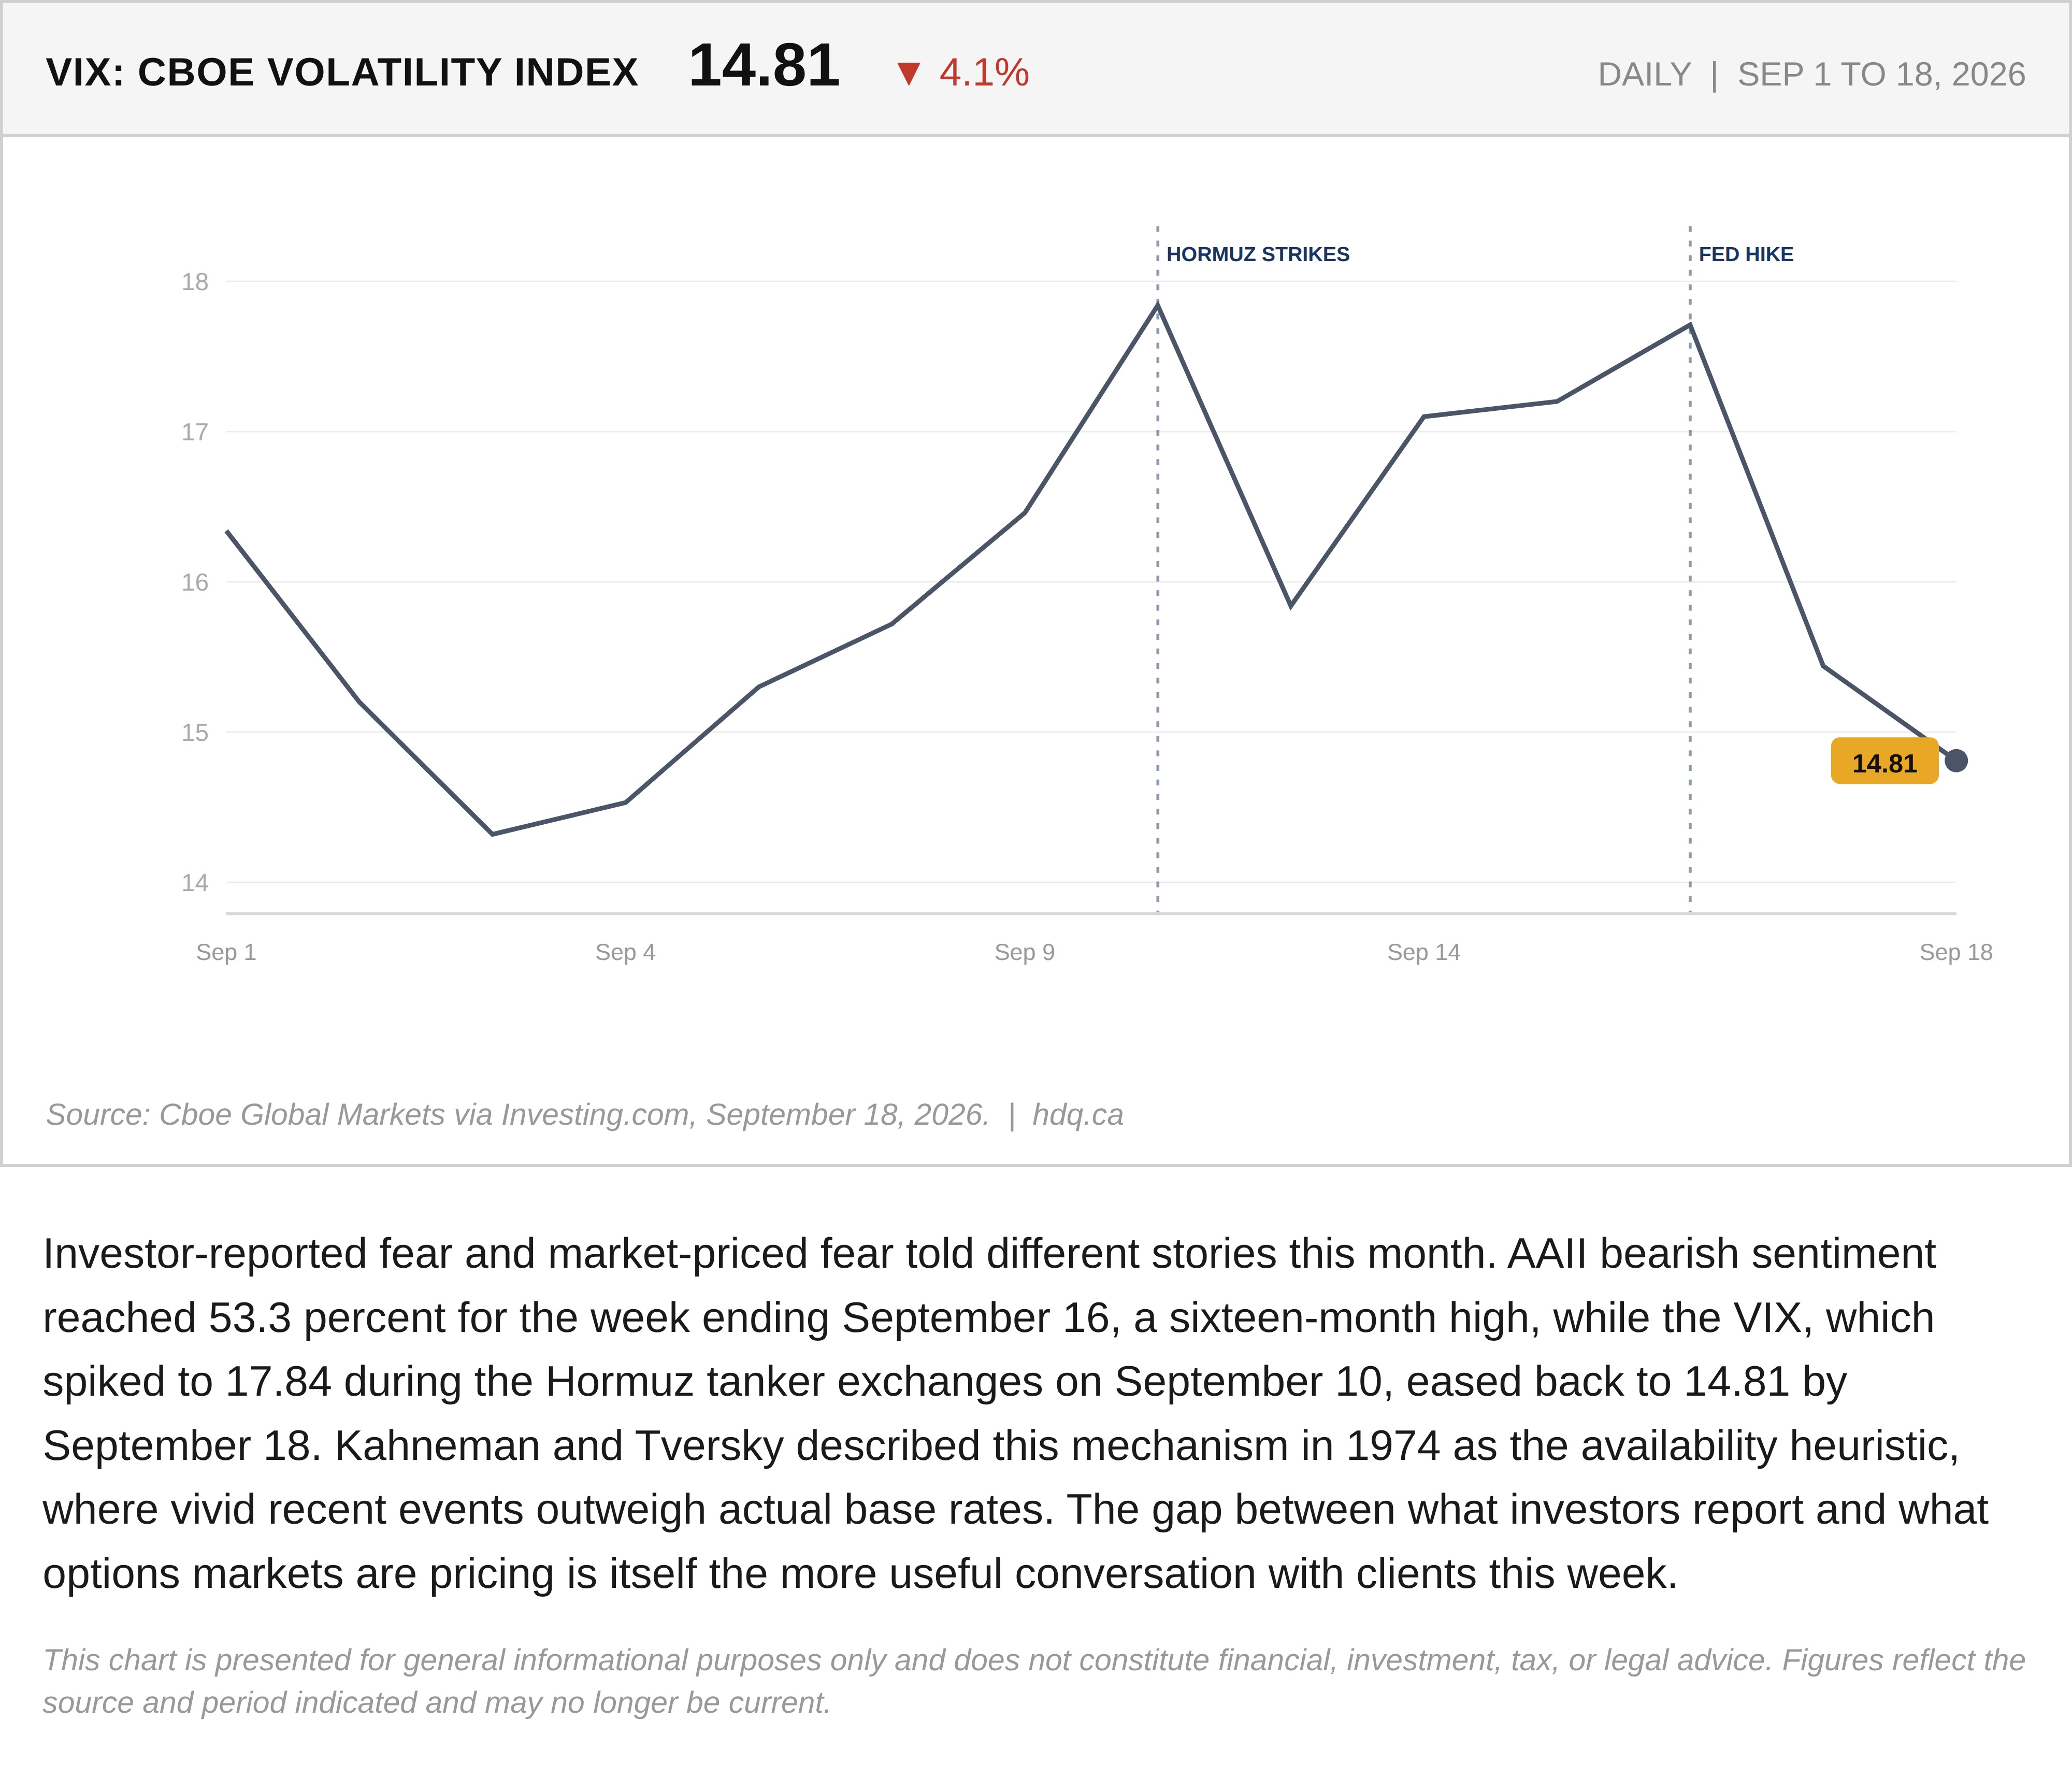
Investor-reported fear and market-priced fear told different stories this month. AAII bearish sentiment reached 53.3 percent for the week ending September 16, a sixteen-month high, while the VIX, which spiked to 17.84 during the Hormuz tanker exchanges on September 10, eased back to 14.81 by September 18. Kahneman and Tversky described this mechanism in 1974 as the availability heuristic, where vivid recent events outweigh actual base rates. The gap between what investors report and what options markets are pricing is itself the more useful conversation with clients this week.
This chart is presented for general informational purposes only and does not constitute financial, investment, tax, or legal advice. Figures reflect the source and period indicated and may no longer be current.
Related charts
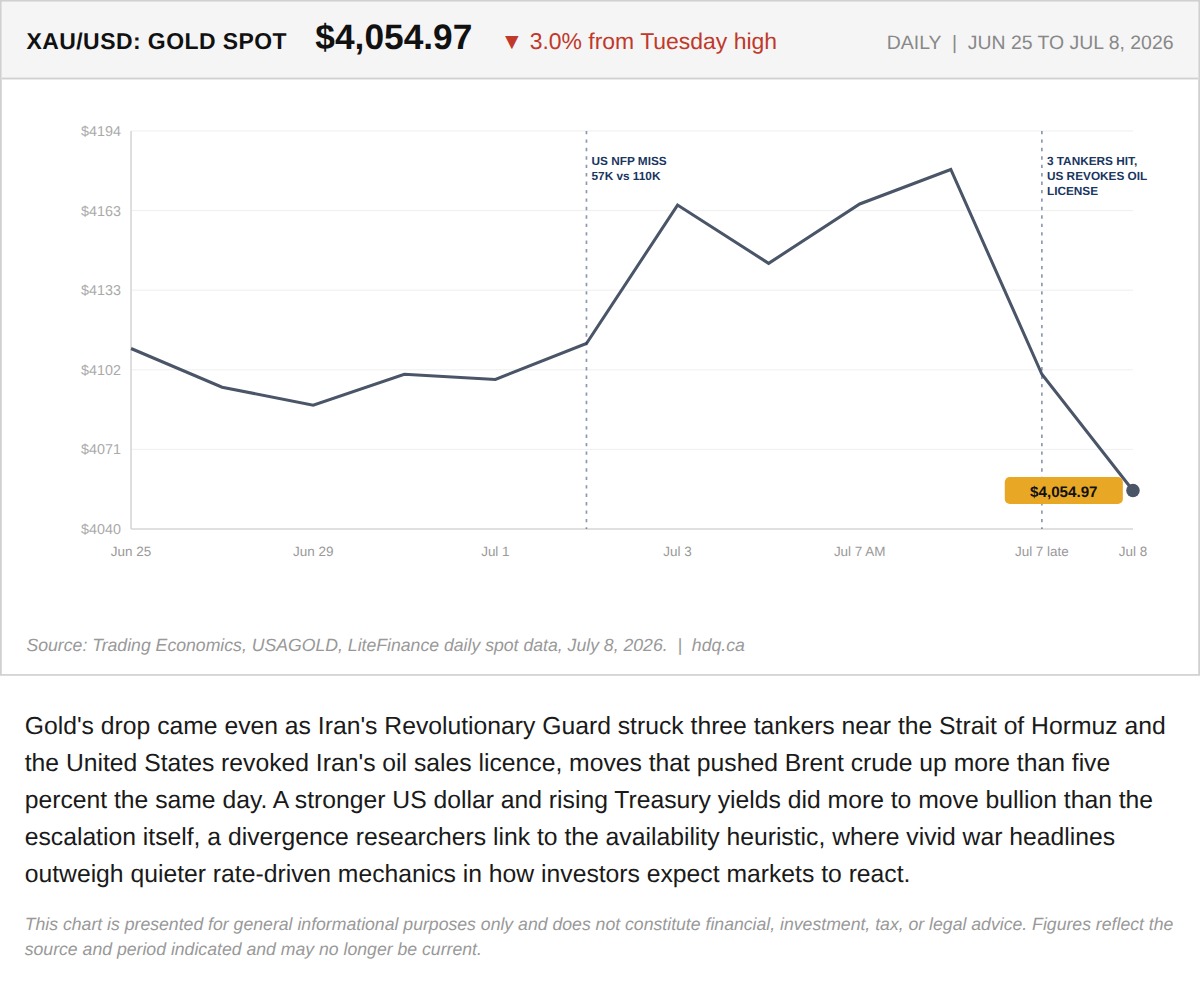
Gold's drop came even as Iran's Revolutionary Guard struck three tankers near the Strait of Hormuz and the United States revoked Iran's oil…
Gold Fell 3% While Iran Attacked Tankers in the Strait of Hormuz
July 8, 2026
View chart & download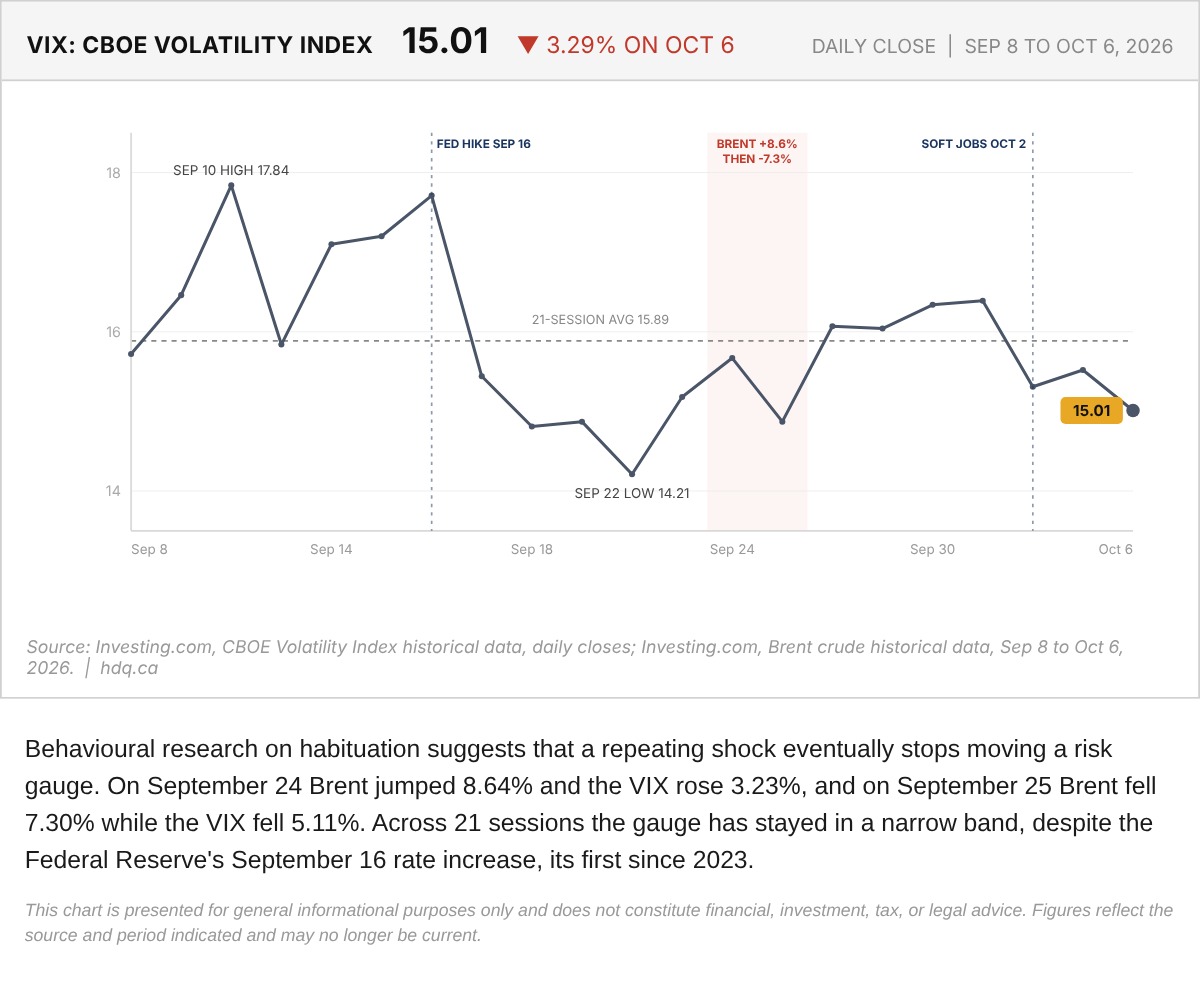
Behavioural research on habituation suggests that a repeating shock eventually stops moving a risk gauge.
VIX Daily Close and Habituation to Oil Shocks, September 8 to October 6
October 7, 2026
View chart & download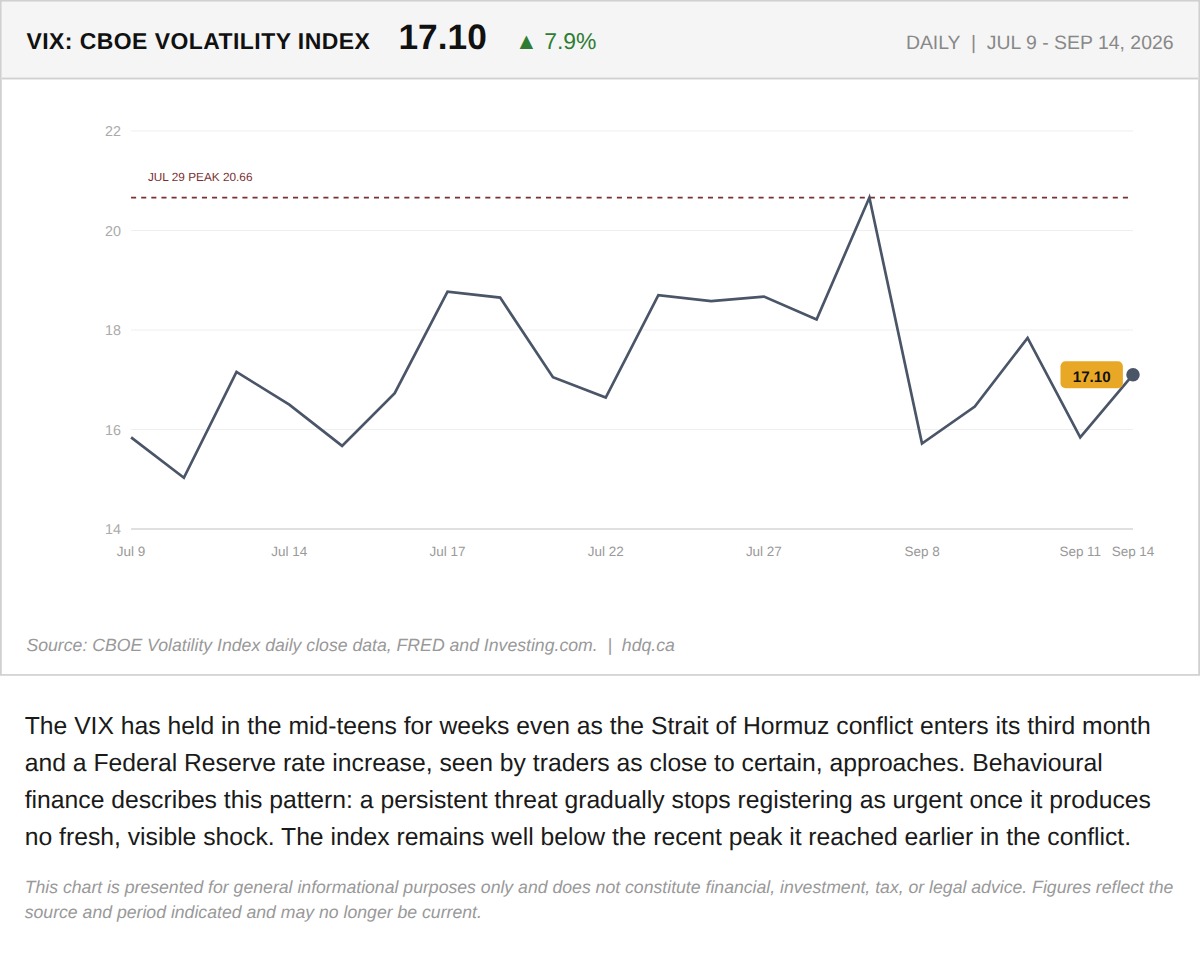
The VIX has held in the mid-teens for weeks even as the Strait of Hormuz conflict enters its third month and a Federal Reserve rate…
Why the Fear Gauge Is Sleeping Through a War and a Rate Hike
September 16, 2026
View chart & download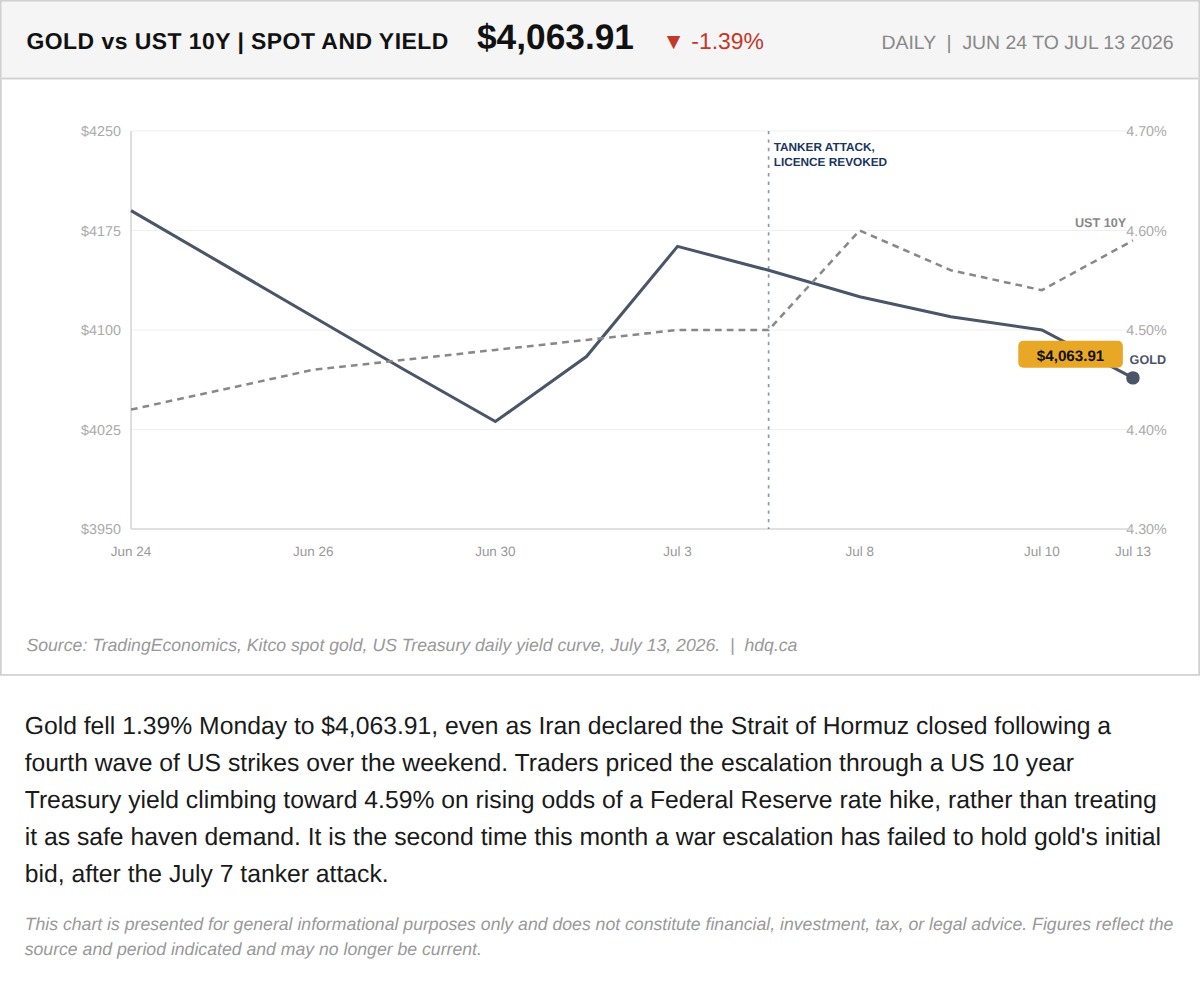
Gold fell 1.39% Monday to $4,063.91, even as Iran declared the Strait of Hormuz closed following a fourth wave of US strikes over the weekend.
Gold Fell on the Worst Hormuz Escalation in Months. That Is Not a Contradiction.
July 13, 2026
View chart & download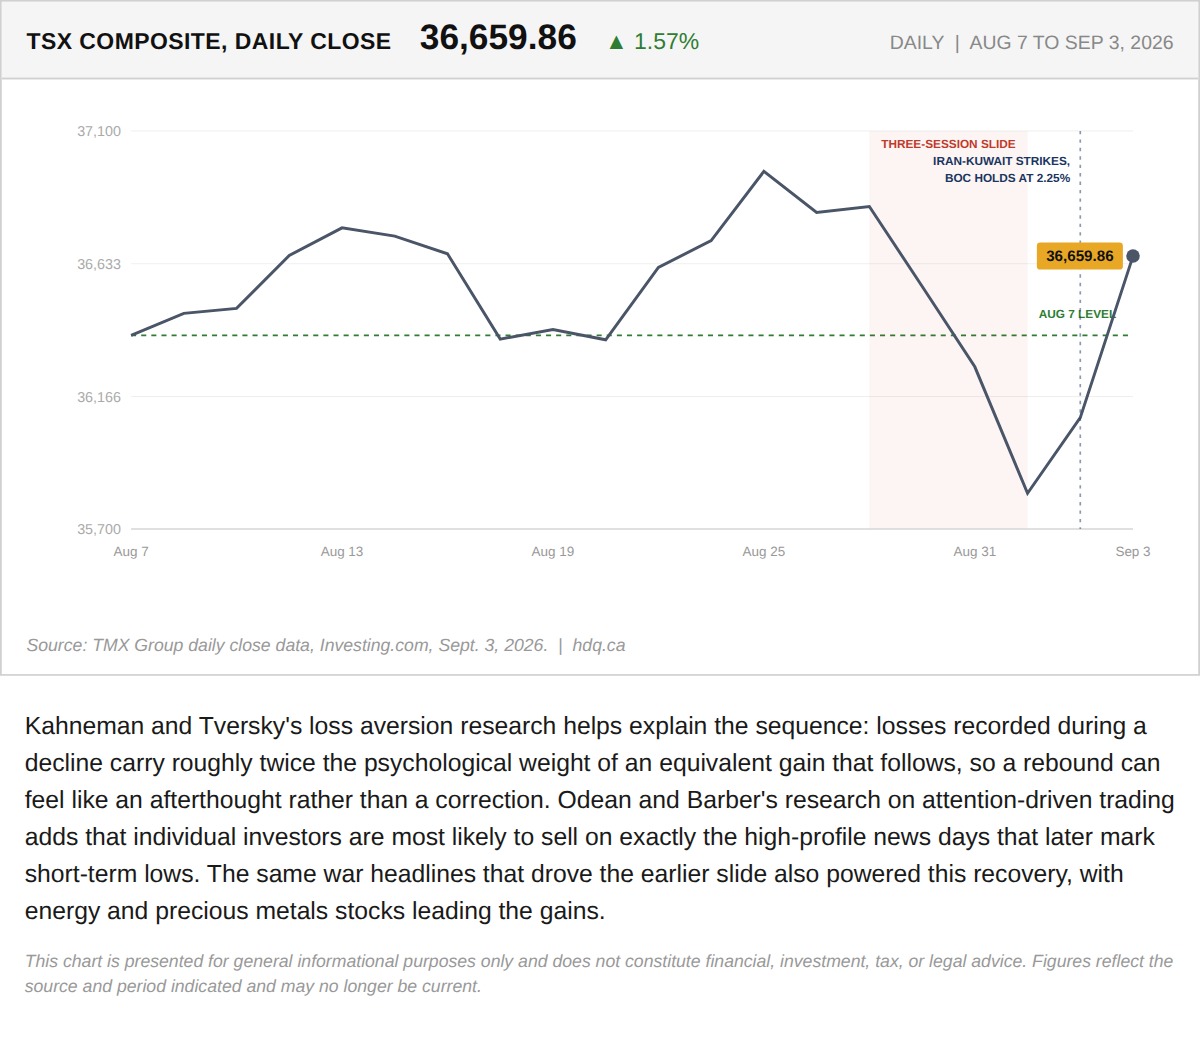
Kahneman and Tversky's loss aversion research helps explain the sequence: losses recorded during a decline carry roughly twice the…
Why the TSX's Two-Day Rebound Is the Most Dangerous Data Point on the Chart
September 4, 2026
View chart & download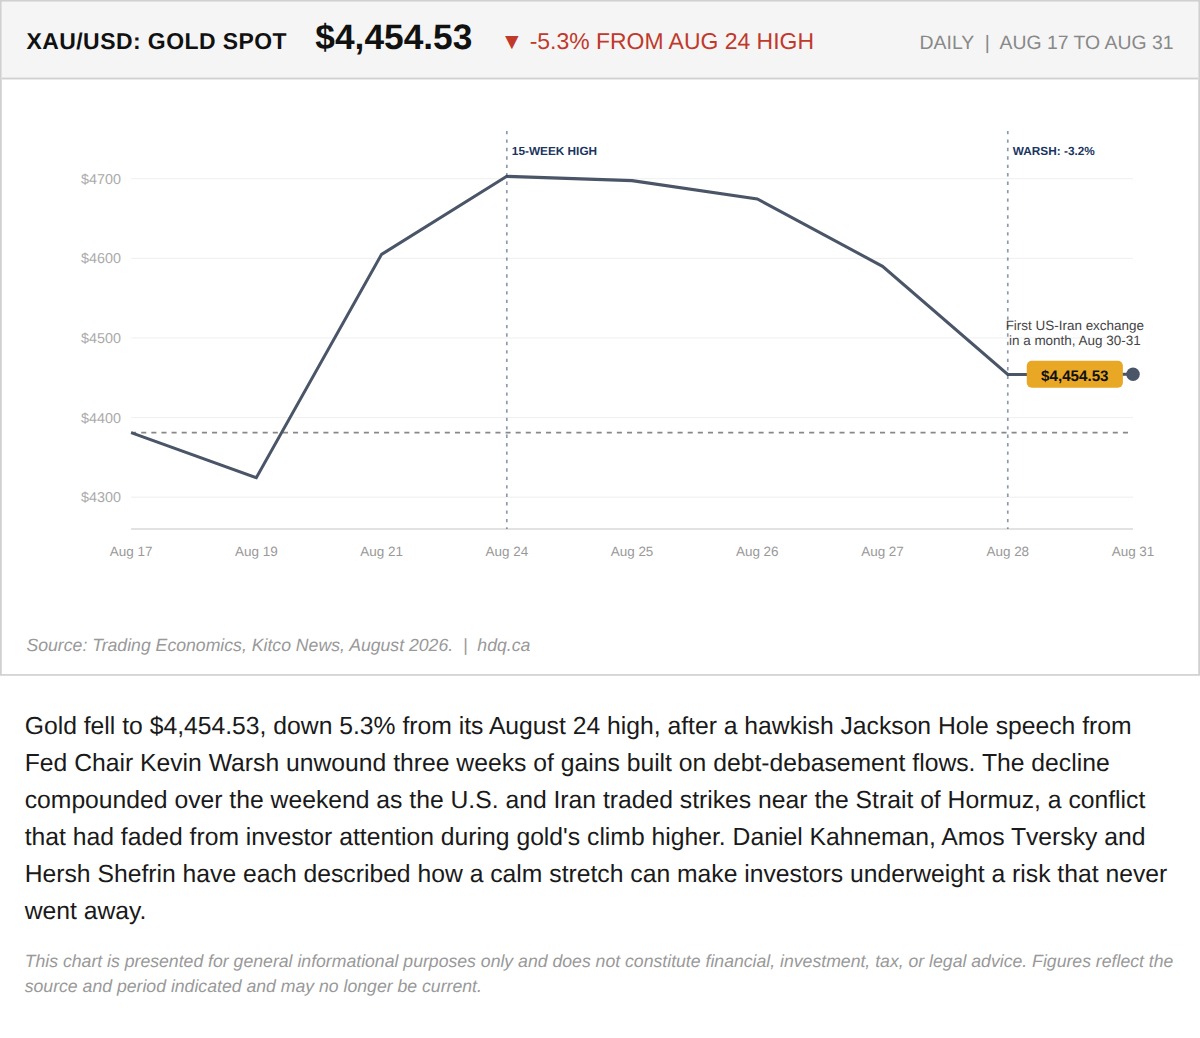
Gold fell to $4,454.53, down 5.3% from its August 24 high, after a hawkish Jackson Hole speech from Fed Chair Kevin Warsh unwound three weeks of gains built on debt-debasement flows.
Gold's Quiet Climb to a 15-Week High Hid the Risk That Just Came Back
August 31, 2026
View chart & download