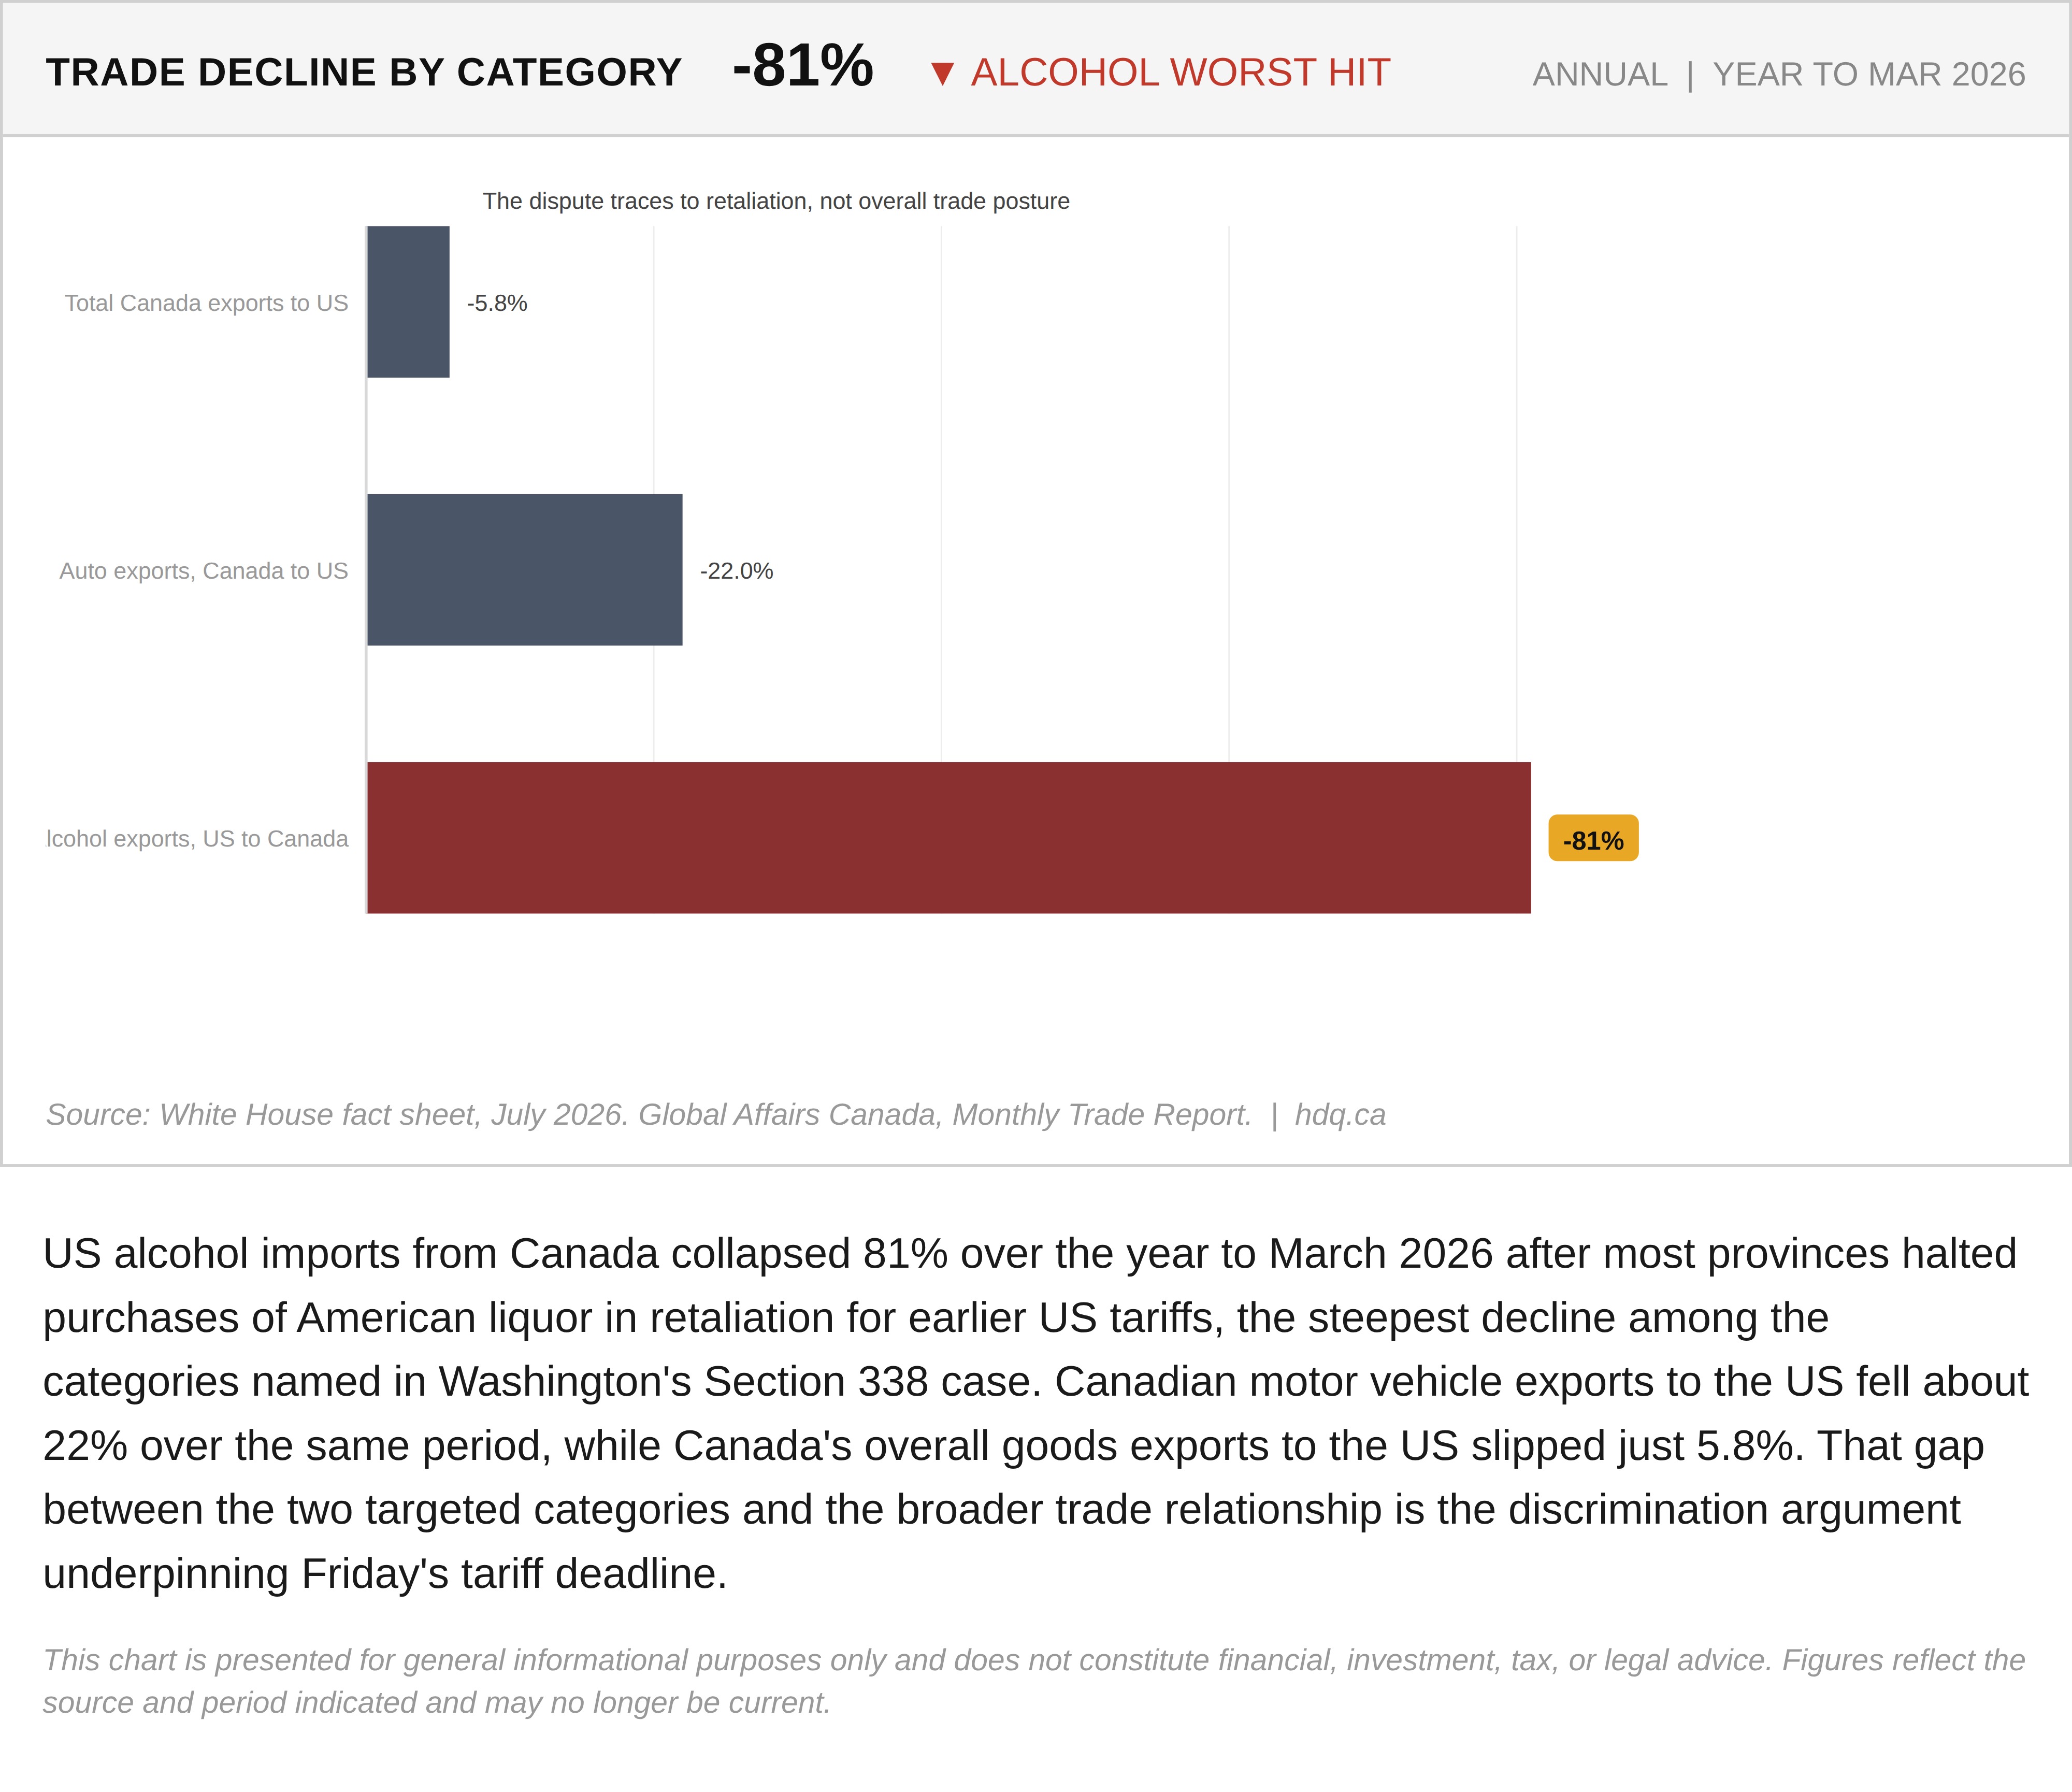
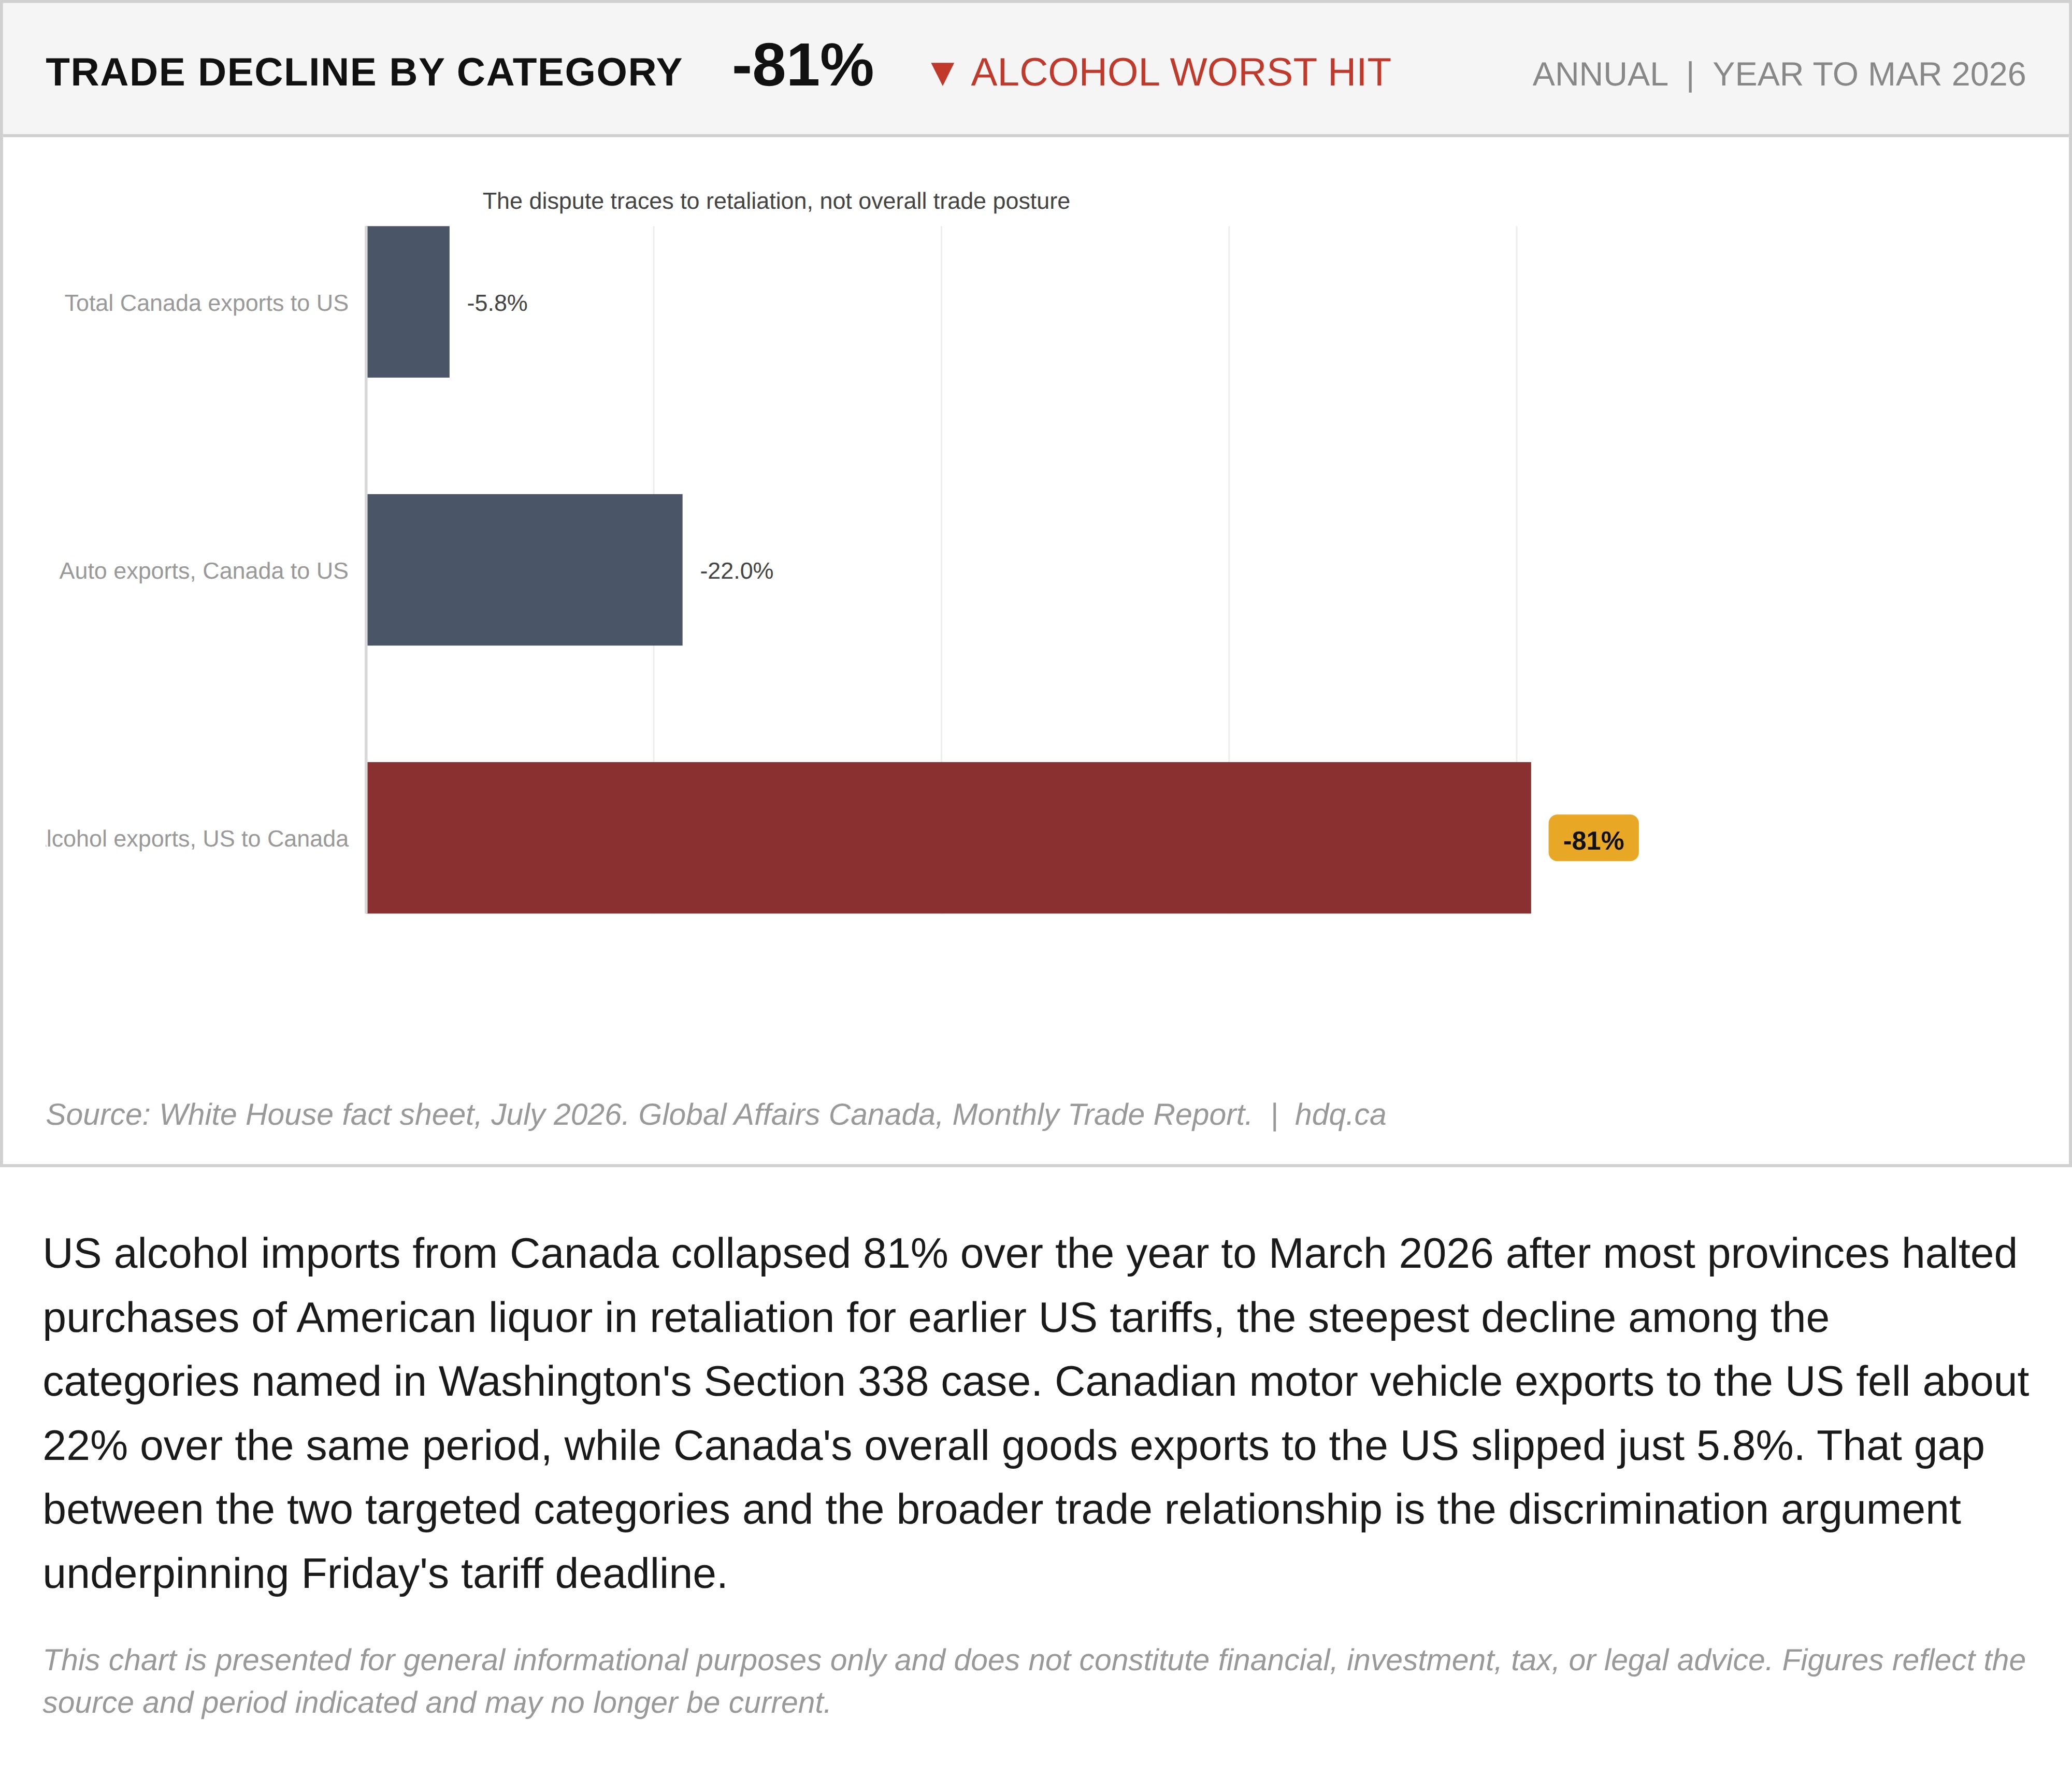
US alcohol imports from Canada collapsed 81% over the year to March 2026 after most provinces halted purchases of American liquor in retaliation for earlier US tariffs, the steepest decline among the categories named in Washington's Section 338 case. Canadian motor vehicle exports to the US fell about 22% over the same period, while Canada's overall goods exports to the US slipped just 5.8%. That gap between the two targeted categories and the broader trade relationship is the discrimination argument underpinning Friday's tariff deadline.
This chart is presented for general informational purposes only and does not constitute financial, investment, tax, or legal advice. Figures reflect the source and period indicated and may no longer be current.
Related charts
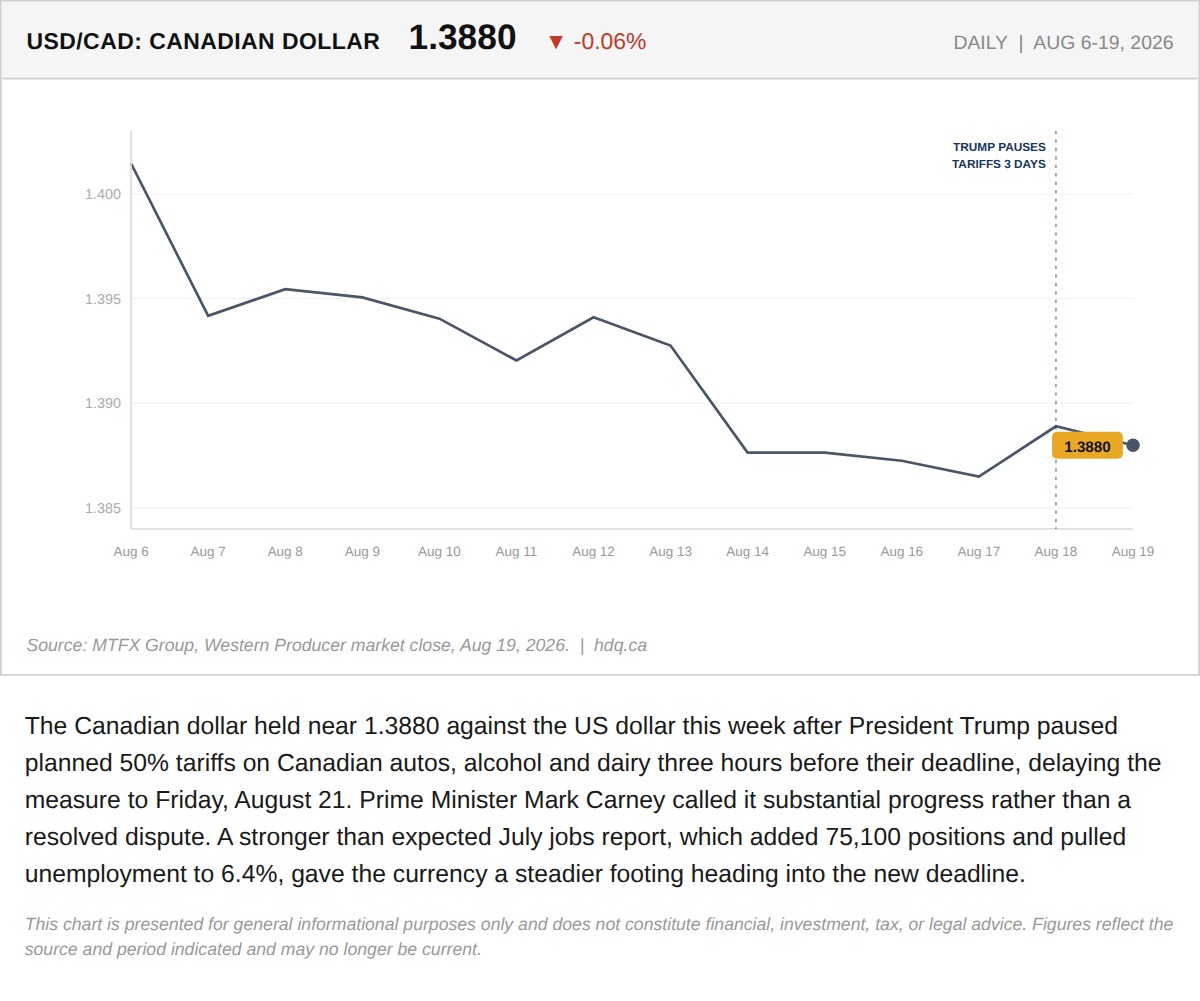
The Canadian dollar held near 1.3880 against the US dollar this week after President Trump paused planned 50% tariffs on Canadian autos,…
The Certainty Effect Is Doing the Heavy Lifting in This Morning's Tariff Relief Rally
August 19, 2026
View chart & download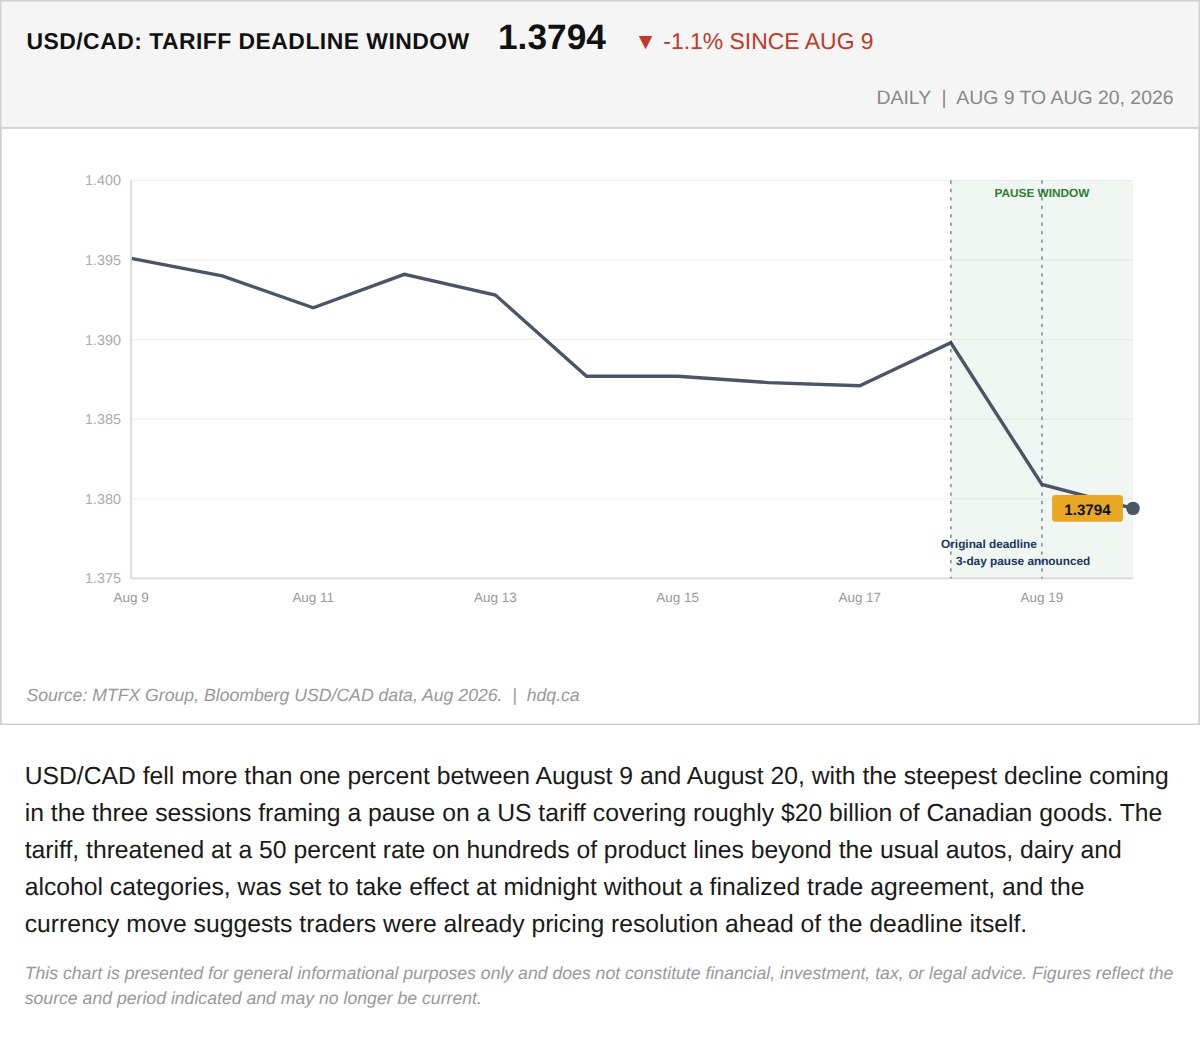
USD/CAD fell more than one percent between August 9 and August 20, with the steepest decline coming in the three sessions framing a pause…
USD/CAD Falls 1.1% as Currency Markets Price a Tariff Deal
August 21, 2026
View chart & download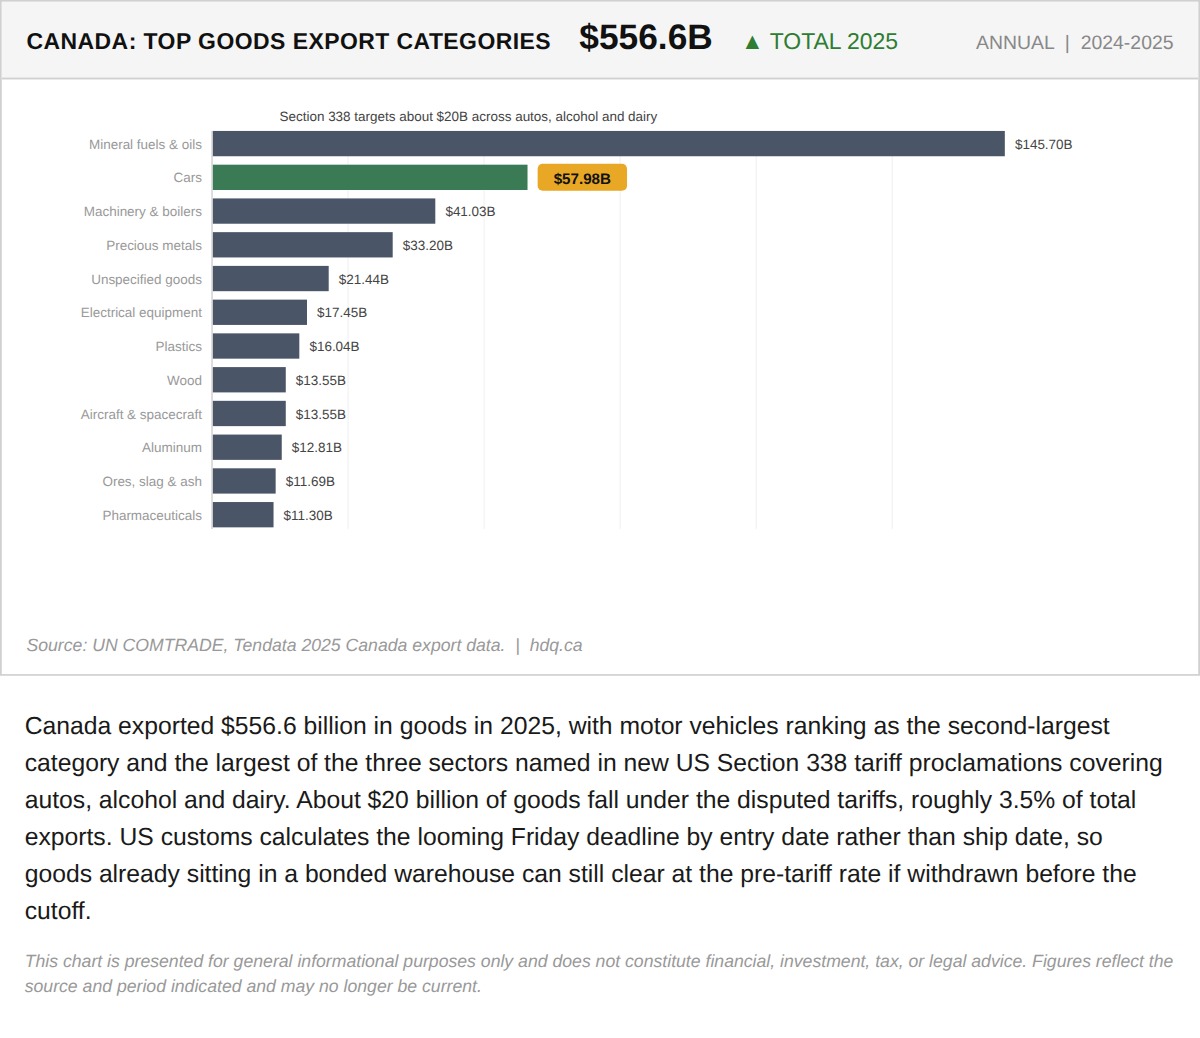
Canada exported $556.6 billion in goods in 2025, with motor vehicles ranking as the second-largest category and the largest of the three…
The Tariff Pause Is Not a Pause for Business Owner Clients With Cross-Border Supply Chains
August 19, 2026
View chart & download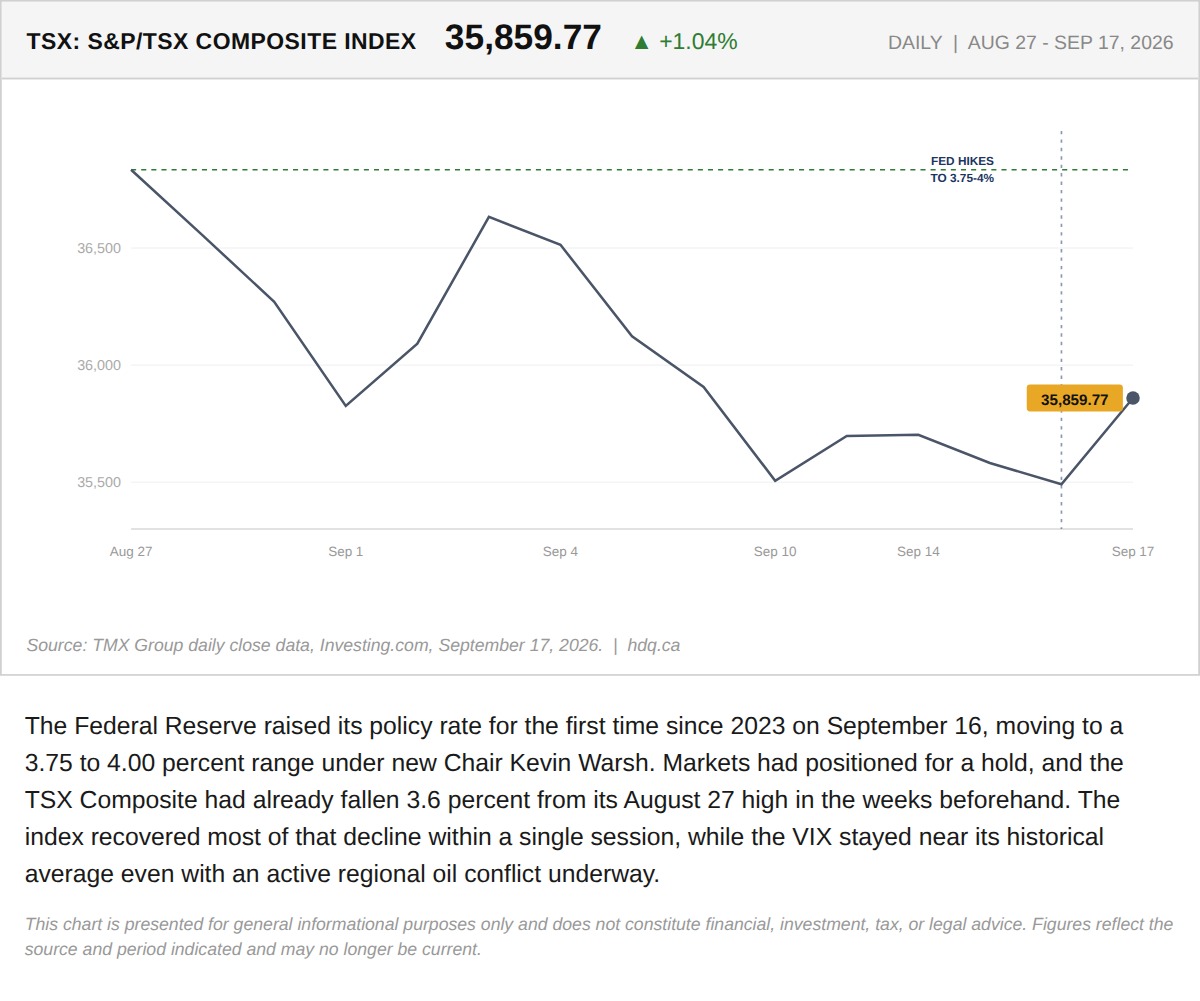
The Federal Reserve raised its policy rate for the first time since 2023 on September 16, moving to a 3.75 to 4.00 percent range under new Chair Kevin Warsh.
The Fed Just Hiked for the First Time Since 2023, and the TSX Barely Blinked
September 18, 2026
View chart & download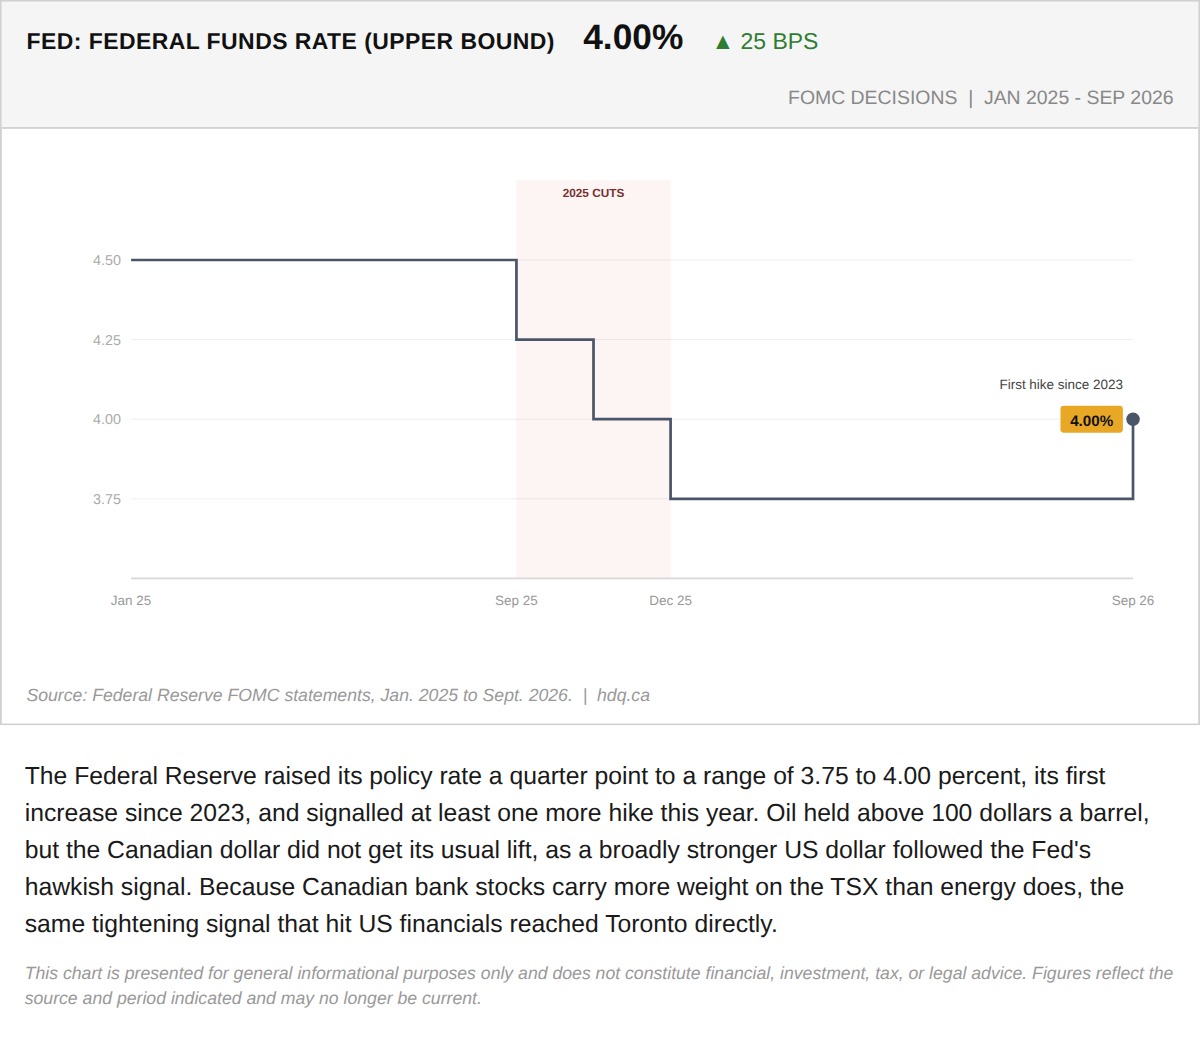
The Federal Reserve raised its policy rate a quarter point to a range of 3.75 to 4.00 percent, its first increase since 2023, and signalled at least one more hike this year.
The Fed's Hawkish Hike Broke the Loonie's Oil Shield the Same Day Ottawa Leaned on Europe
September 16, 2026
View chart & download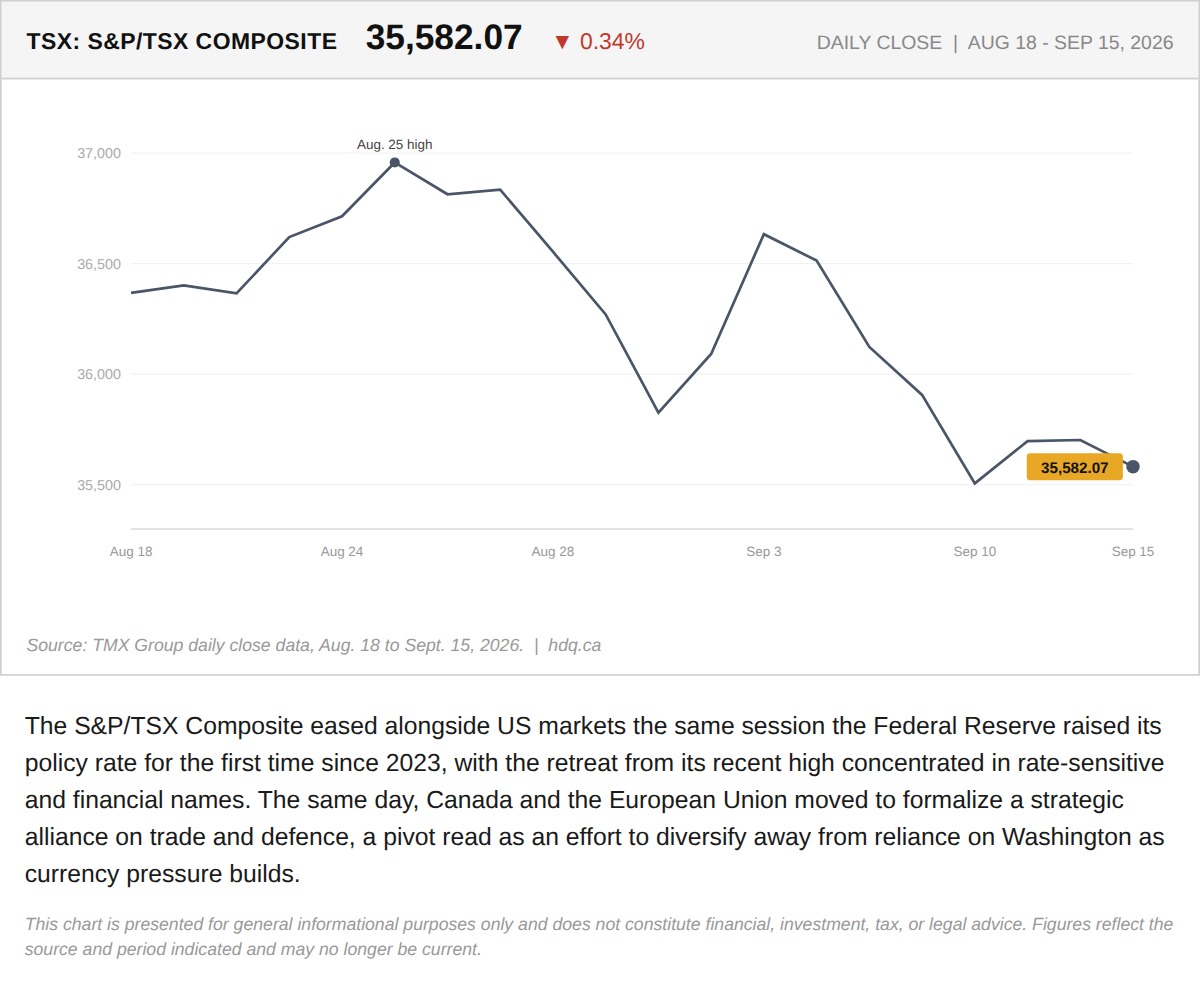
The S&P/TSX Composite eased alongside US markets the same session the Federal Reserve raised its policy rate for the first time since 2023,…
The Fed's Hawkish Hike Broke the Loonie's Oil Shield the Same Day Ottawa Leaned on Europe
September 16, 2026
View chart & download