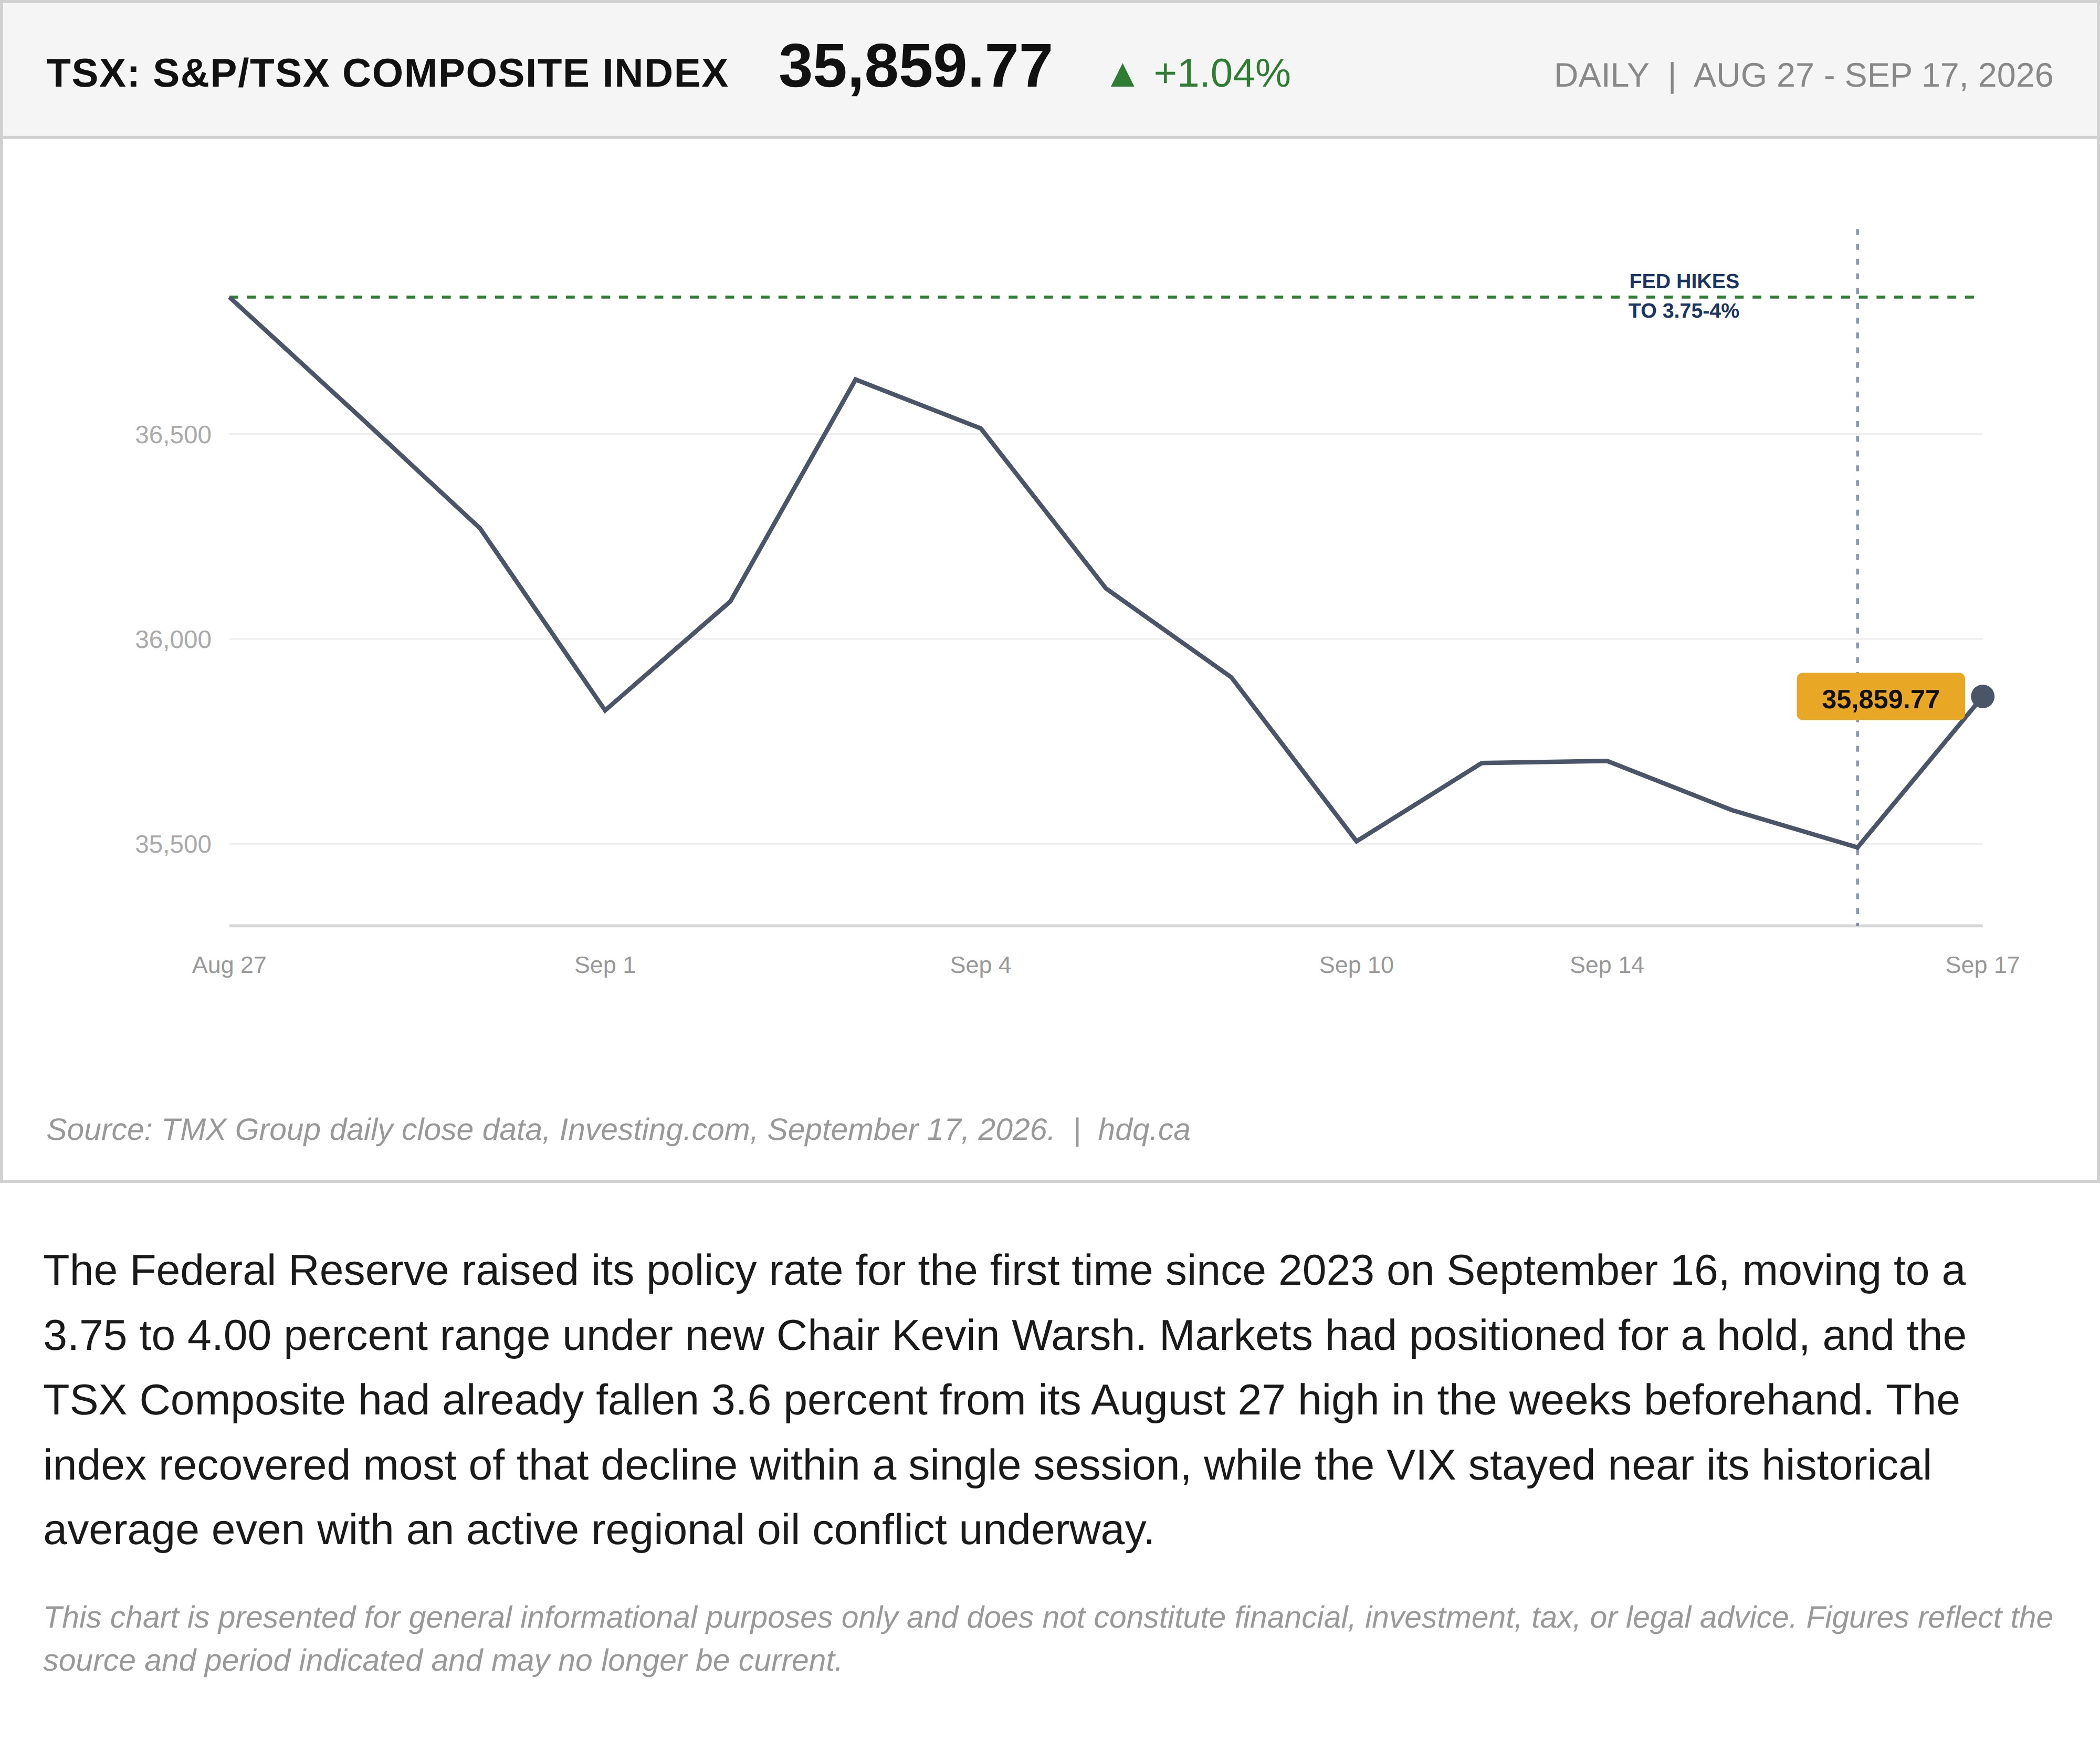
The Federal Reserve raised its policy rate for the first time since 2023 on September 16, moving to a 3.75 to 4.00 percent range under new Chair Kevin Warsh. Markets had positioned for a hold, and the TSX Composite had already fallen 3.6 percent from its August 27 high in the weeks beforehand. The index recovered most of that decline within a single session, while the VIX stayed near its historical average even with an active regional oil conflict underway.
This chart is presented for general informational purposes only and does not constitute financial, investment, tax, or legal advice. Figures reflect the source and period indicated and may no longer be current.
Related charts
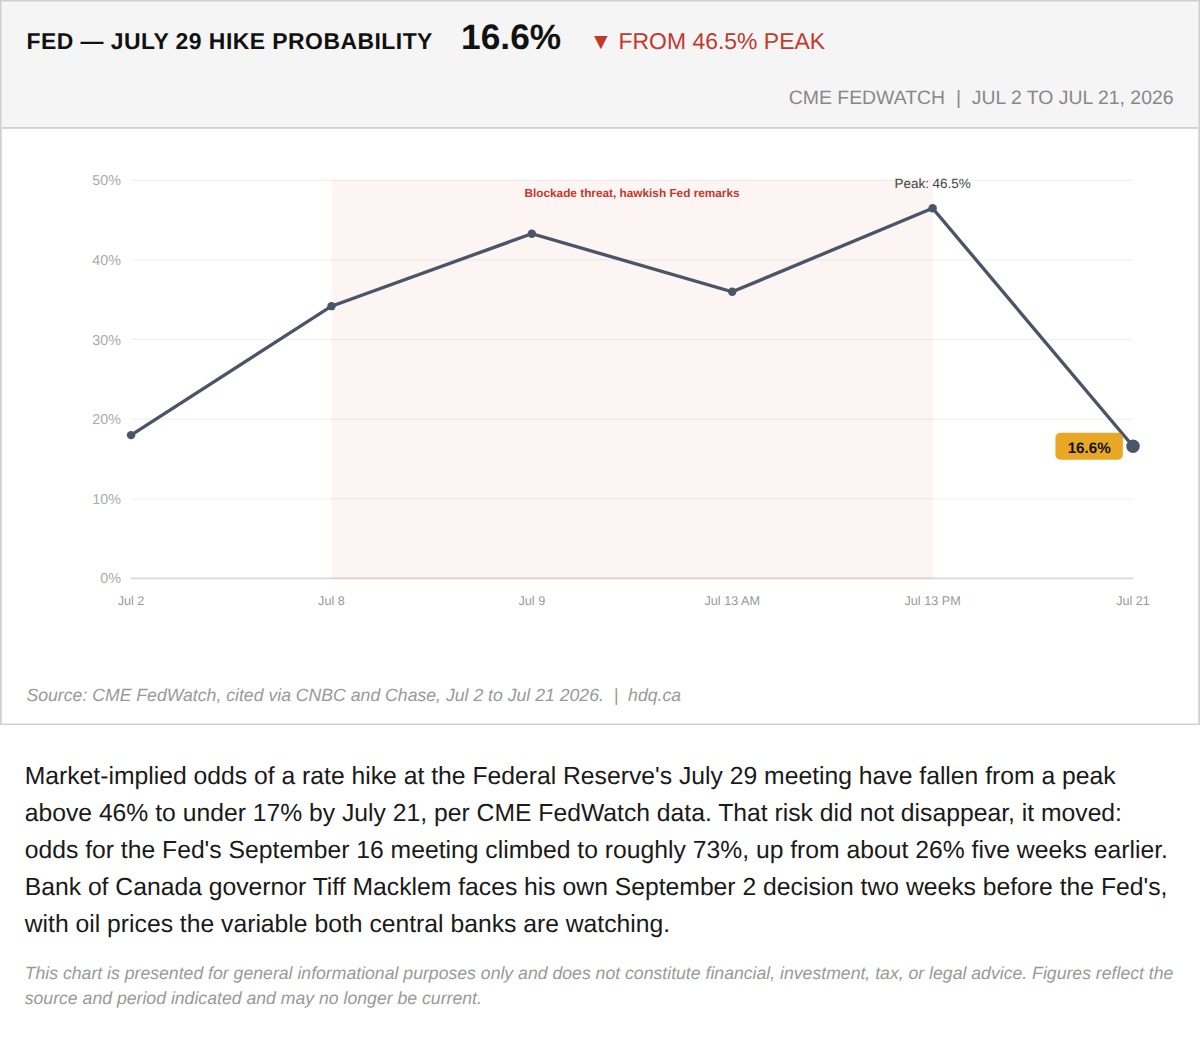
Market-implied odds of a rate hike at the Federal Reserve's July 29 meeting have fallen from a peak above 46% to under 17% by July 21, per CME FedWatch data.
The Fed Odds Faded. The BoC's September Dilemma Didn't.
July 23, 2026
View chart & download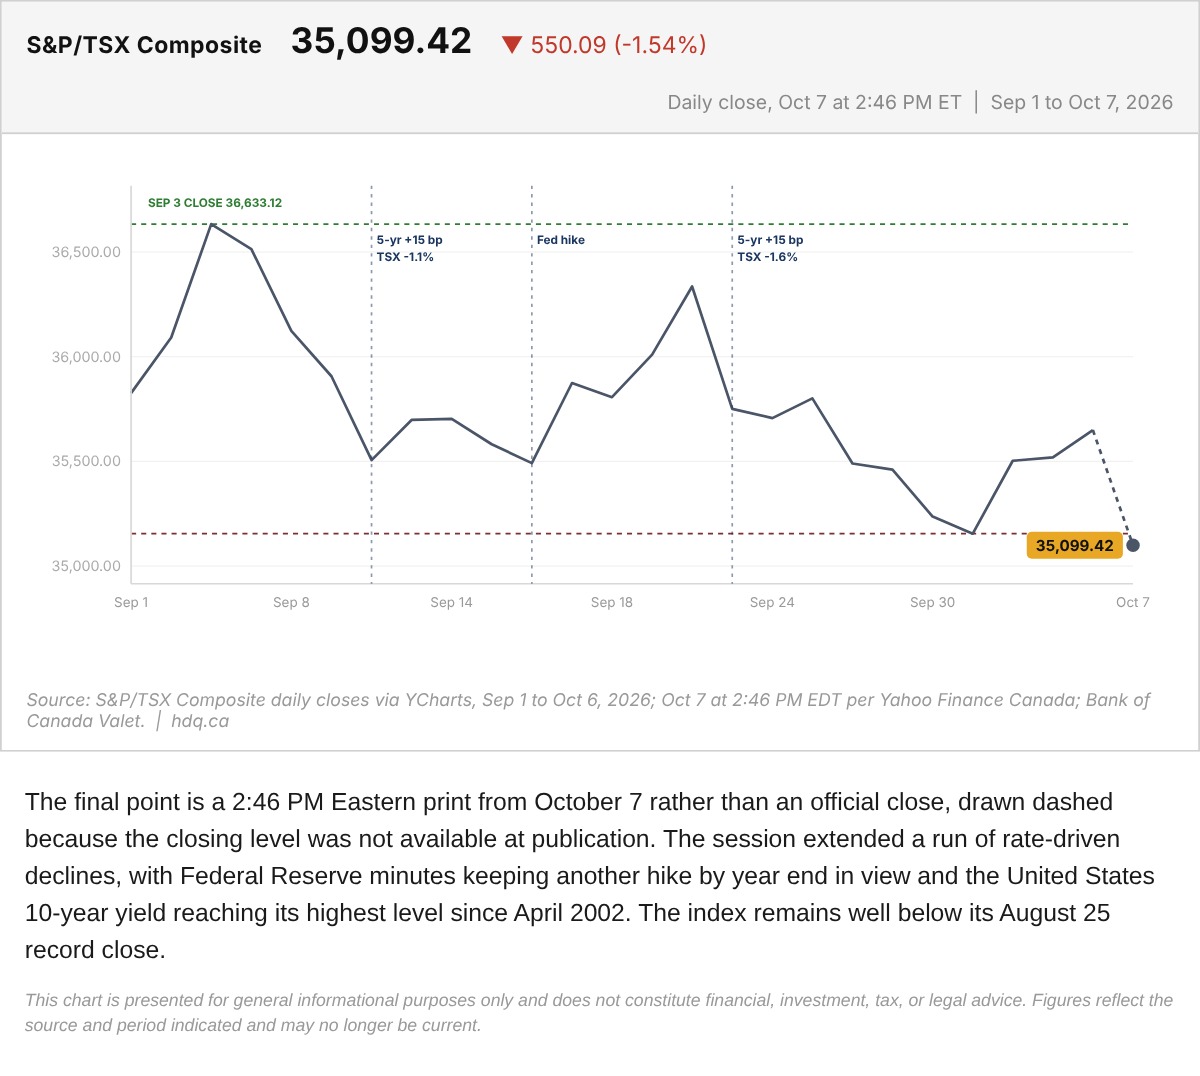
The final point is a 2:46 PM Eastern print from October 7 rather than an official close, drawn dashed because the closing level was not available at publication.
S&P/TSX Composite With the October 7 Midday Print
October 7, 2026
View chart & download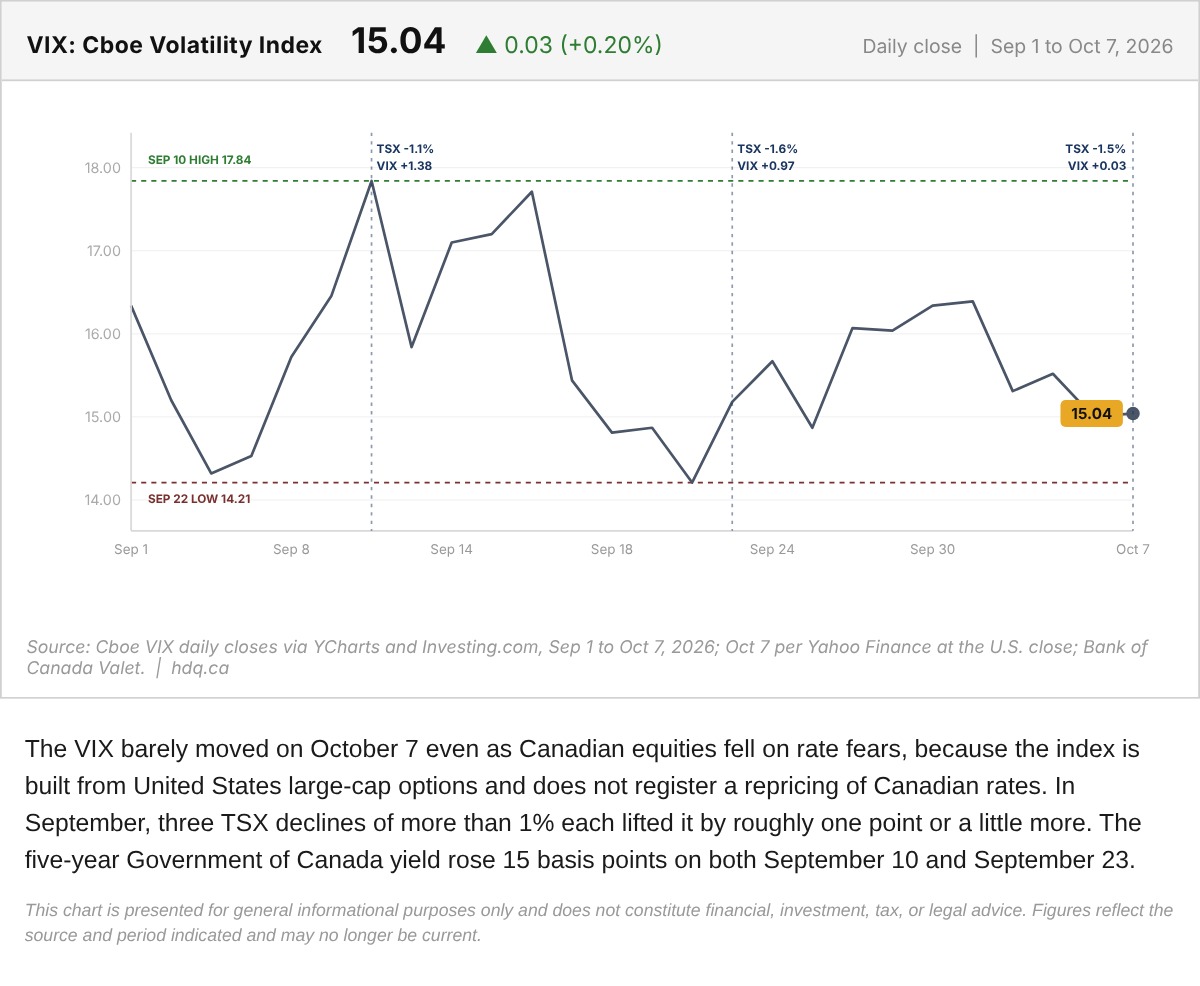
The VIX barely moved on October 7 even as Canadian equities fell on rate fears, because the index is built from United States large-cap…
VIX Daily Close on the Day Rate Fear Hit the TSX
October 7, 2026
View chart & download
Brent was the only one of the three to finish above its starting level, while the index and gold both fell.
Brent, TSX and Gold Rebased to the August 31 Close
September 30, 2026
View chart & download
The Bank of Canada held its policy rate at 2.25% for a seventh straight time, yet Canadian yields rose as United States yields surged.
Government of Canada Benchmark Yields, September 2026
September 30, 2026
View chart & download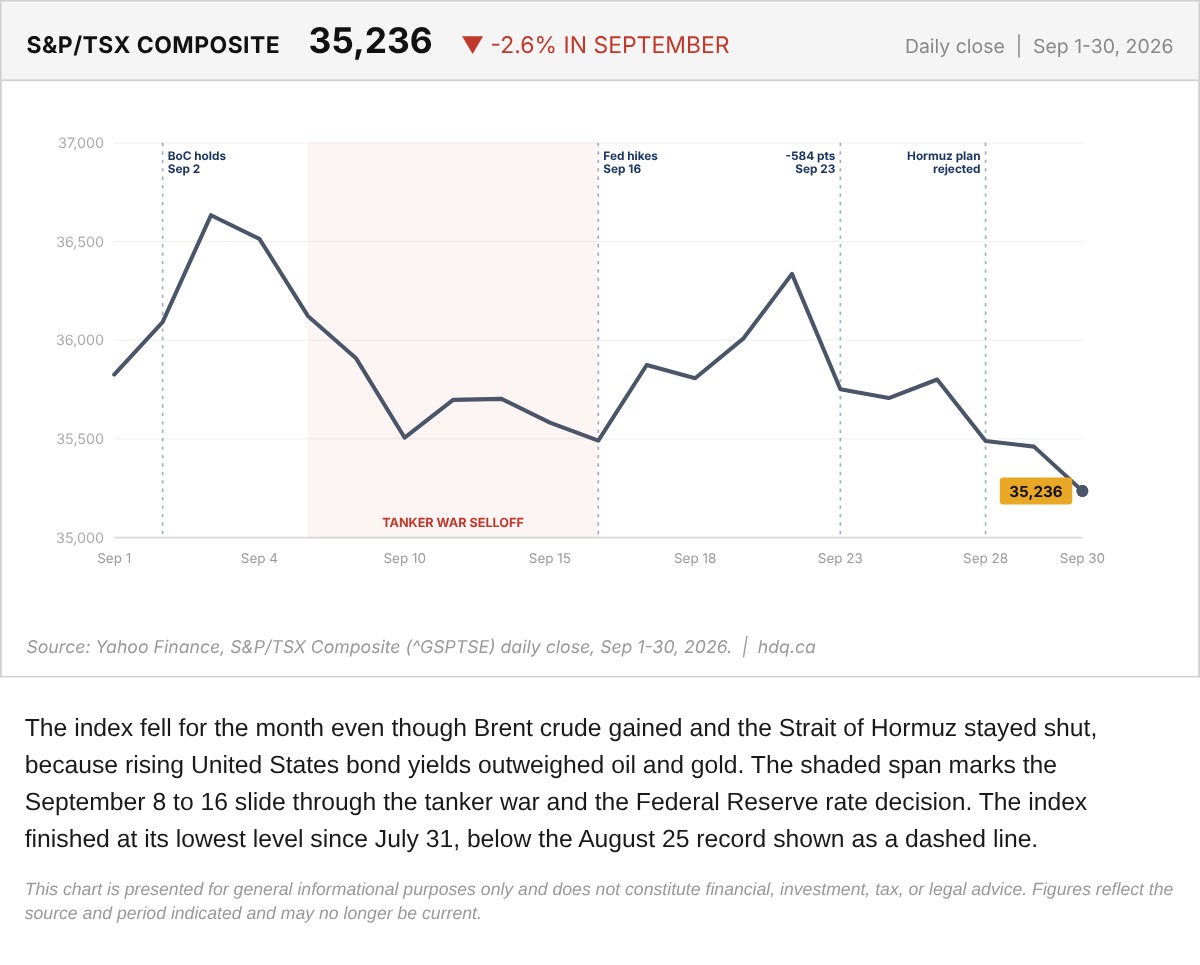
The index fell for the month even though Brent crude gained and the Strait of Hormuz stayed shut, because rising United States bond yields outweighed oil and gold.
S&P/TSX Composite Daily Close Through September 2026
September 30, 2026
View chart & download