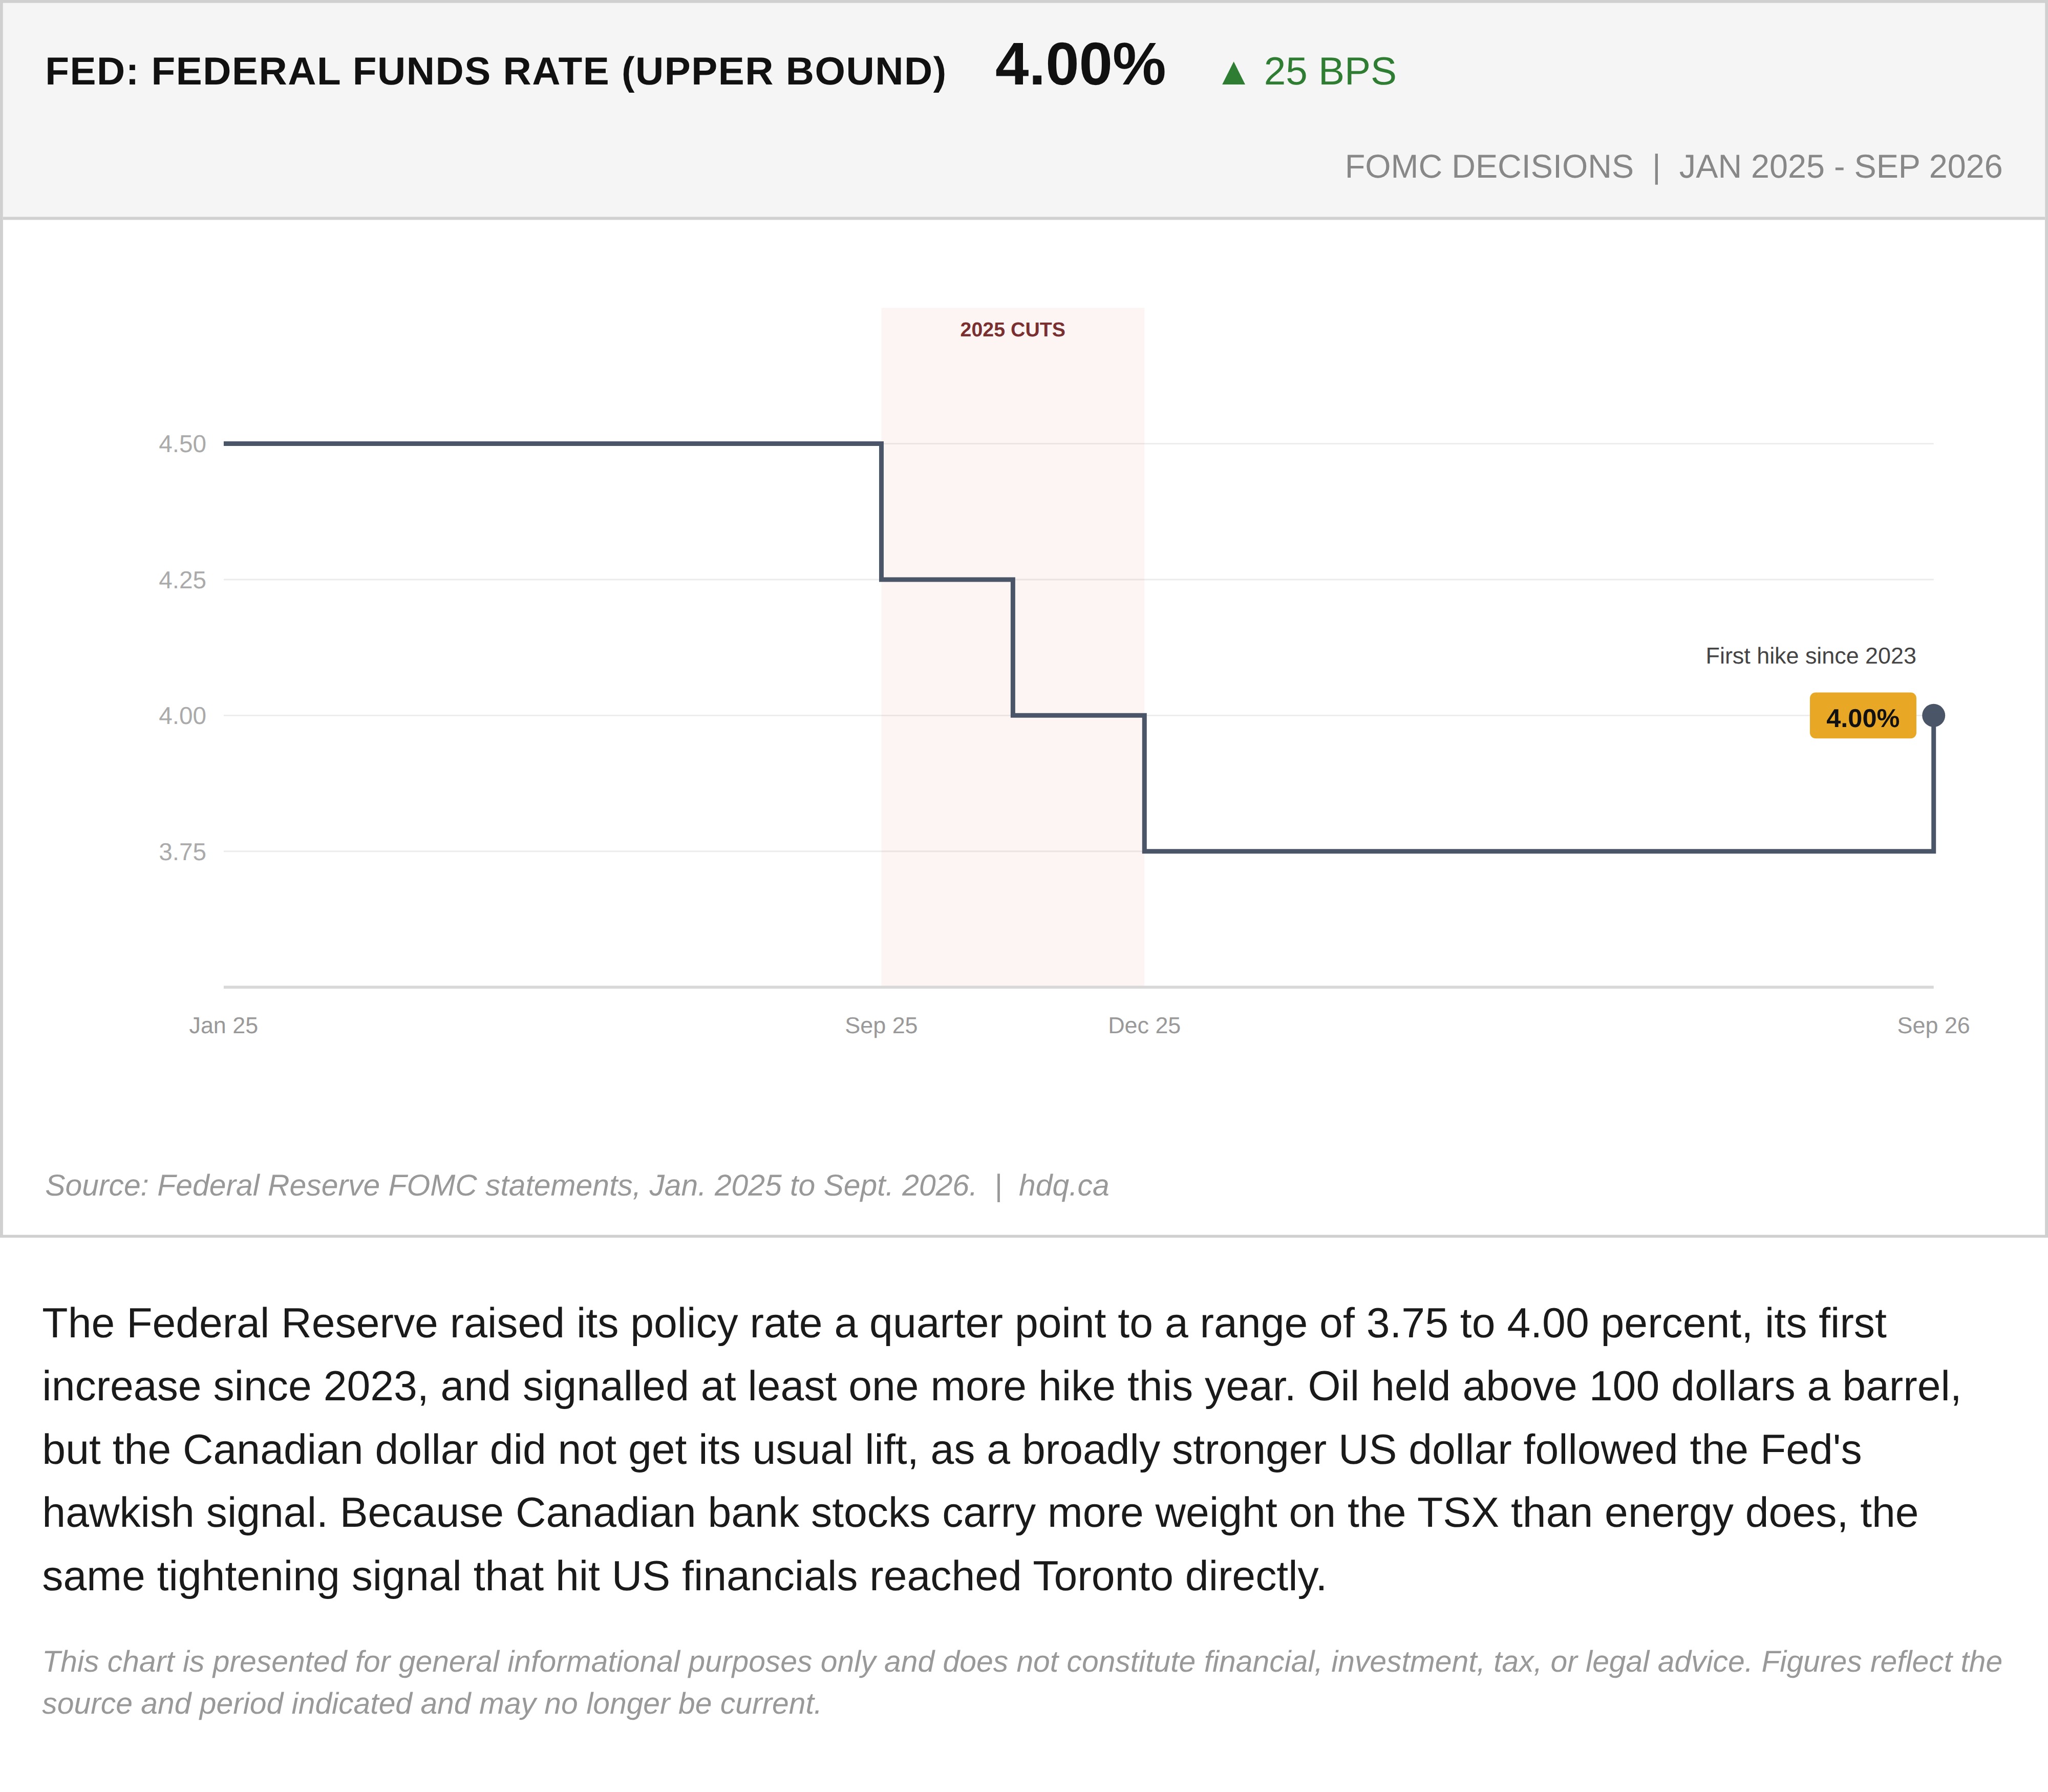
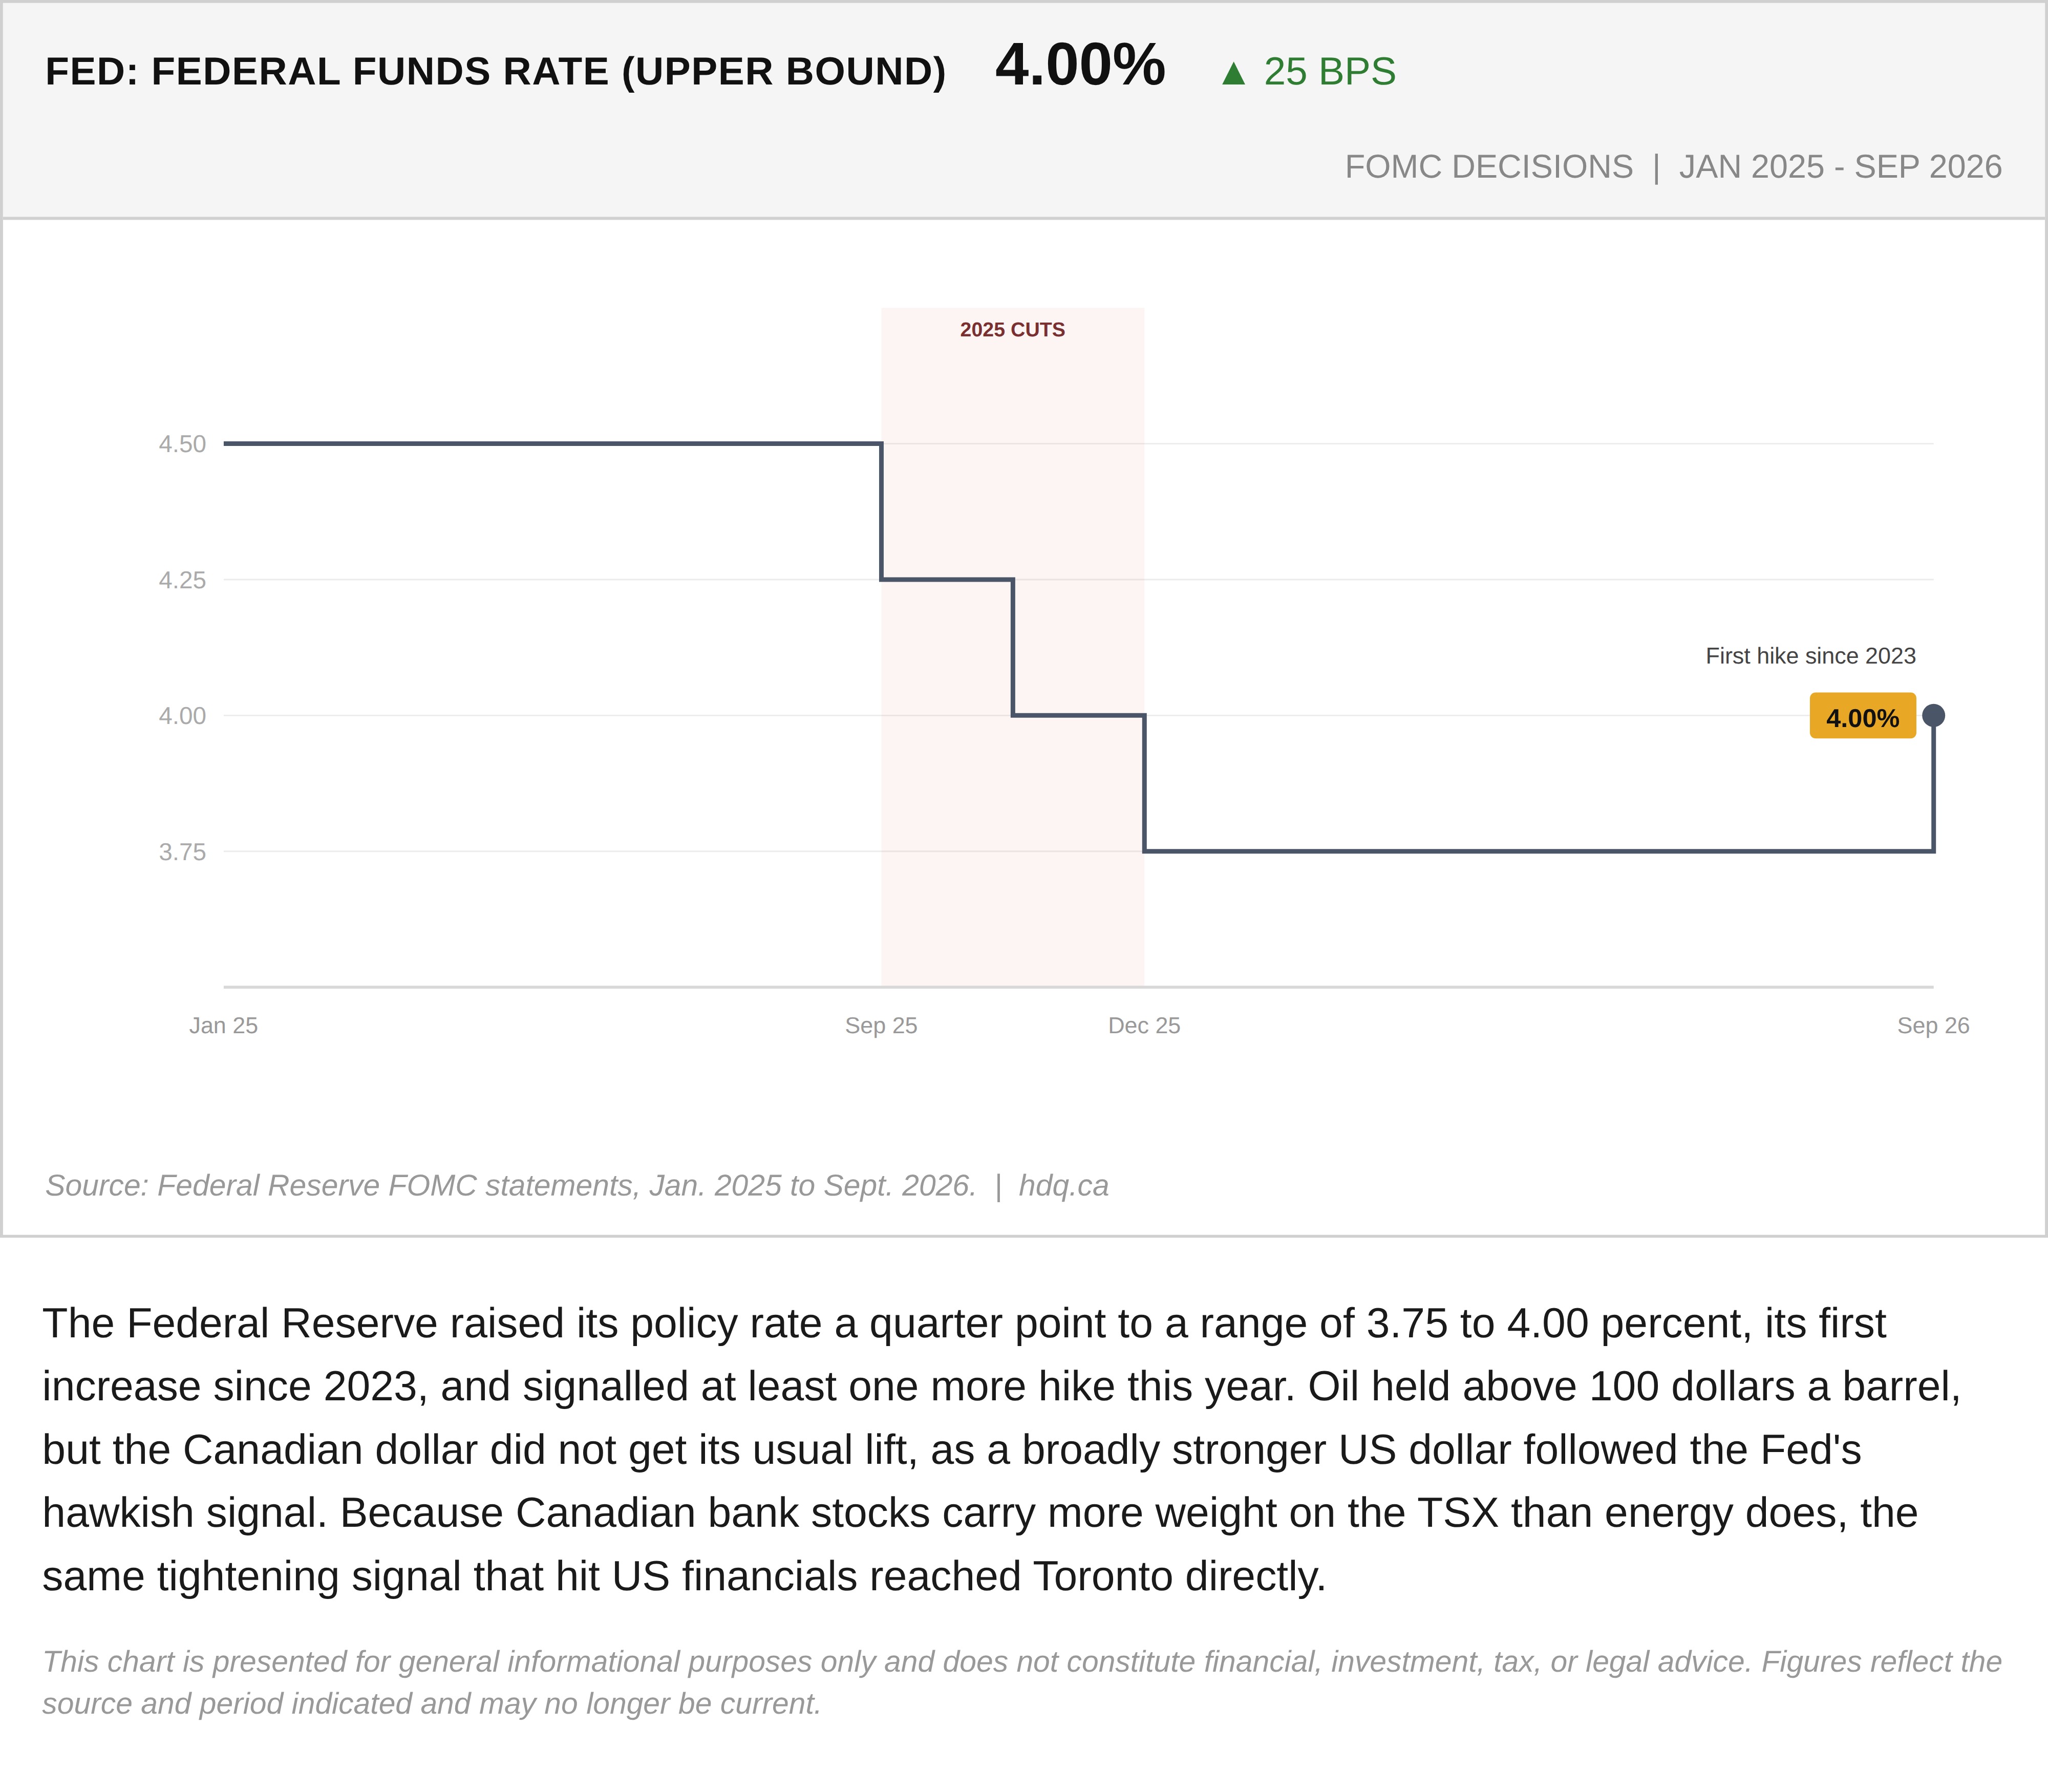
The Federal Reserve raised its policy rate a quarter point to a range of 3.75 to 4.00 percent, its first increase since 2023, and signalled at least one more hike this year. Oil held above 100 dollars a barrel, but the Canadian dollar did not get its usual lift, as a broadly stronger US dollar followed the Fed's hawkish signal. Because Canadian bank stocks carry more weight on the TSX than energy does, the same tightening signal that hit US financials reached Toronto directly.
This chart is presented for general informational purposes only and does not constitute financial, investment, tax, or legal advice. Figures reflect the source and period indicated and may no longer be current.
Related charts
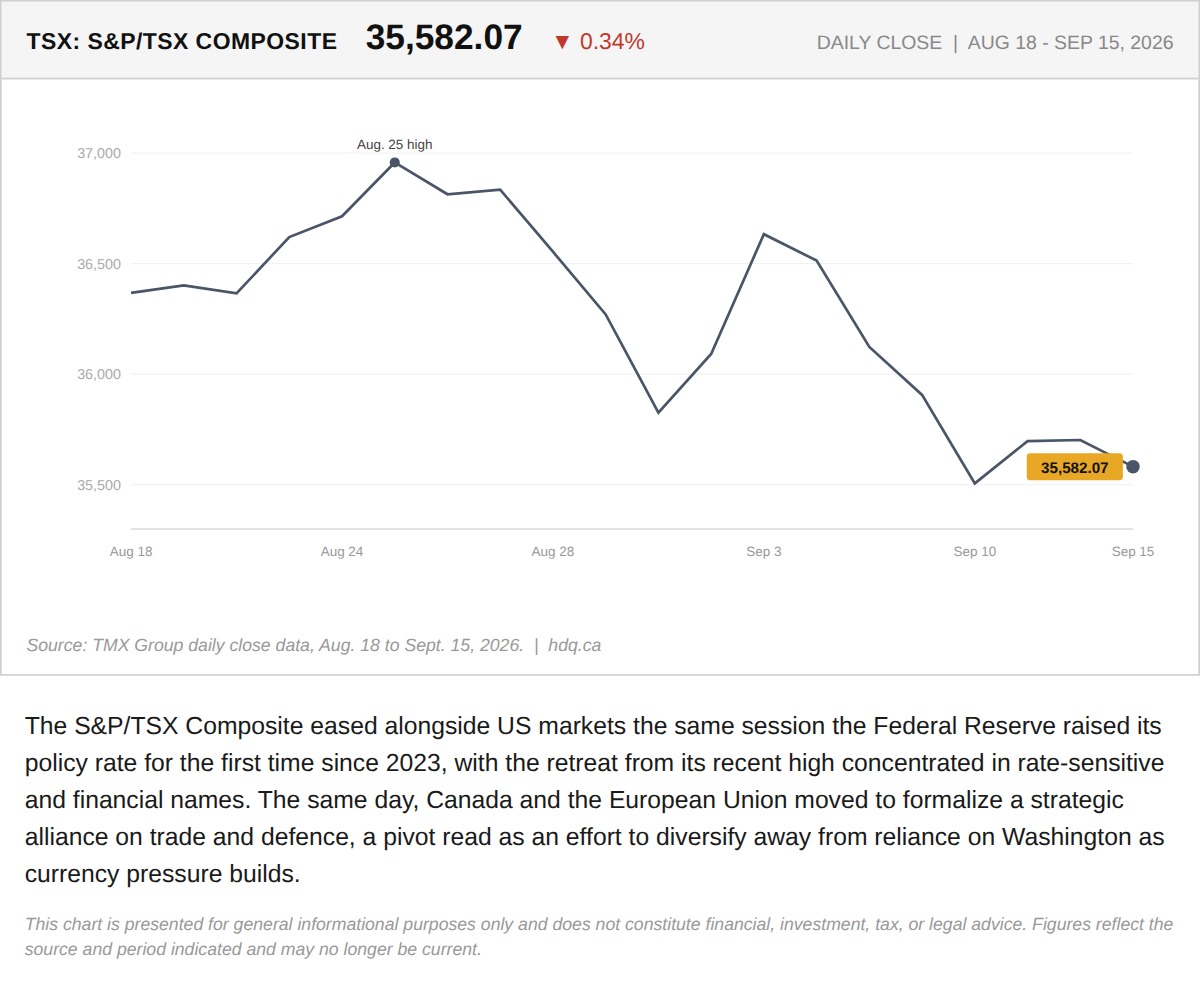
The S&P/TSX Composite eased alongside US markets the same session the Federal Reserve raised its policy rate for the first time since 2023,…
The Fed's Hawkish Hike Broke the Loonie's Oil Shield the Same Day Ottawa Leaned on Europe
September 16, 2026
View chart & download
The S&P/TSX Composite closed July at 35,226, up 1.06% for the month, a modest headline figure that conceals sharp intra-month swings.
S&P/TSX Composite closes July up 1.06% after a volatile month
July 31, 2026
View chart & download
Brent and WTI crude both surged in July, with WTI ending the month at $85.47, up 23.0%, after round-tripping from a five-month low near $68.74.
WTI and Brent crude surge in July as the Iran ceasefire collapses
July 31, 2026
View chart & download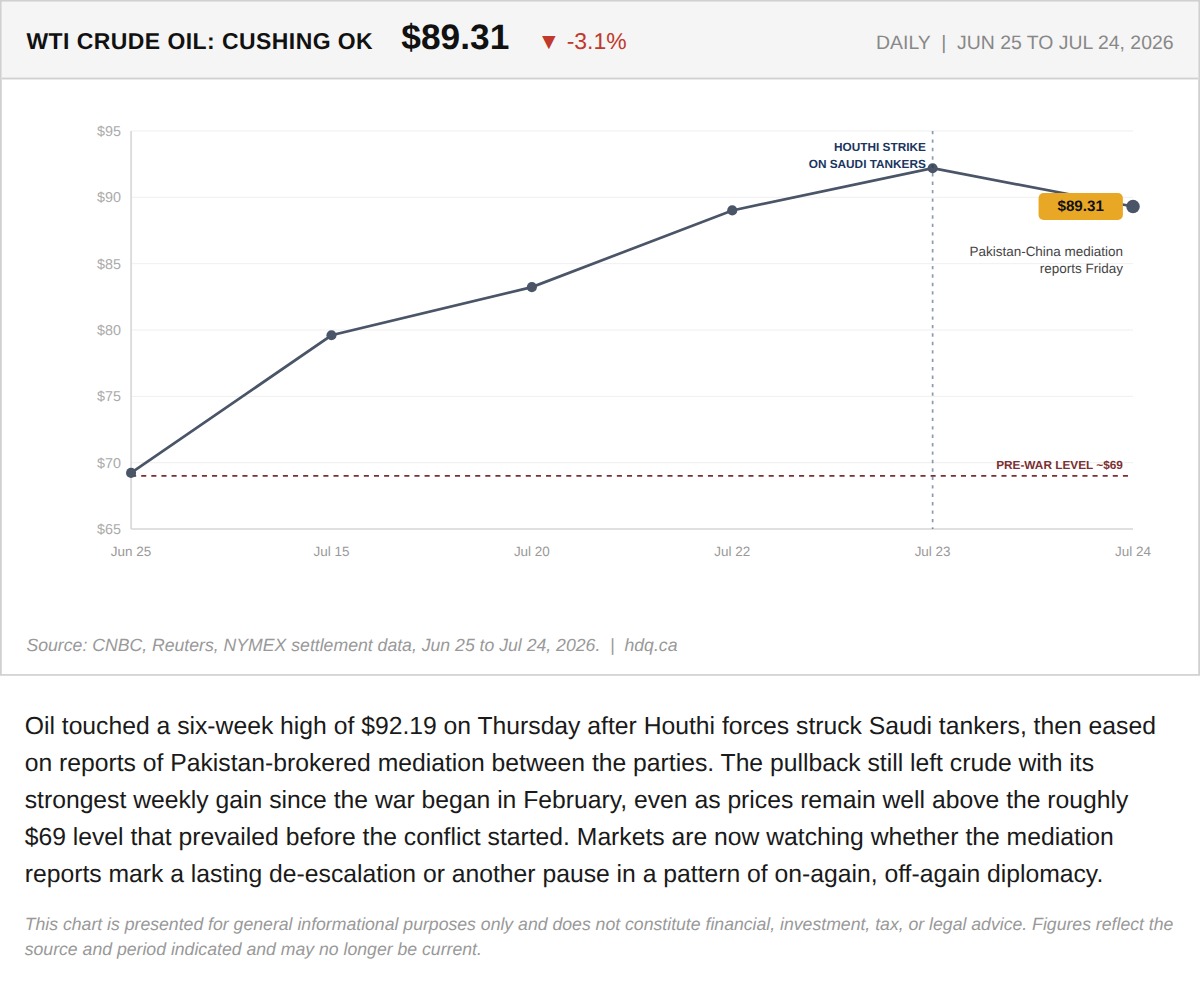
Oil touched a six-week high of $92.19 on Thursday after Houthi forces struck Saudi tankers, then eased on reports of Pakistan-brokered mediation between the parties.
Oil Pulls Back to $89.31 After Six-Week High on Mediation Reports
July 25, 2026
View chart & download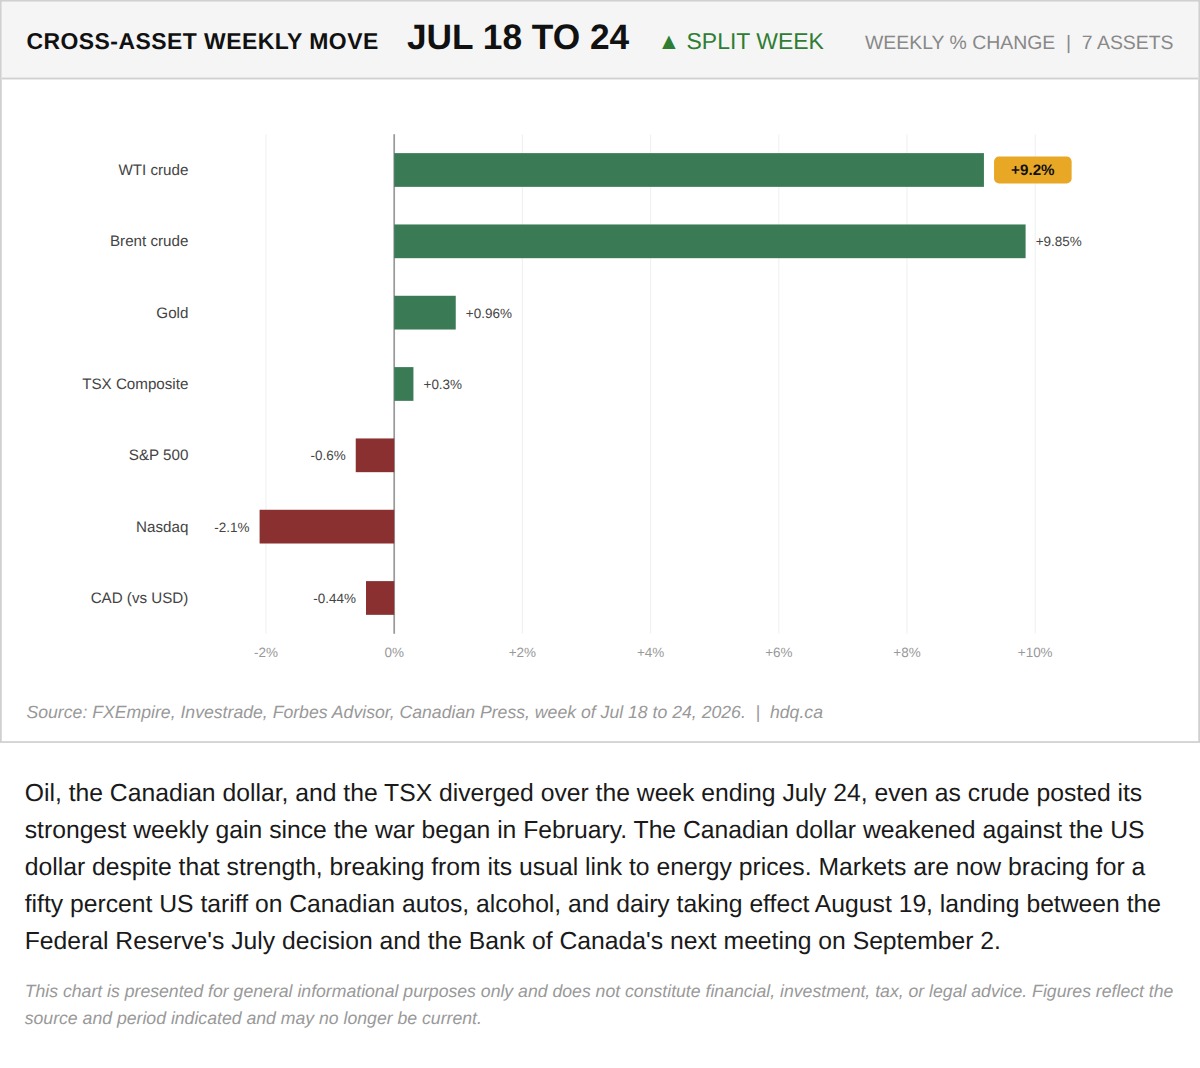
Oil, the Canadian dollar, and the TSX diverged over the week ending July 24, even as crude posted its strongest weekly gain since the war began in February.
Cross-Asset Weekly Moves: Oil Rallies, Loonie Falls Anyway
July 25, 2026
View chart & download
Brent was the only one of the three to finish above its starting level, while the index and gold both fell.
Brent, TSX and Gold Rebased to the August 31 Close
September 30, 2026
View chart & download