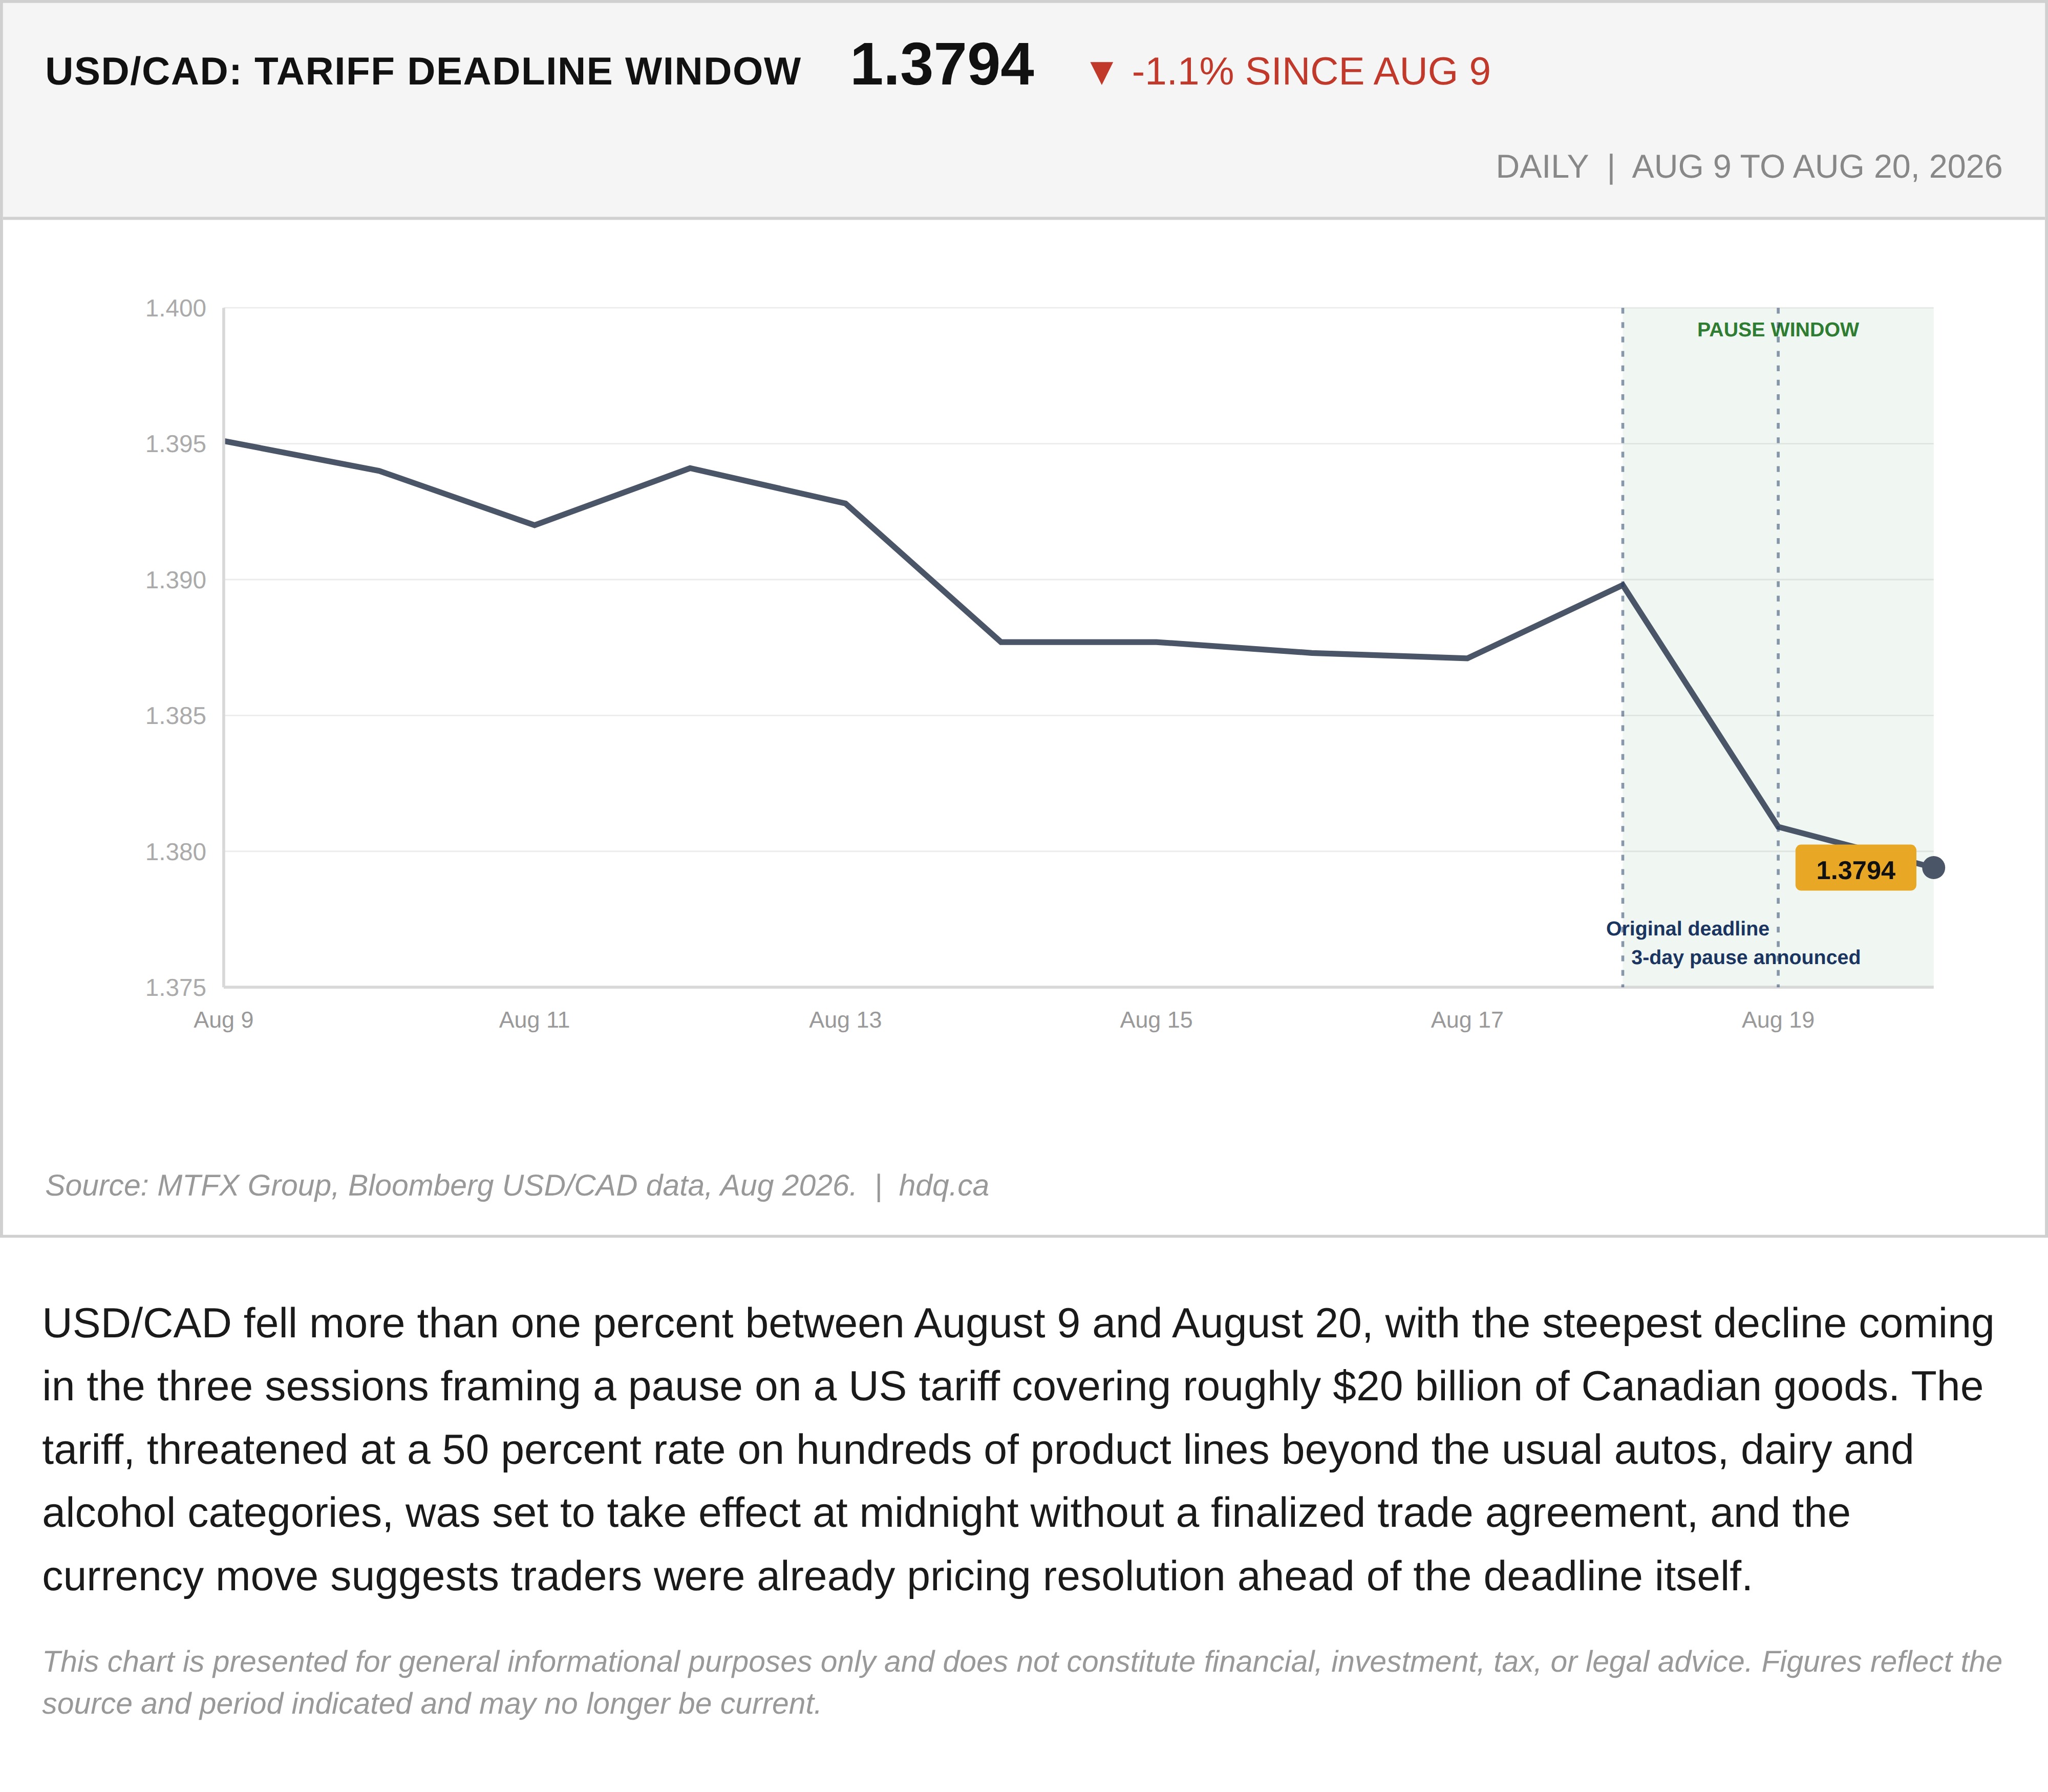
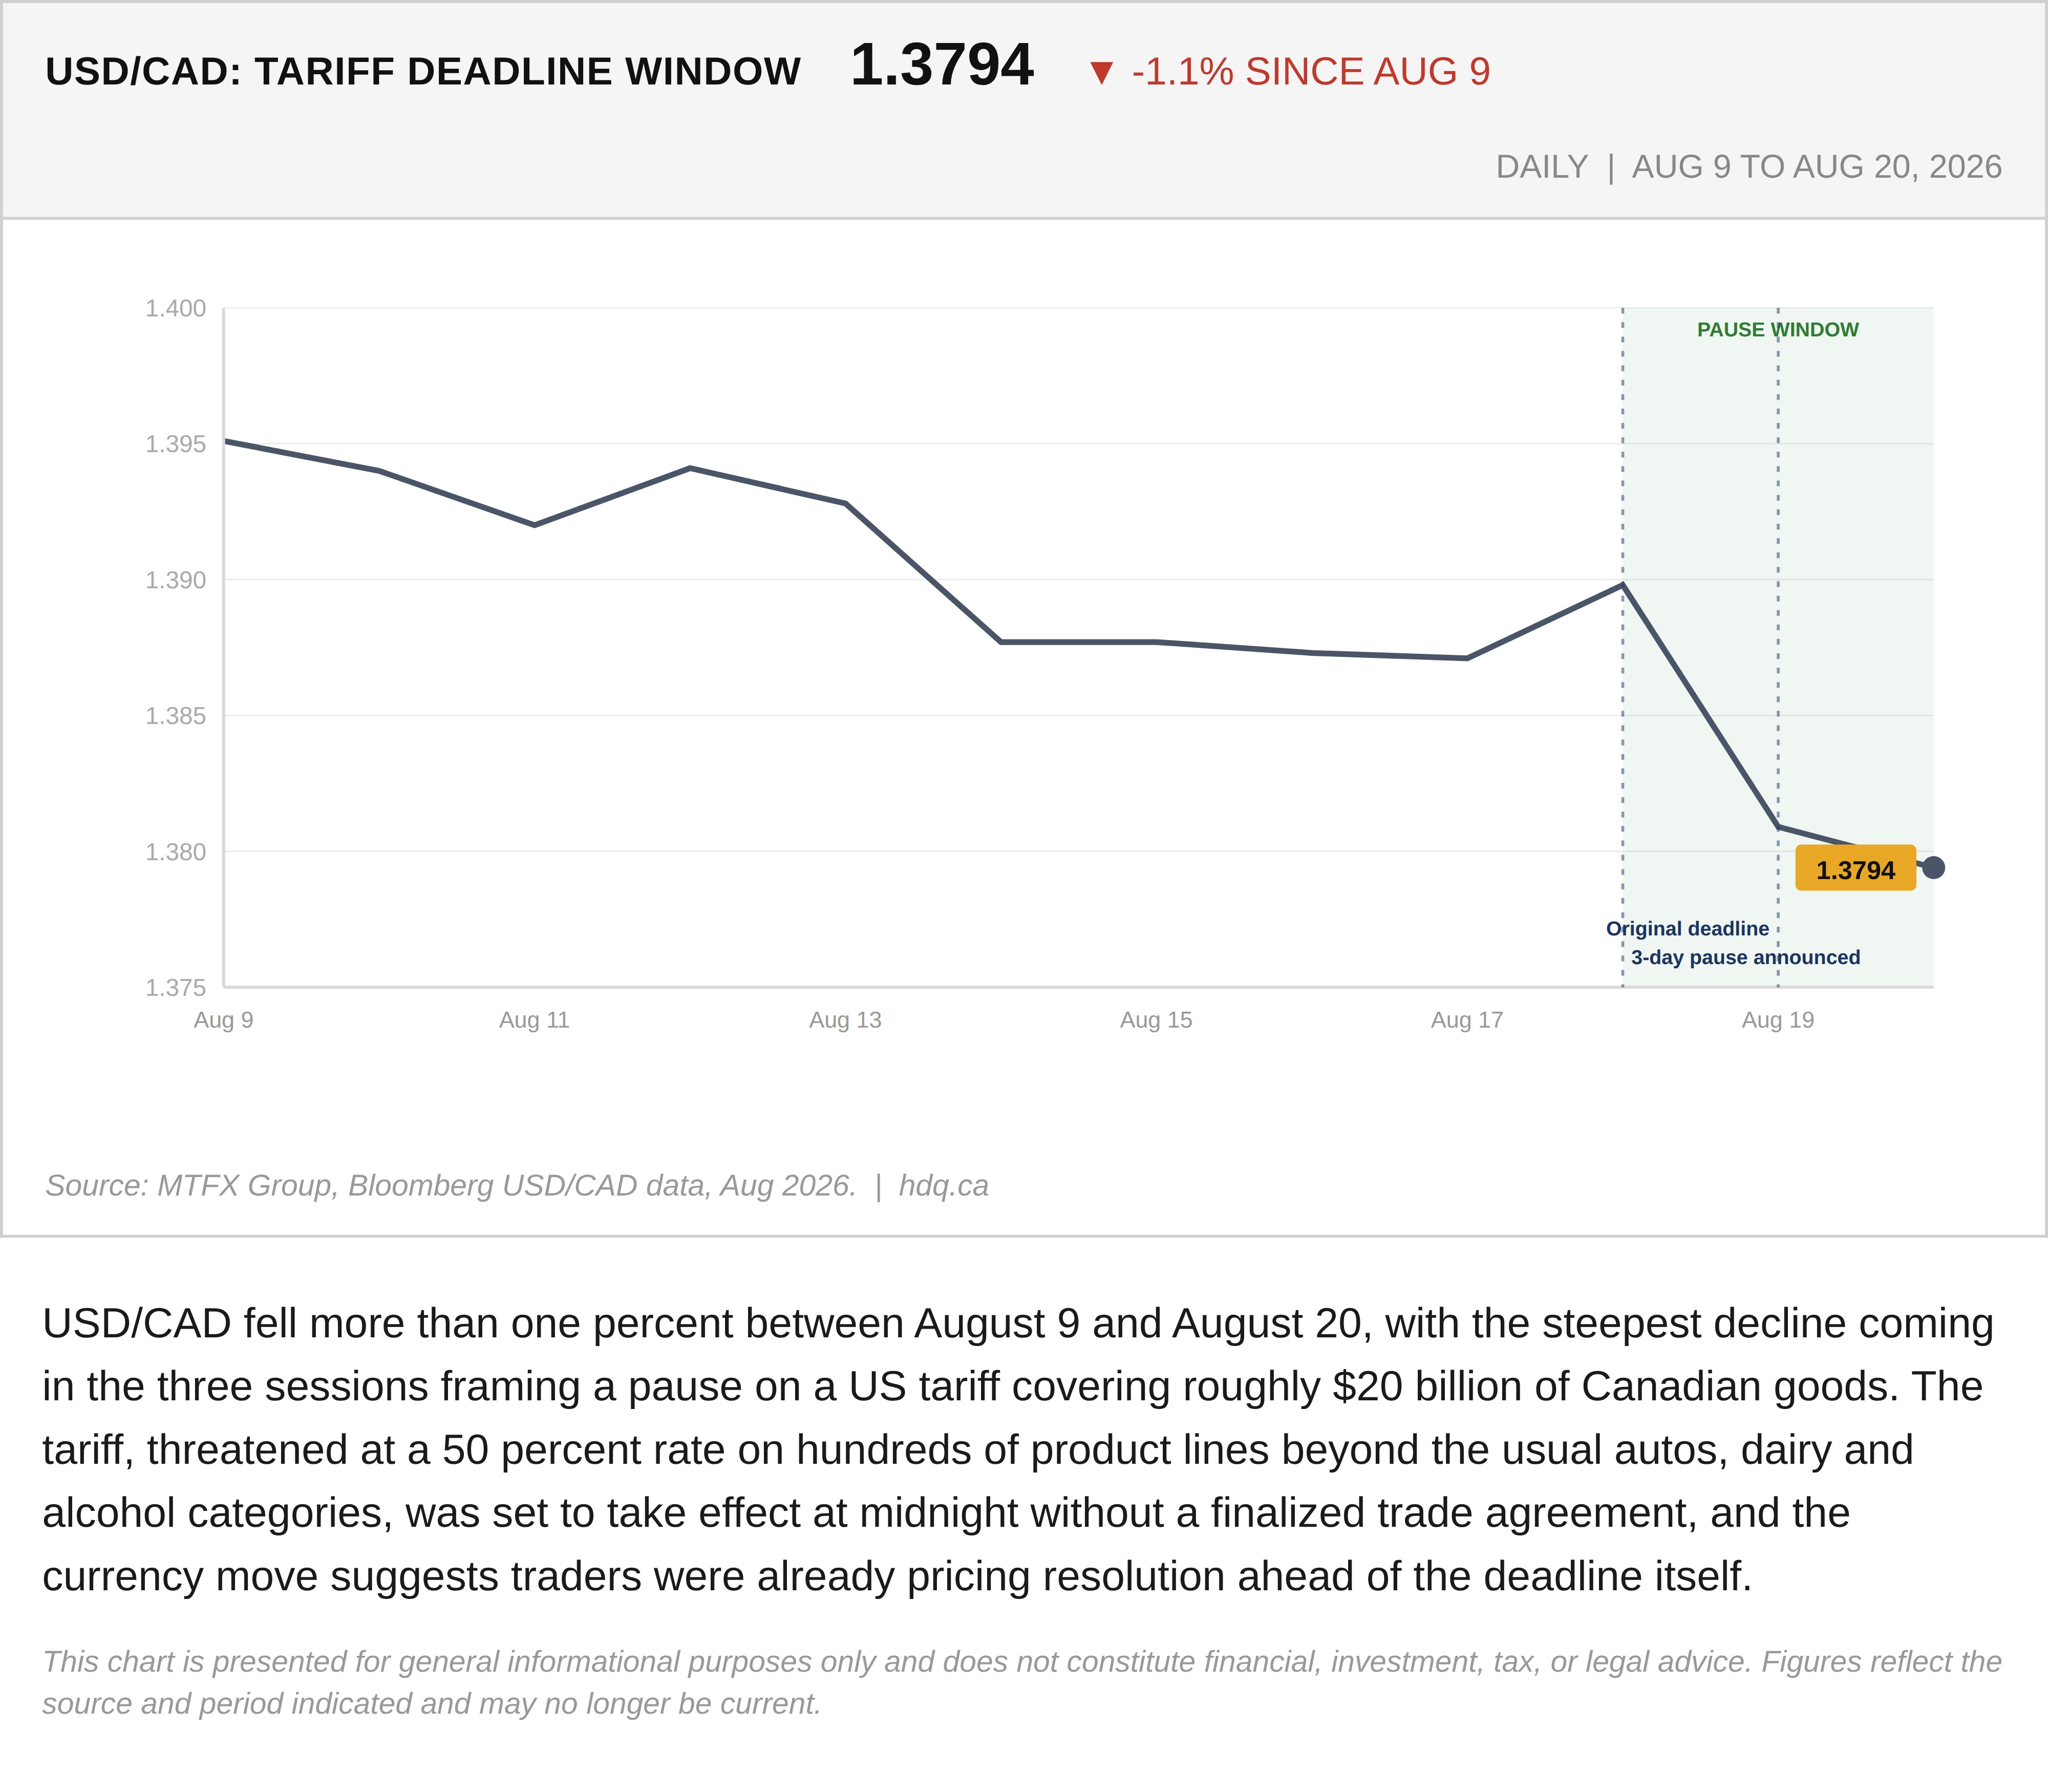
USD/CAD fell more than one percent between August 9 and August 20, with the steepest decline coming in the three sessions framing a pause on a US tariff covering roughly $20 billion of Canadian goods. The tariff, threatened at a 50 percent rate on hundreds of product lines beyond the usual autos, dairy and alcohol categories, was set to take effect at midnight without a finalized trade agreement, and the currency move suggests traders were already pricing resolution ahead of the deadline itself.
This chart is presented for general informational purposes only and does not constitute financial, investment, tax, or legal advice. Figures reflect the source and period indicated and may no longer be current.
Related charts
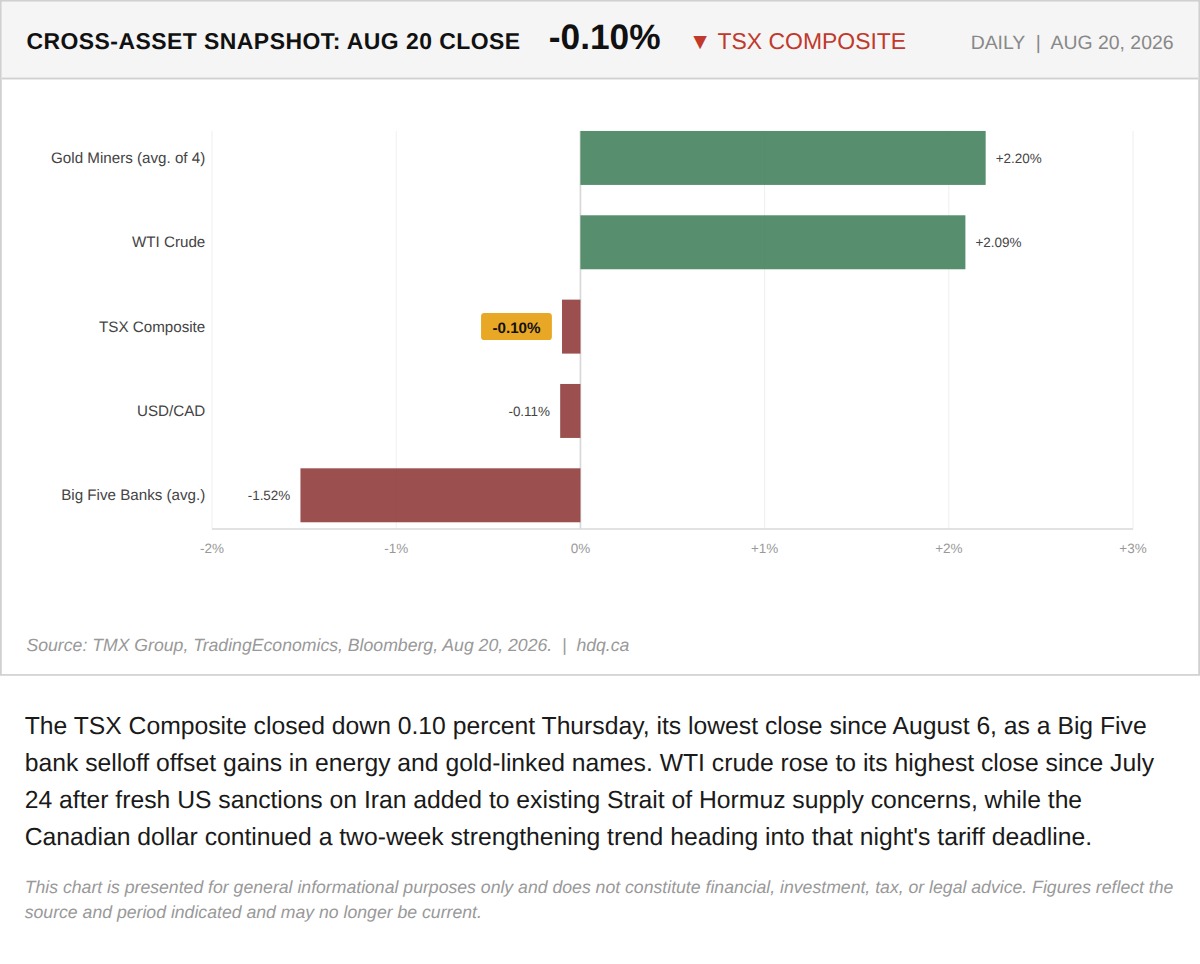
The TSX Composite closed down 0.10 percent Thursday, its lowest close since August 6, as a Big Five bank selloff offset gains in energy and gold-linked names.
TSX Closes Flat as Bank Selloff Offsets Energy and Gold Gains
August 21, 2026
View chart & download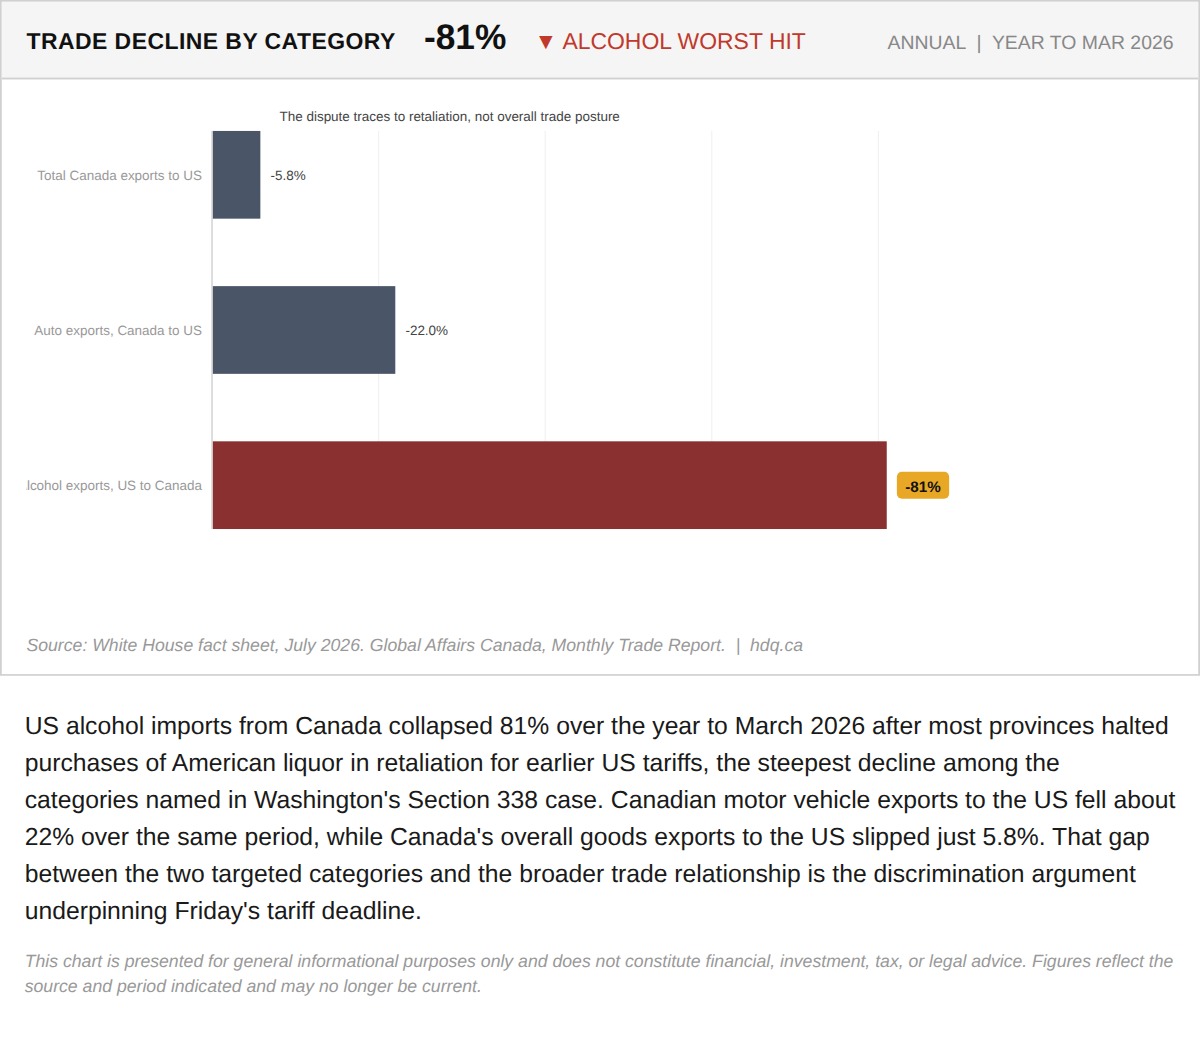
US alcohol imports from Canada collapsed 81% over the year to March 2026 after most provinces halted purchases of American liquor in…
The Two Retaliation Numbers Behind Section 338, and What Carney Has to Give Up by Friday
August 19, 2026
View chart & download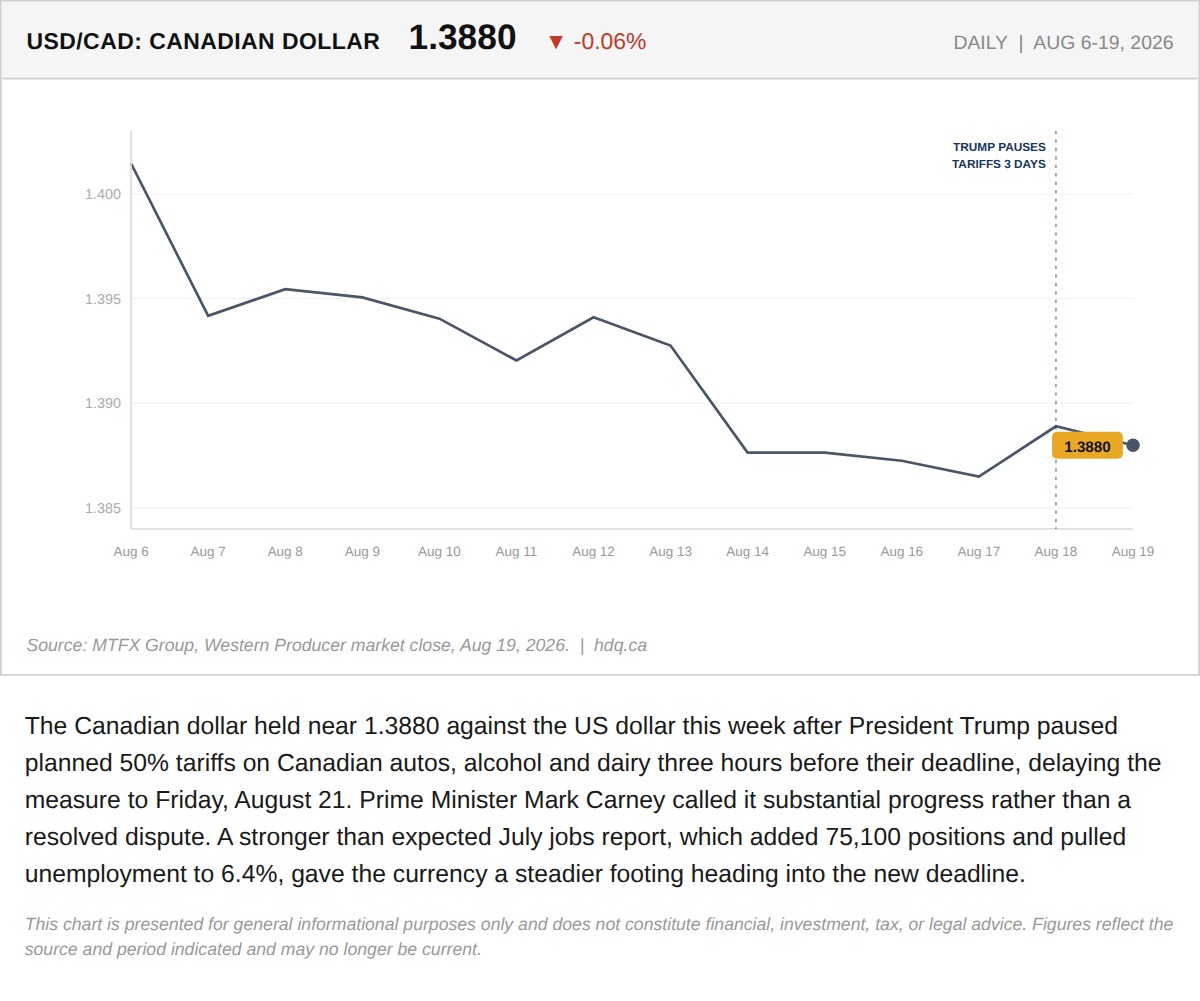
The Canadian dollar held near 1.3880 against the US dollar this week after President Trump paused planned 50% tariffs on Canadian autos,…
The Certainty Effect Is Doing the Heavy Lifting in This Morning's Tariff Relief Rally
August 19, 2026
View chart & download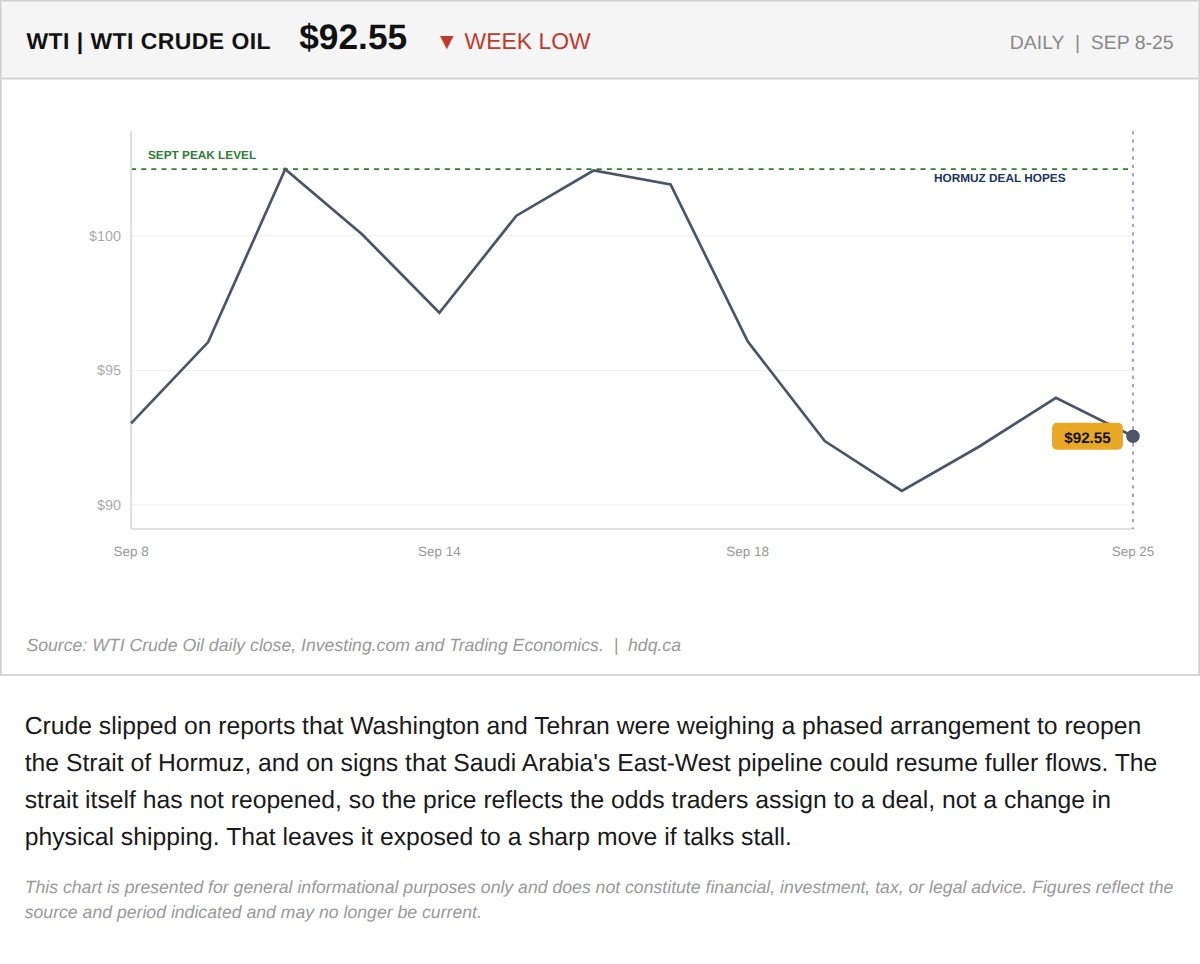
Crude slipped on reports that Washington and Tehran were weighing a phased arrangement to reopen the Strait of Hormuz, and on signs that…
WTI Crude Slips to a Weekly Low on Hormuz Deal Reports
September 25, 2026
View chart & download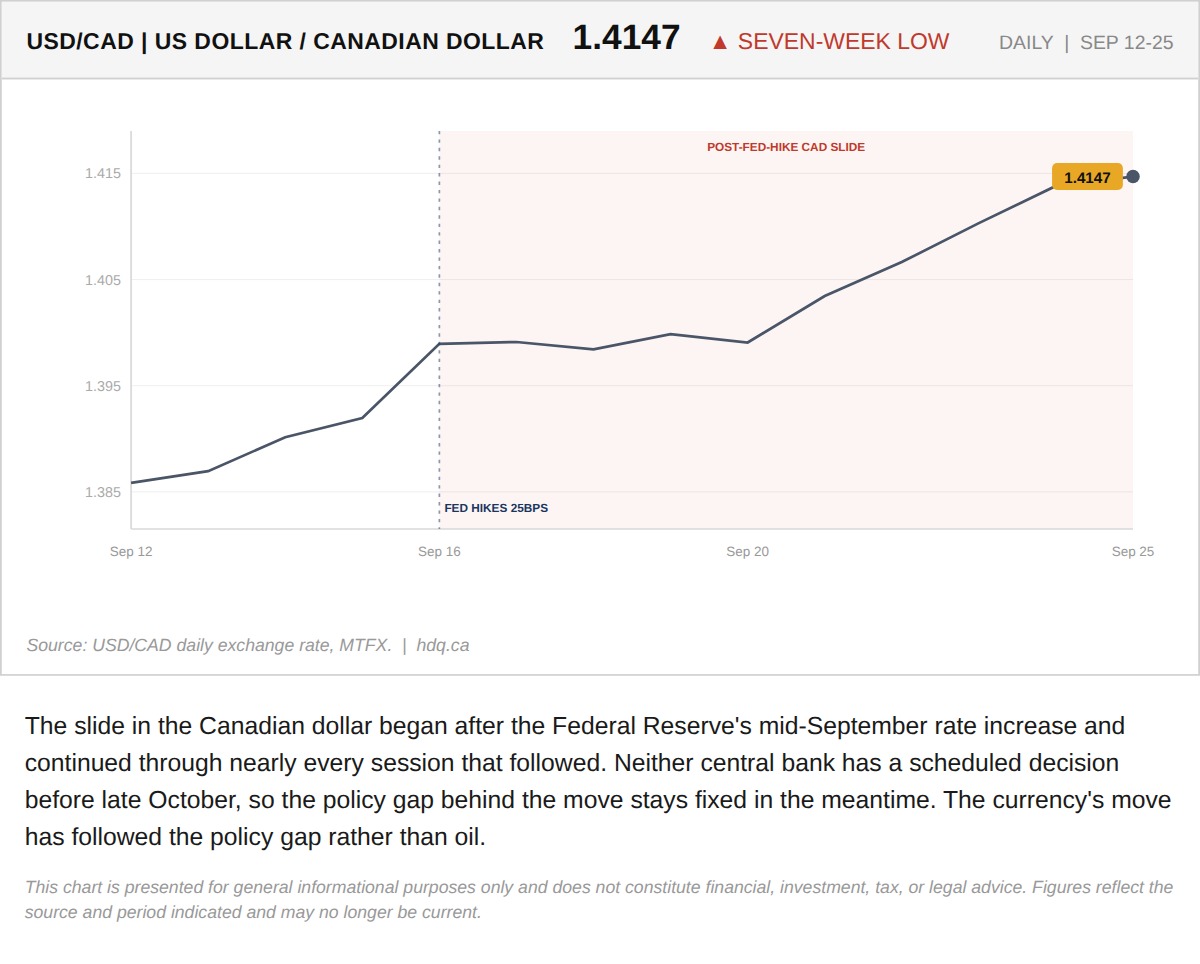
The slide in the Canadian dollar began after the Federal Reserve's mid-September rate increase and continued through nearly every session that followed.
USD/CAD Climbs to a Seven-Week High Since the Fed Hike
September 25, 2026
View chart & download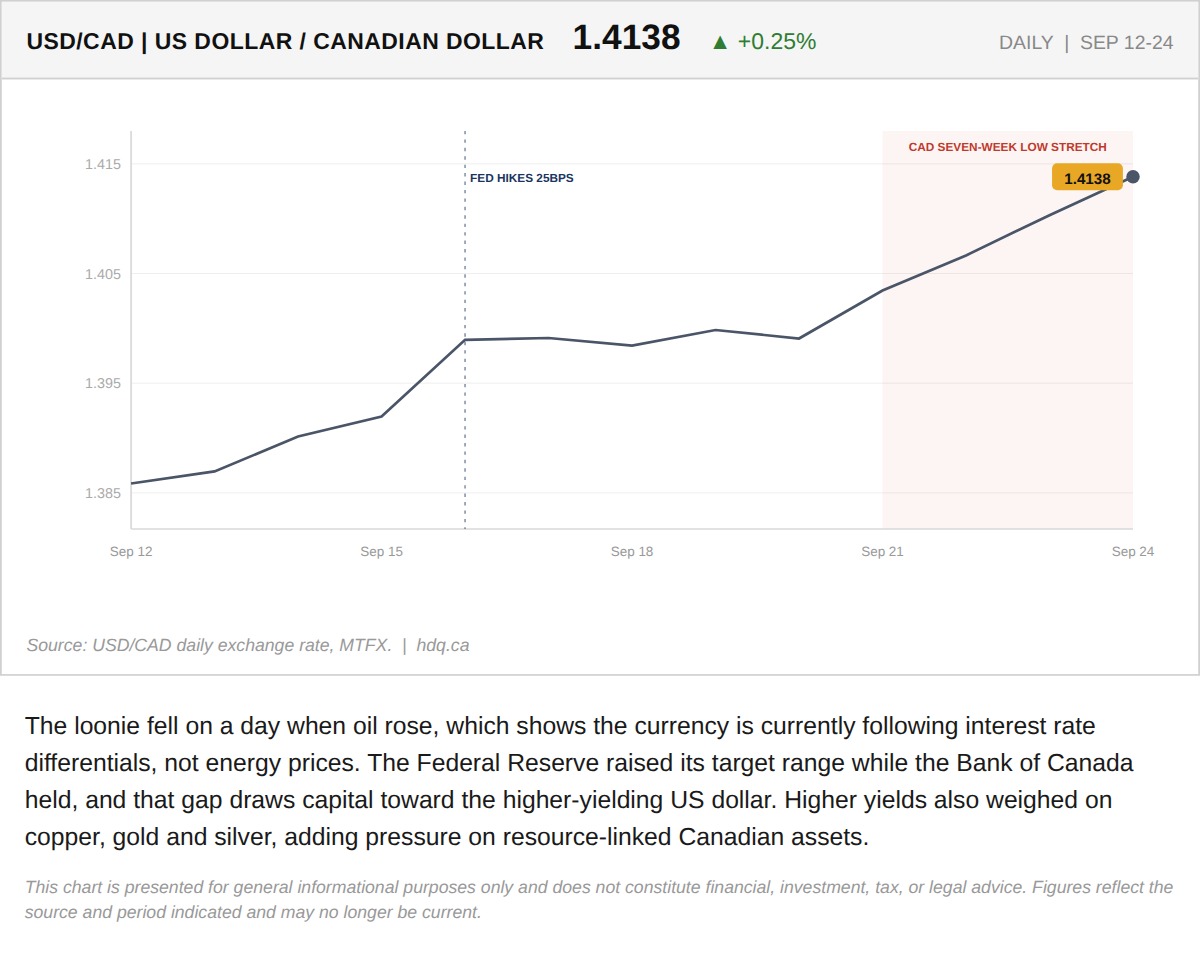
The loonie fell on a day when oil rose, which shows the currency is currently following interest rate differentials, not energy prices.
Canadian Dollar Weakens Even as Oil Rises
September 25, 2026
View chart & download