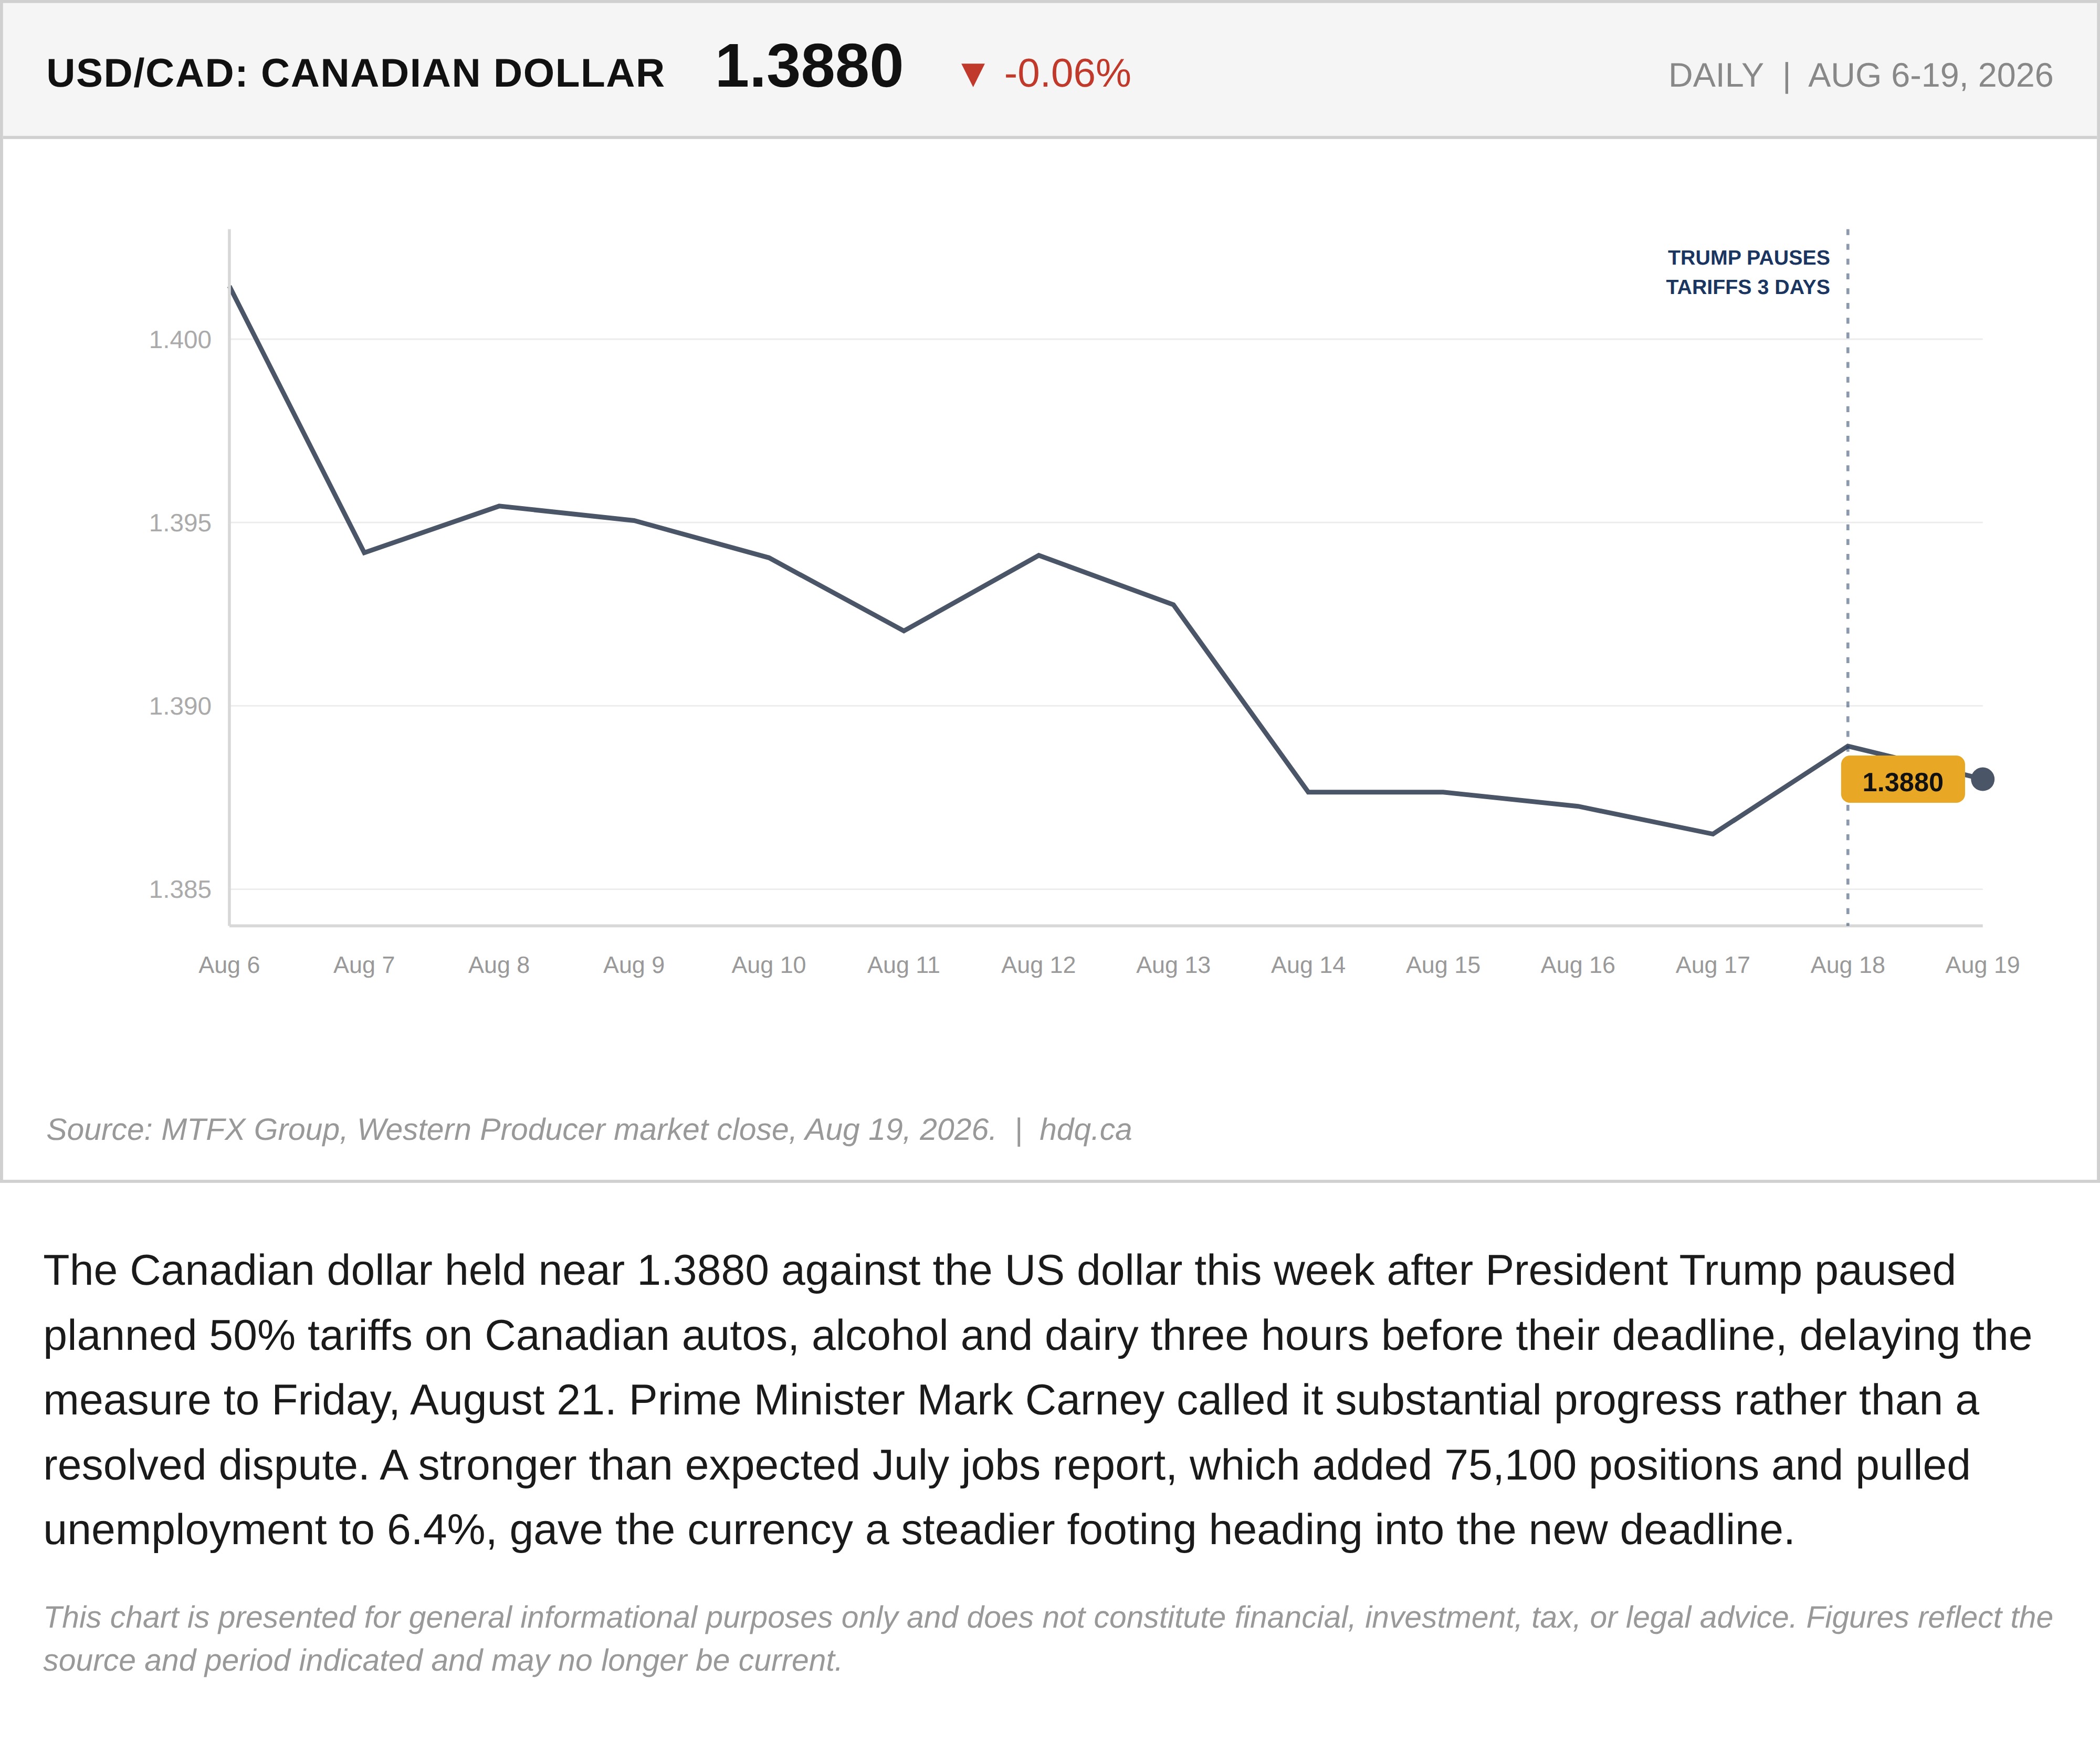
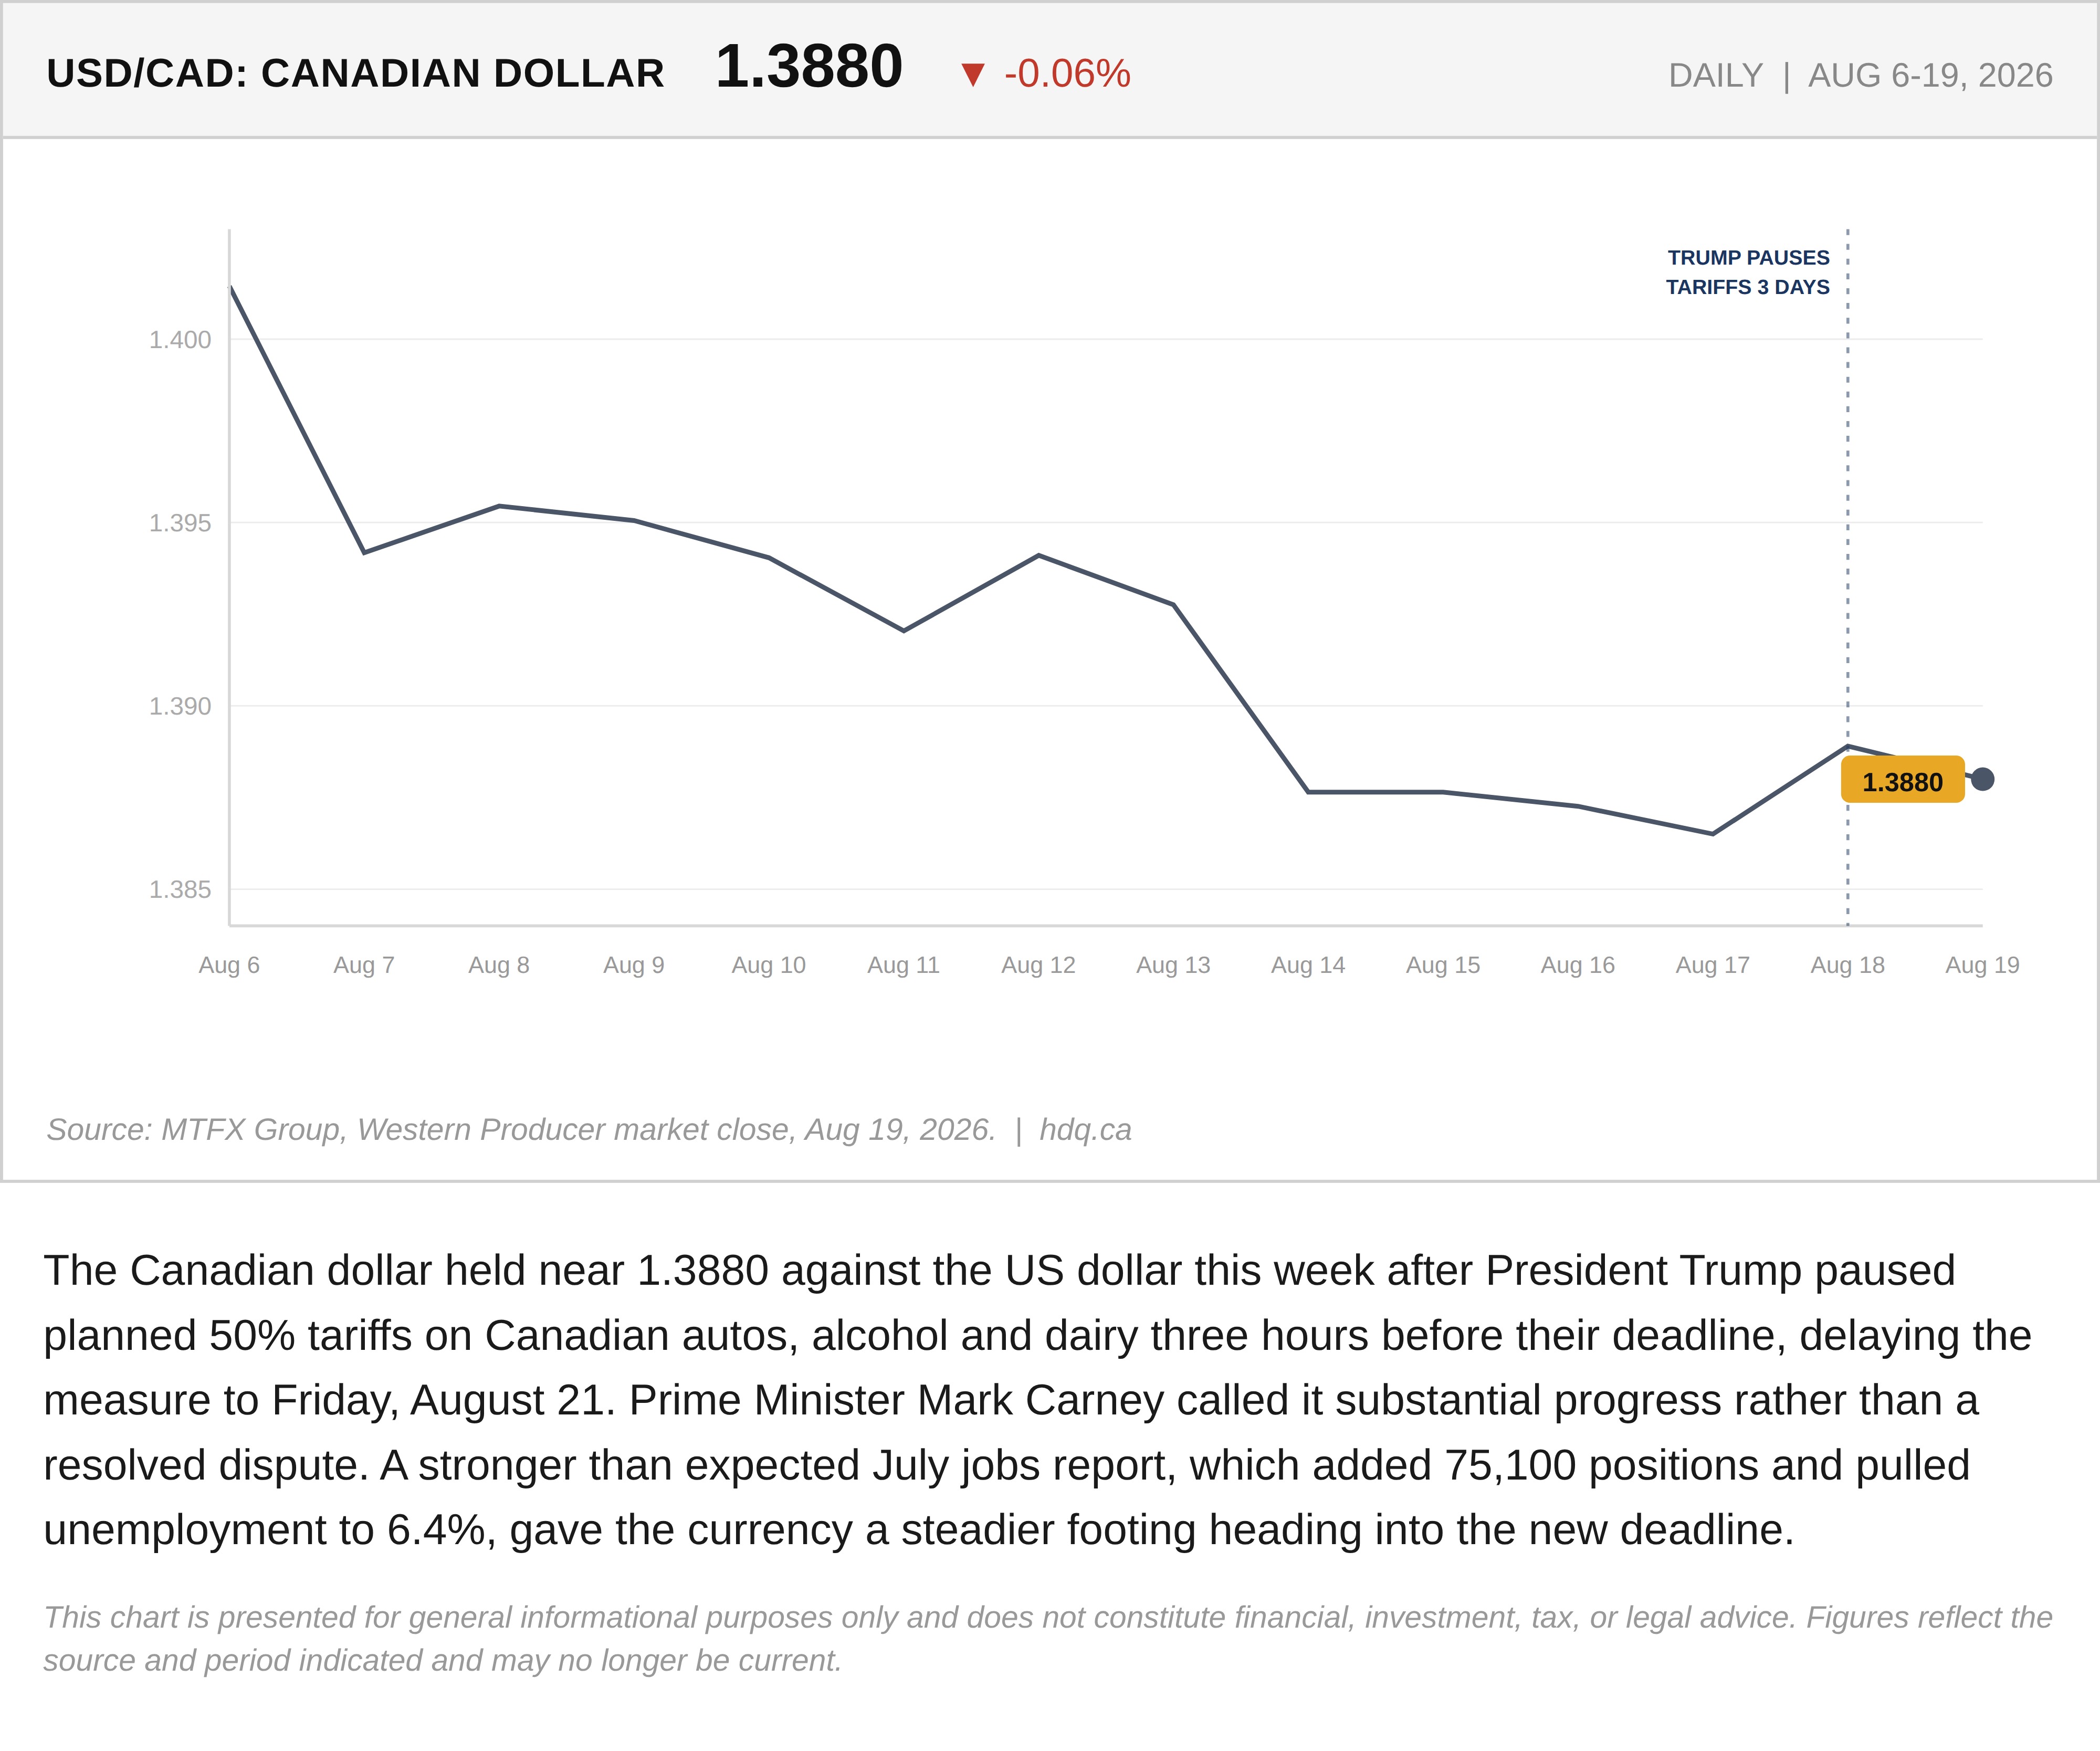
The Canadian dollar held near 1.3880 against the US dollar this week after President Trump paused planned 50% tariffs on Canadian autos, alcohol and dairy three hours before their deadline, delaying the measure to Friday, August 21. Prime Minister Mark Carney called it substantial progress rather than a resolved dispute. A stronger than expected July jobs report, which added 75,100 positions and pulled unemployment to 6.4%, gave the currency a steadier footing heading into the new deadline.
This chart is presented for general informational purposes only and does not constitute financial, investment, tax, or legal advice. Figures reflect the source and period indicated and may no longer be current.
Related charts
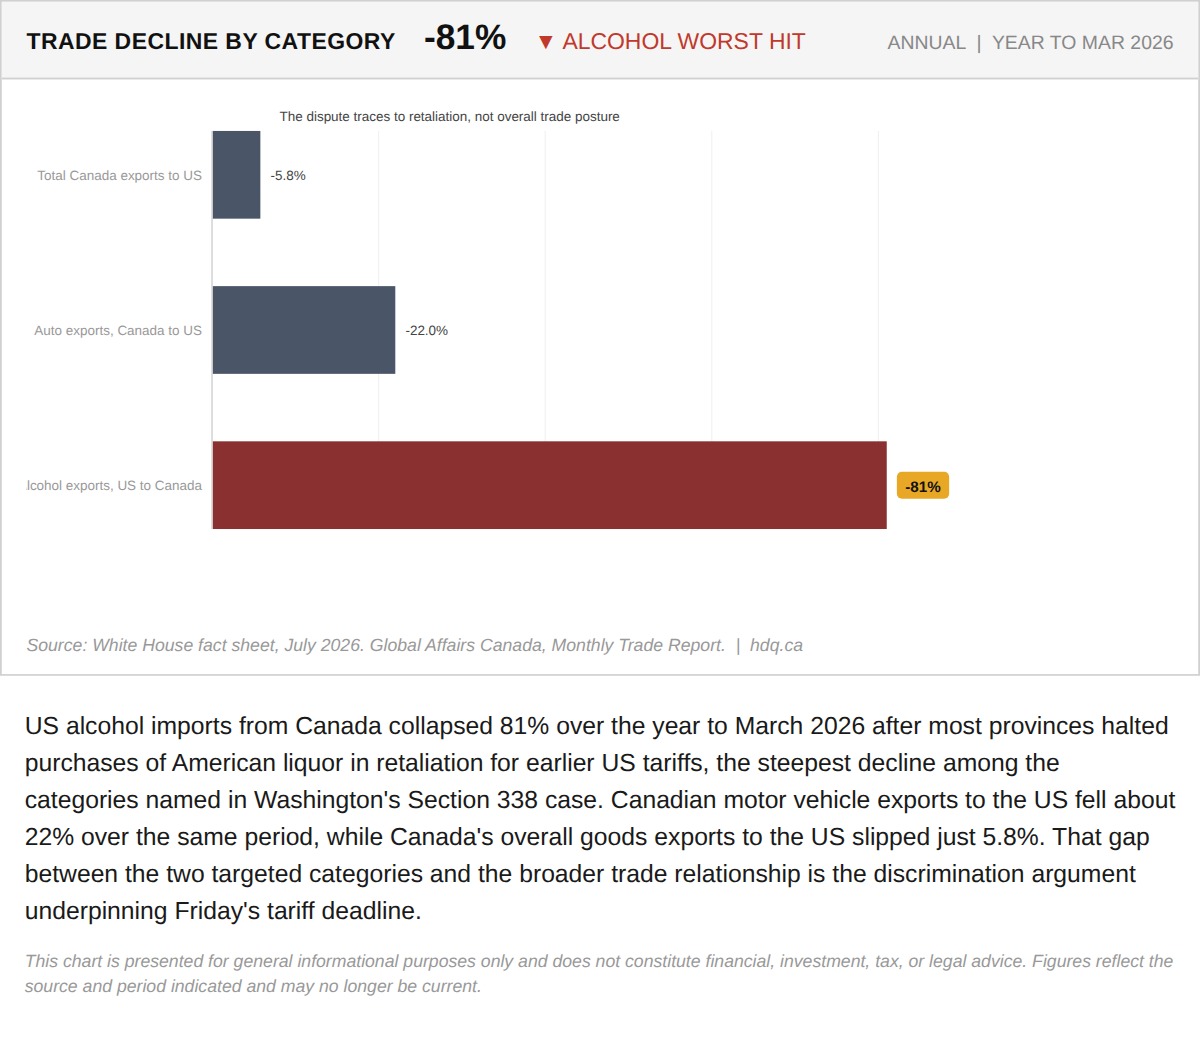
US alcohol imports from Canada collapsed 81% over the year to March 2026 after most provinces halted purchases of American liquor in…
The Two Retaliation Numbers Behind Section 338, and What Carney Has to Give Up by Friday
August 19, 2026
View chart & download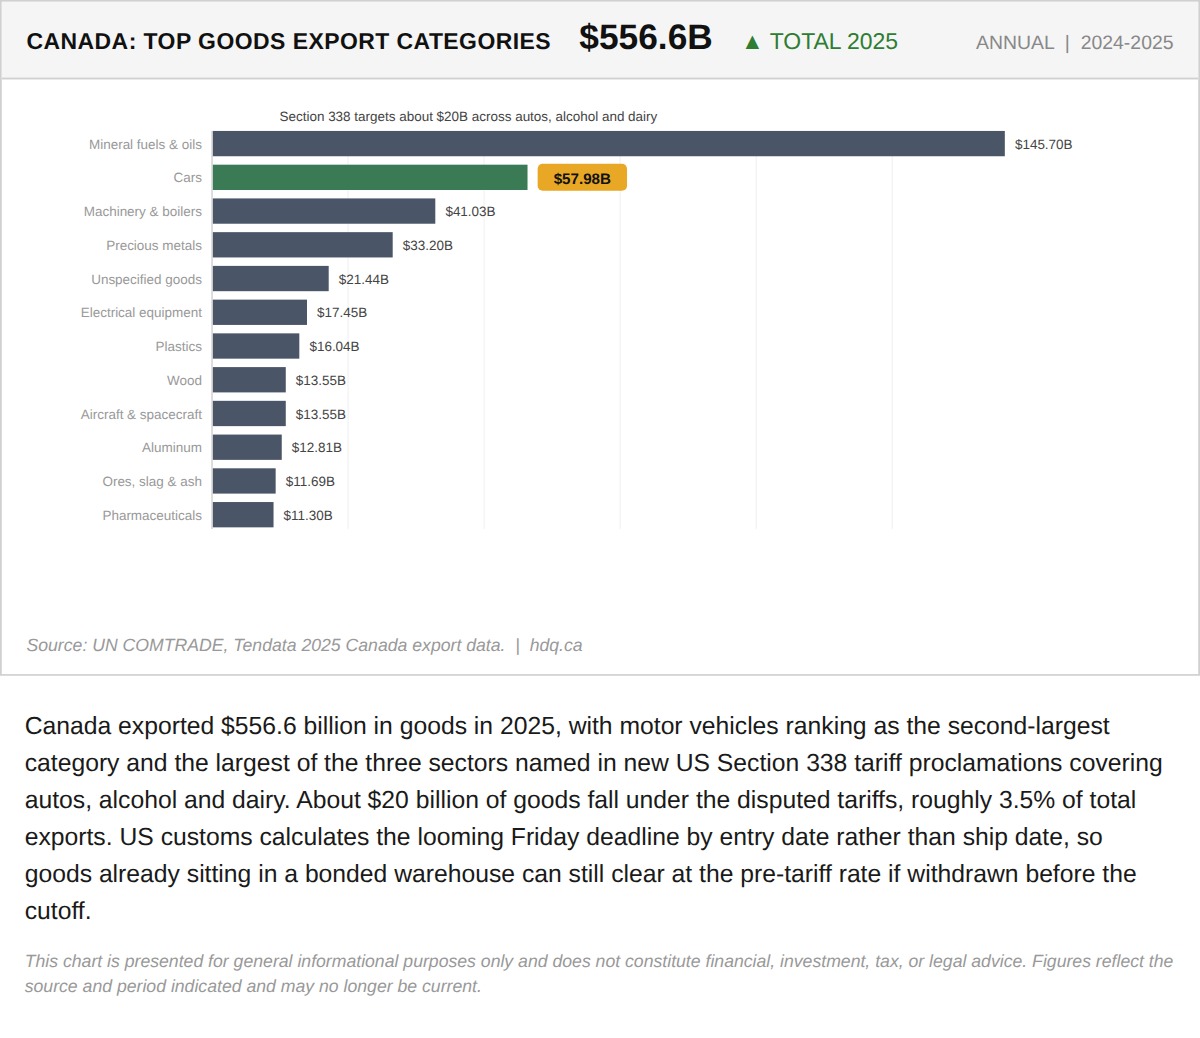
Canada exported $556.6 billion in goods in 2025, with motor vehicles ranking as the second-largest category and the largest of the three…
The Tariff Pause Is Not a Pause for Business Owner Clients With Cross-Border Supply Chains
August 19, 2026
View chart & download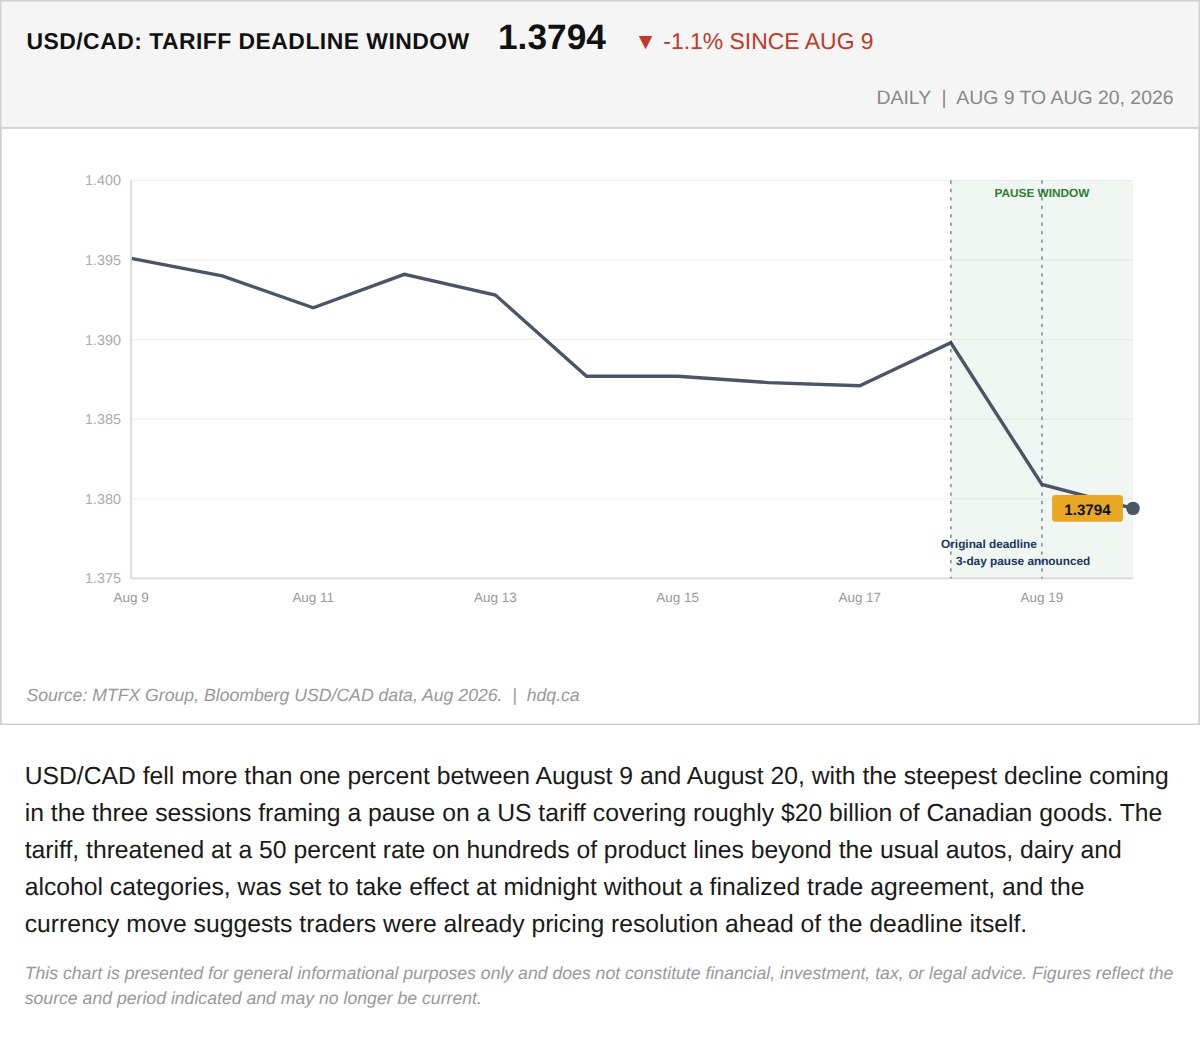
USD/CAD fell more than one percent between August 9 and August 20, with the steepest decline coming in the three sessions framing a pause…
USD/CAD Falls 1.1% as Currency Markets Price a Tariff Deal
August 21, 2026
View chart & download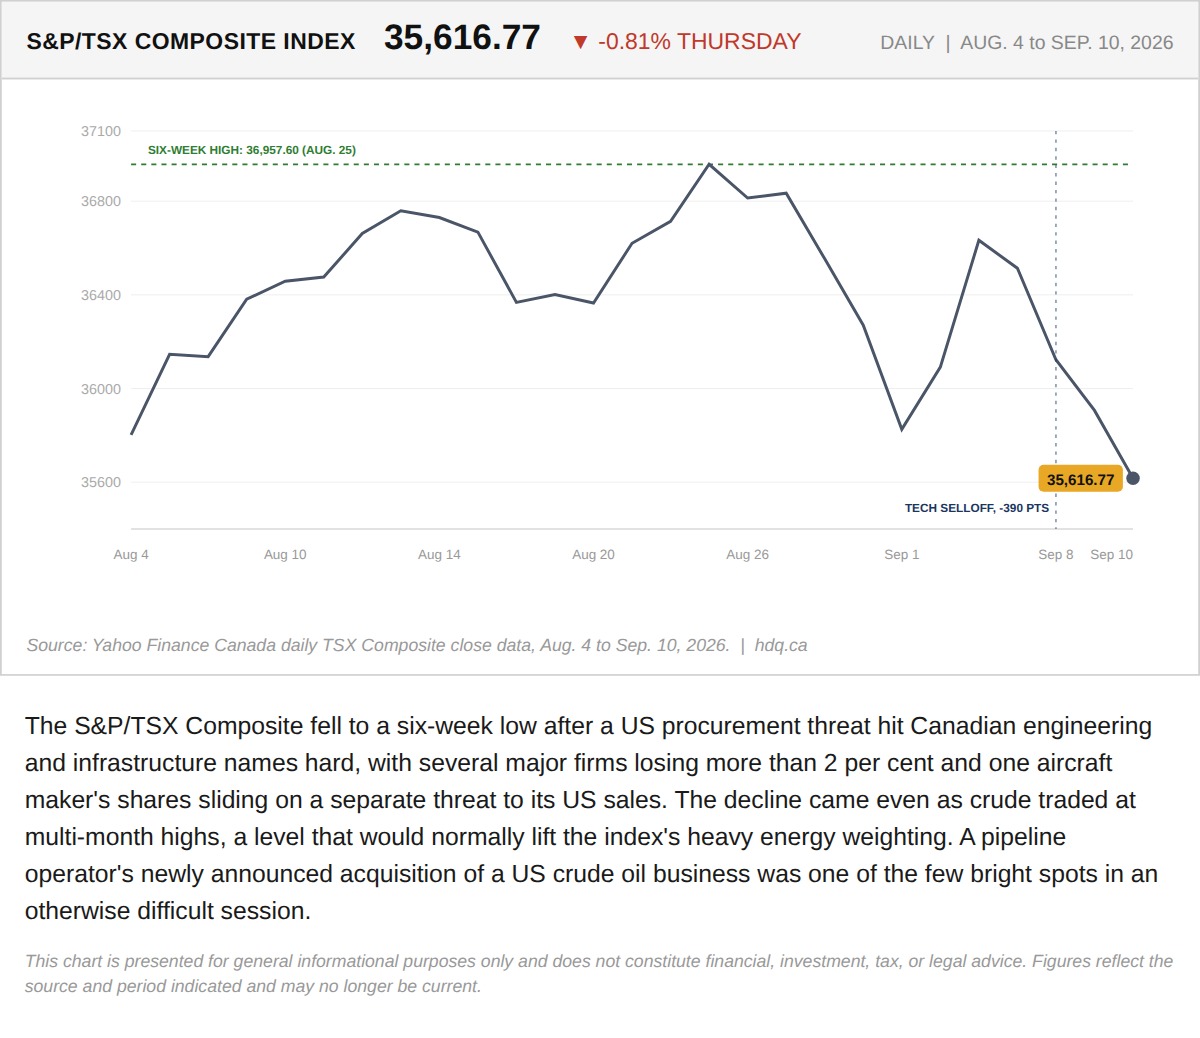
The S&P/TSX Composite fell to a six-week low after a US procurement threat hit Canadian engineering and infrastructure names hard, with…
The TSX Fell to a Six-Week Low Thursday, and Oil Above $100 Could Not Stop It
September 11, 2026
View chart & download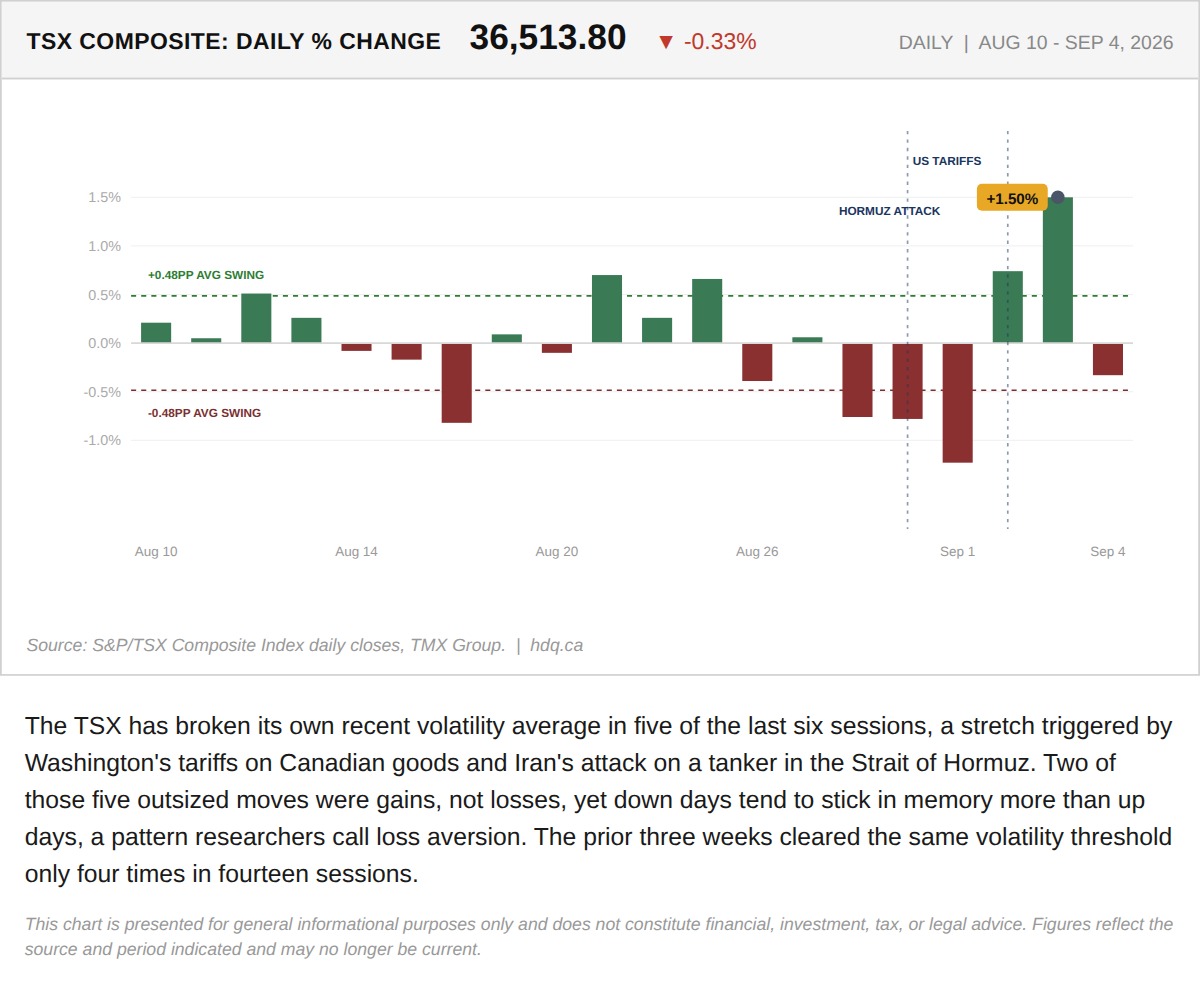
The TSX has broken its own recent volatility average in five of the last six sessions, a stretch triggered by Washington's tariffs on…
Why This Week Feels Worse Than the TSX Actually Performed
September 8, 2026
View chart & download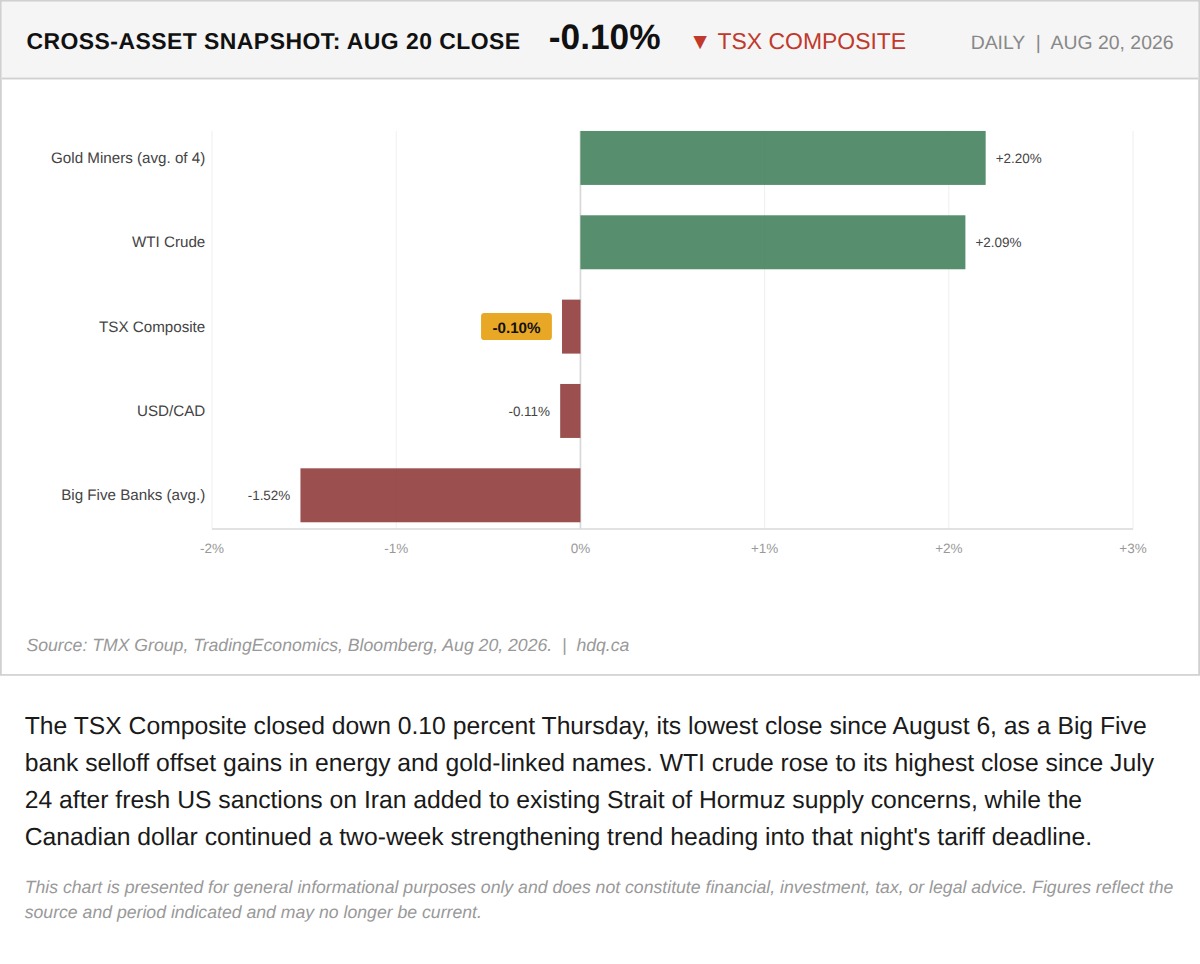
The TSX Composite closed down 0.10 percent Thursday, its lowest close since August 6, as a Big Five bank selloff offset gains in energy and gold-linked names.
TSX Closes Flat as Bank Selloff Offsets Energy and Gold Gains
August 21, 2026
View chart & download