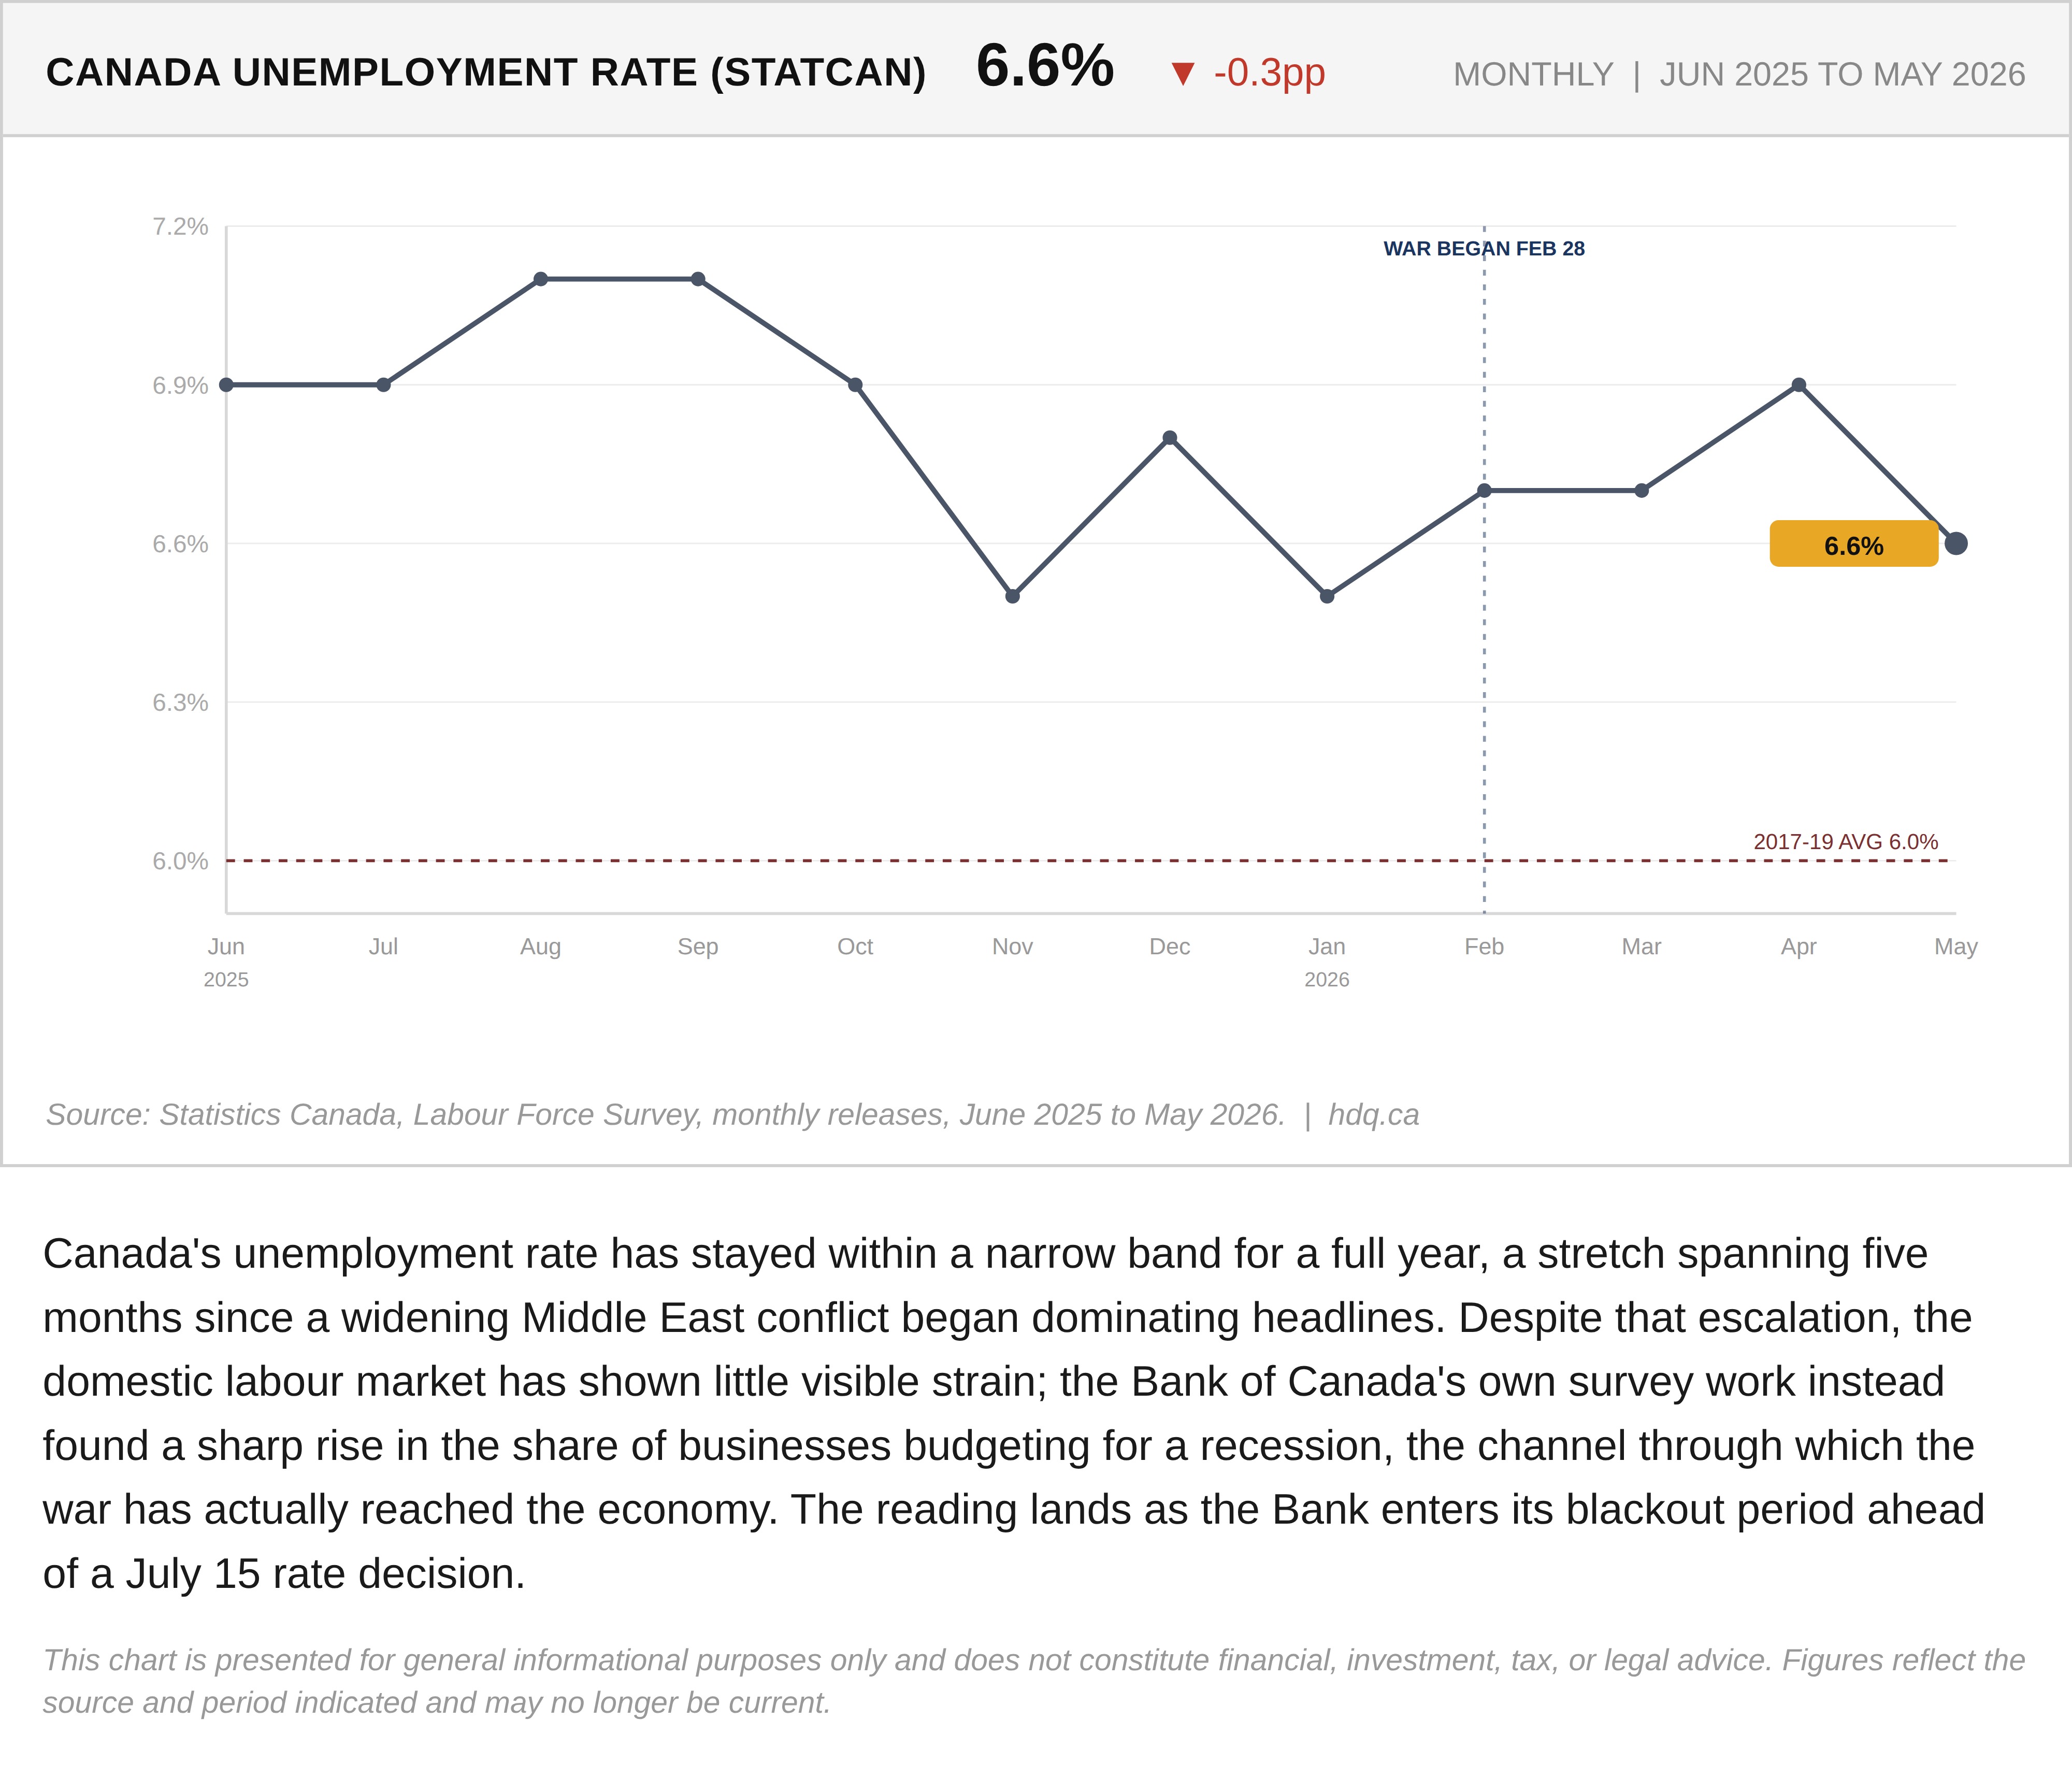
Canada's unemployment rate has stayed within a narrow band for a full year, a stretch spanning five months since a widening Middle East conflict began dominating headlines. Despite that escalation, the domestic labour market has shown little visible strain; the Bank of Canada's own survey work instead found a sharp rise in the share of businesses budgeting for a recession, the channel through which the war has actually reached the economy. The reading lands as the Bank enters its blackout period ahead of a July 15 rate decision.
This chart is presented for general informational purposes only and does not constitute financial, investment, tax, or legal advice. Figures reflect the source and period indicated and may no longer be current.

Related charts
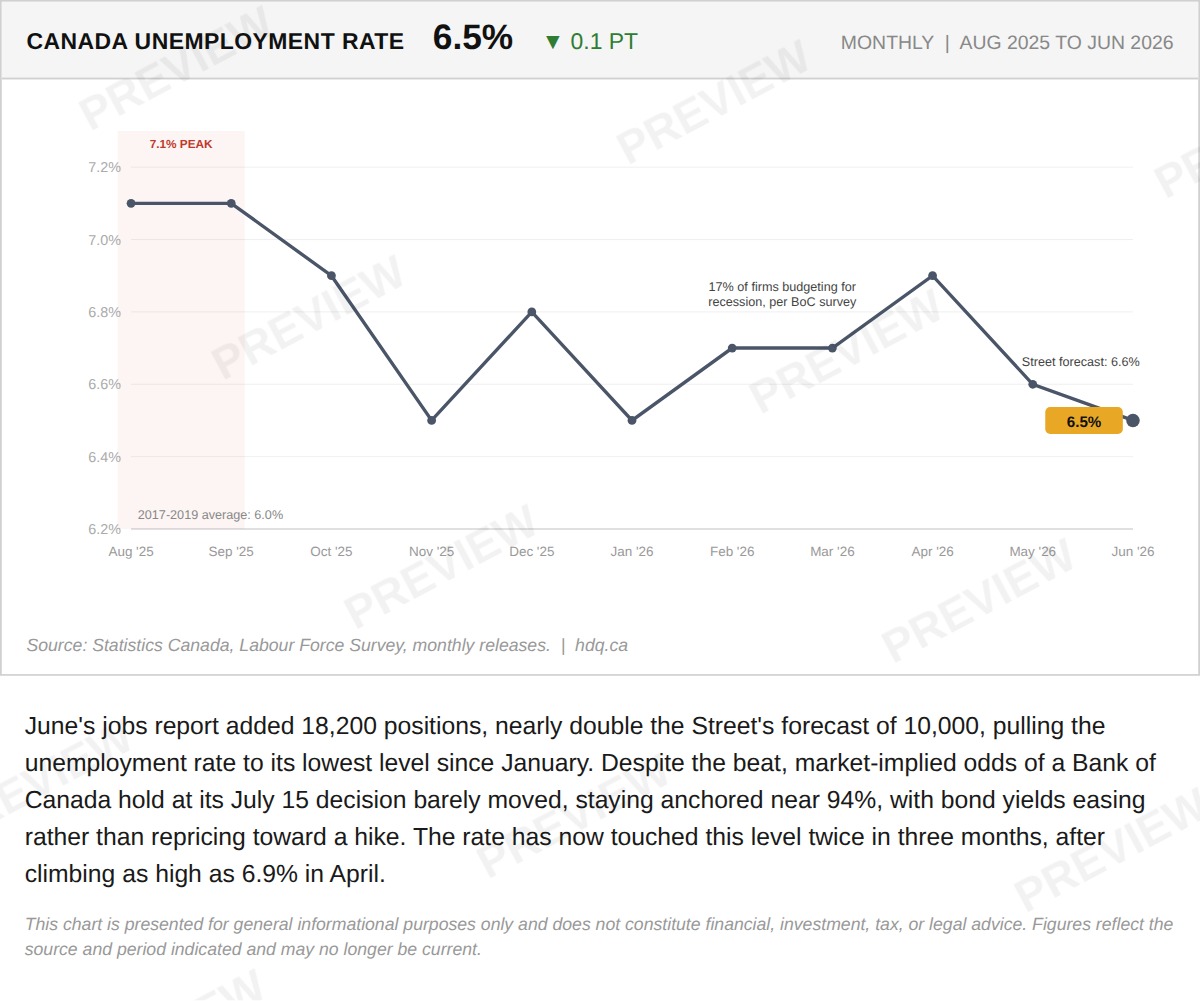
June's jobs report added 18,200 positions, nearly double the Street's forecast of 10,000, pulling the unemployment rate to its lowest level since January.
Employment Beat the Forecast by Nearly Double Today. The Bank of Canada's Path Did Not Move.
July 10, 2026
View chart & download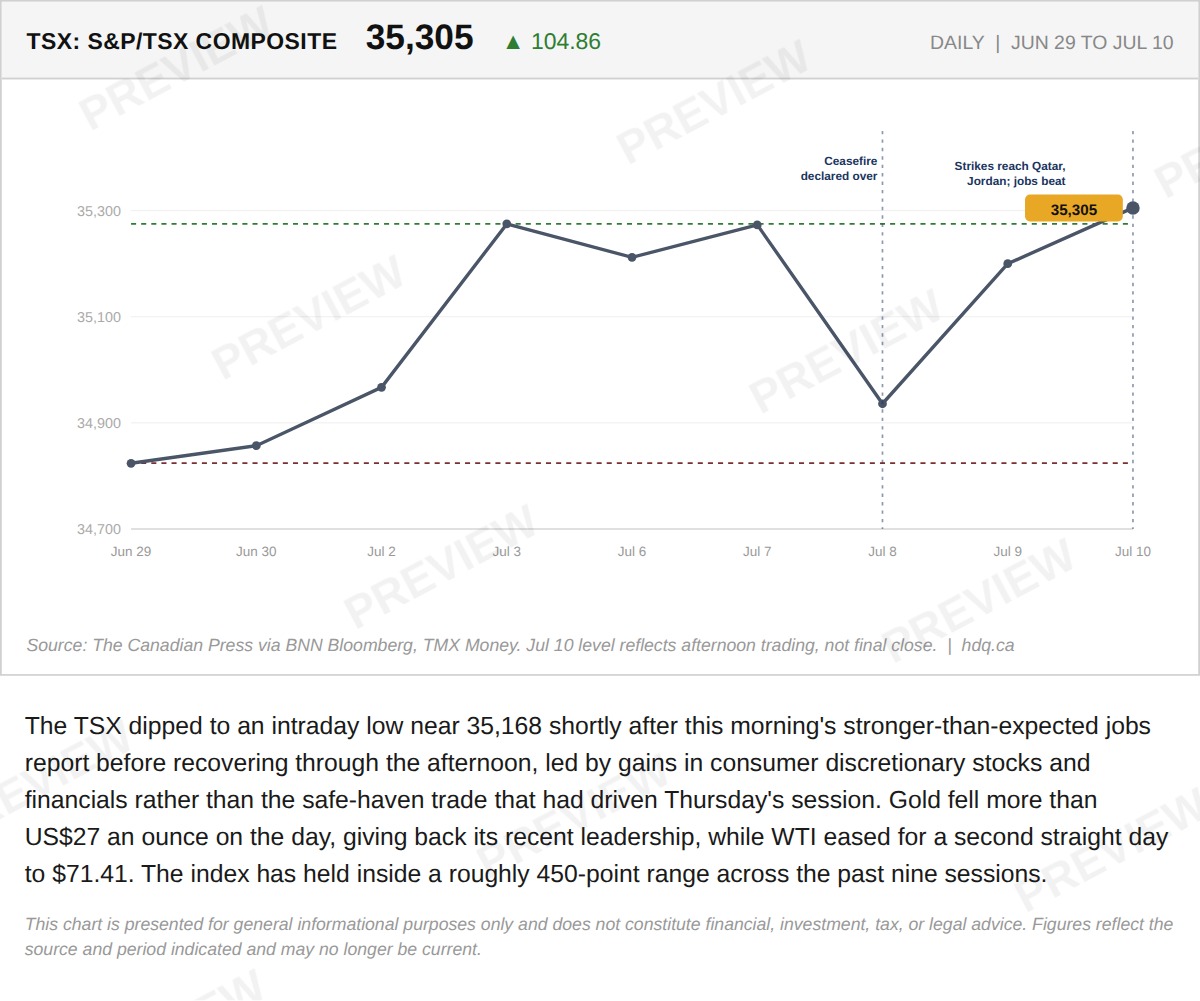
The TSX dipped to an intraday low near 35,168 shortly after this morning's stronger-than-expected jobs report before recovering through the…
Employment Beat the Forecast by Nearly Double Today. The Bank of Canada's Path Did Not Move.
July 10, 2026
View chart & download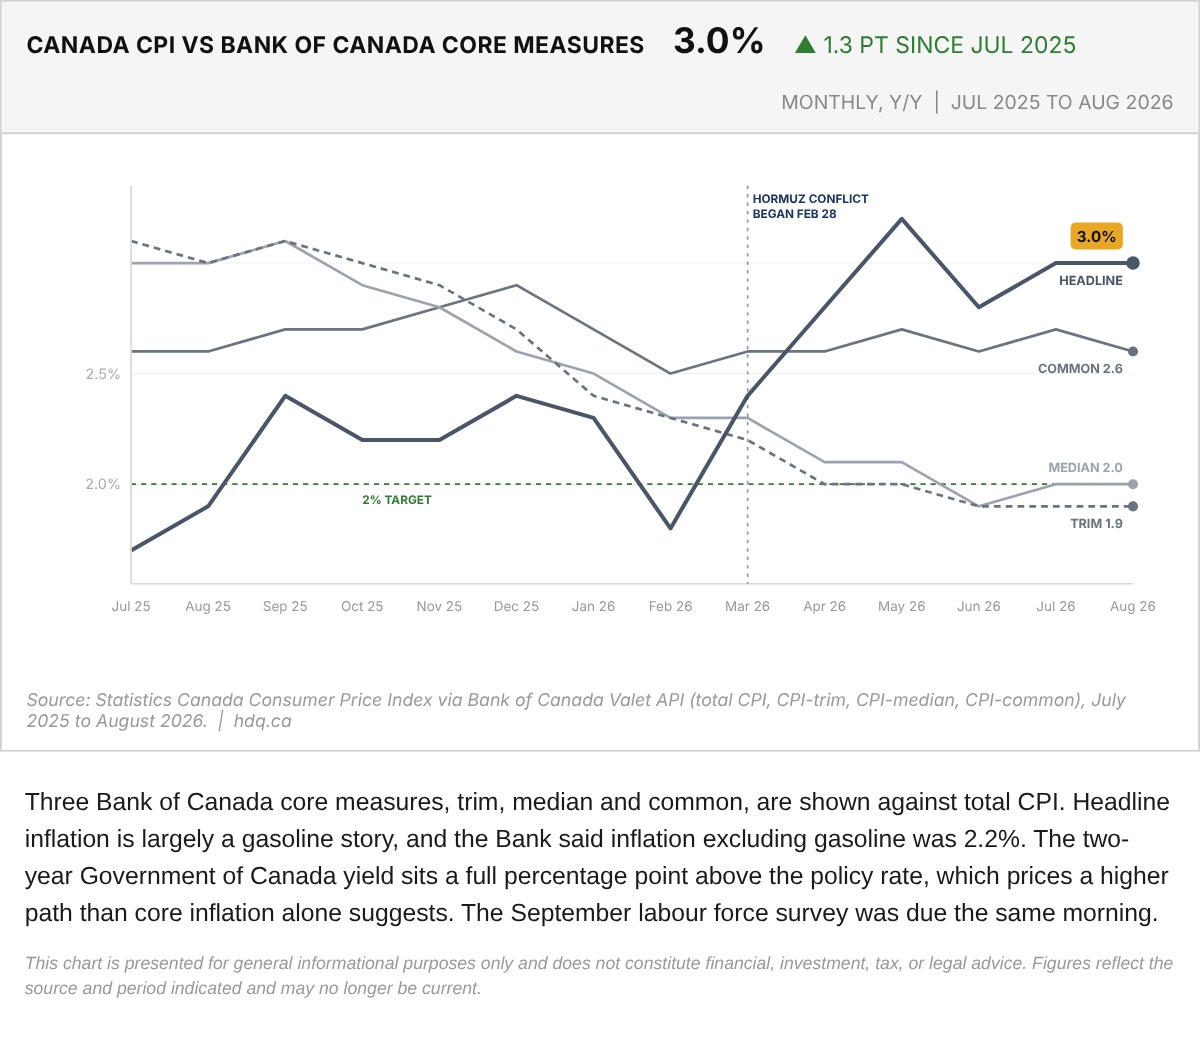
Three Bank of Canada core measures, trim, median and common, are shown against total CPI.
Canada CPI Against Bank of Canada Core Measures, July 2025 to August 2026
October 9, 2026
View chart & download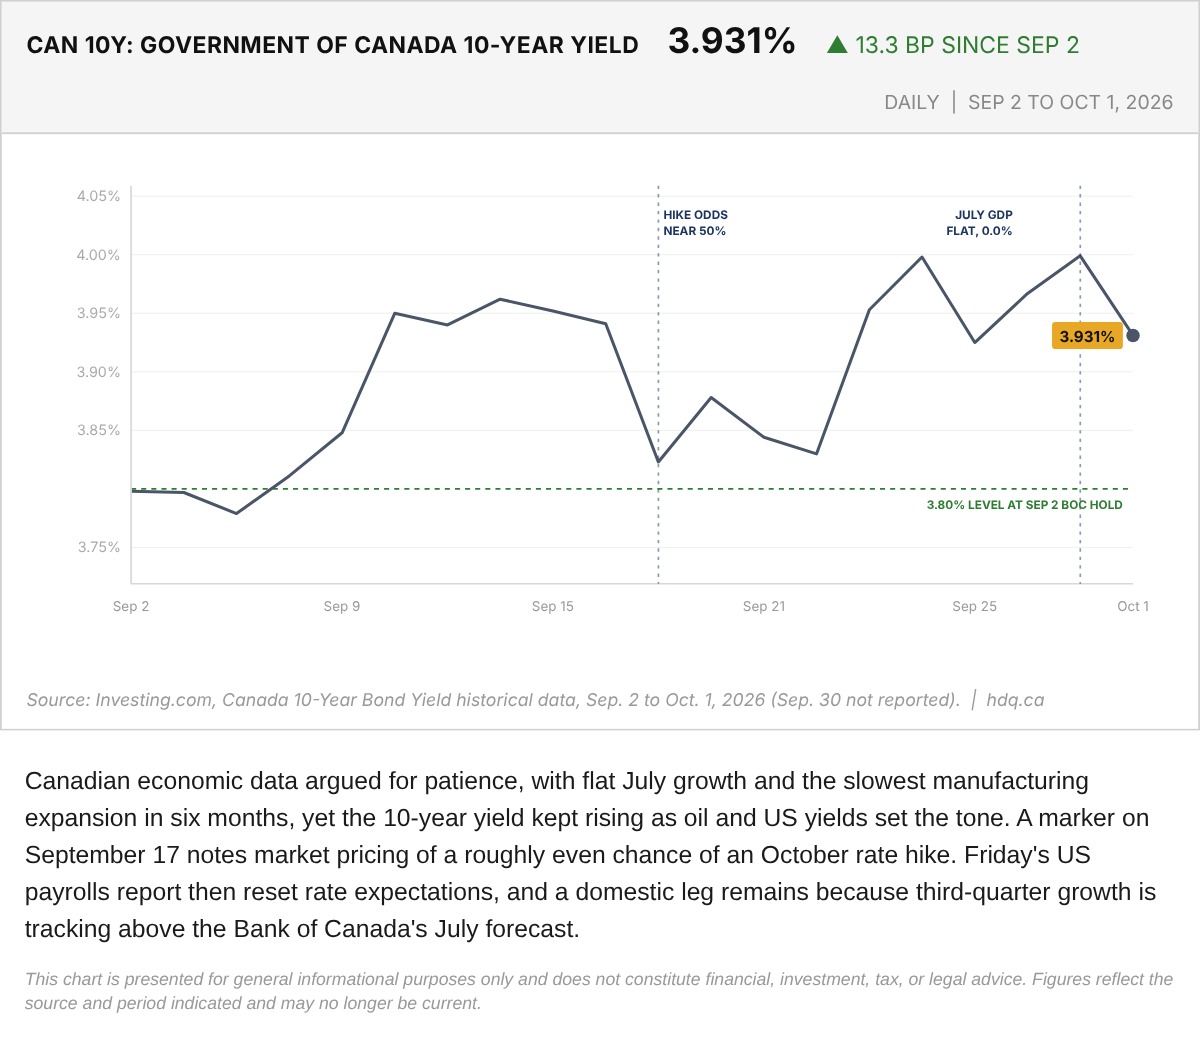
Canadian economic data argued for patience, with flat July growth and the slowest manufacturing expansion in six months, yet the 10-year…
Government of Canada 10-Year Bond Yield, September 2 to October 1, 2026
October 3, 2026
View chart & download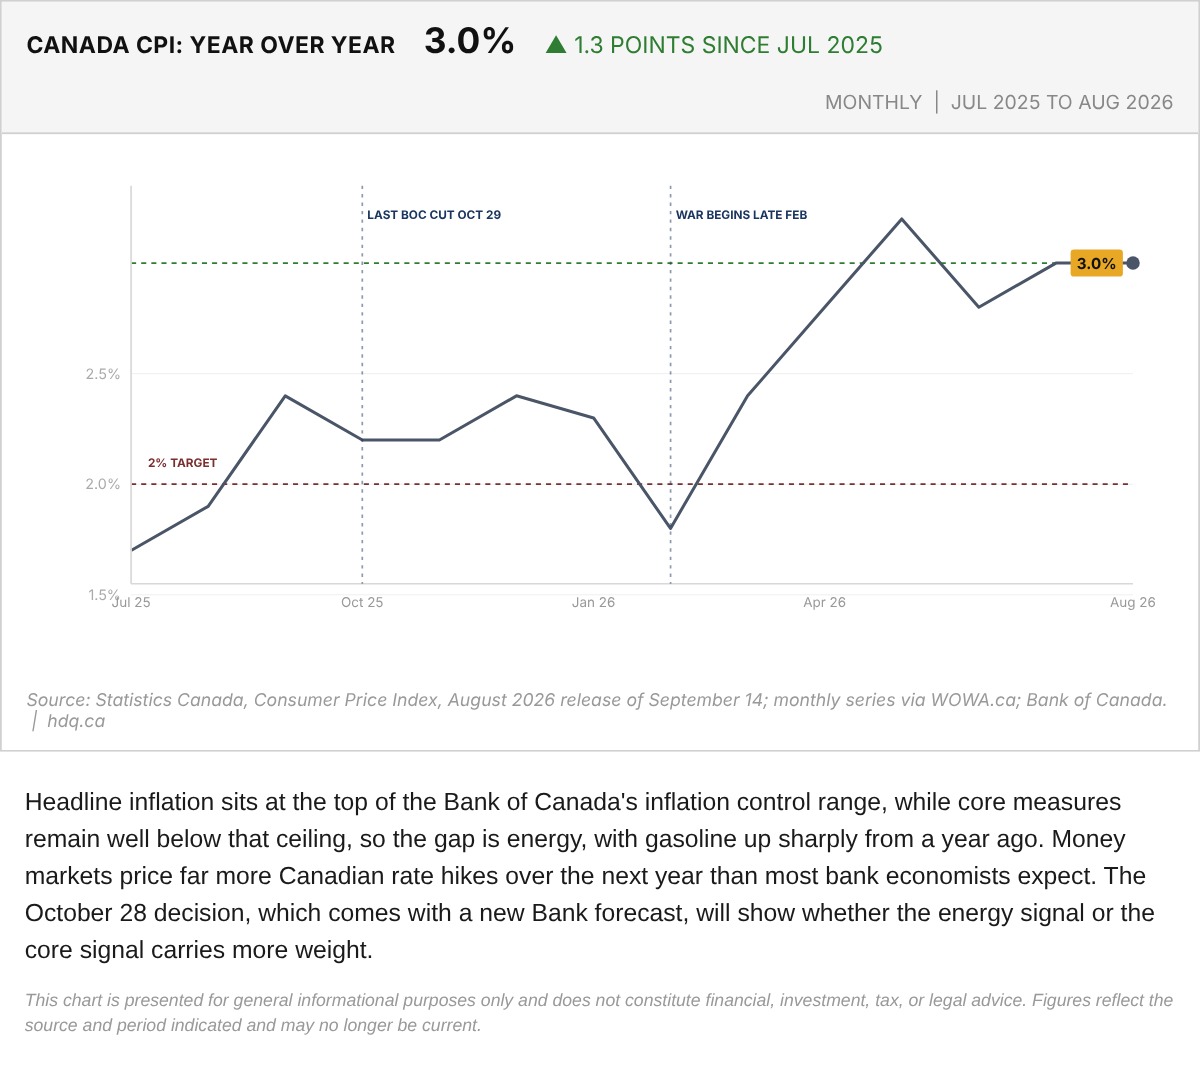
Headline inflation sits at the top of the Bank of Canada's inflation control range, while core measures remain well below that ceiling, so…
Canada Consumer Price Index Inflation, Year Over Year, July 2025 to August 2026
September 29, 2026
View chart & download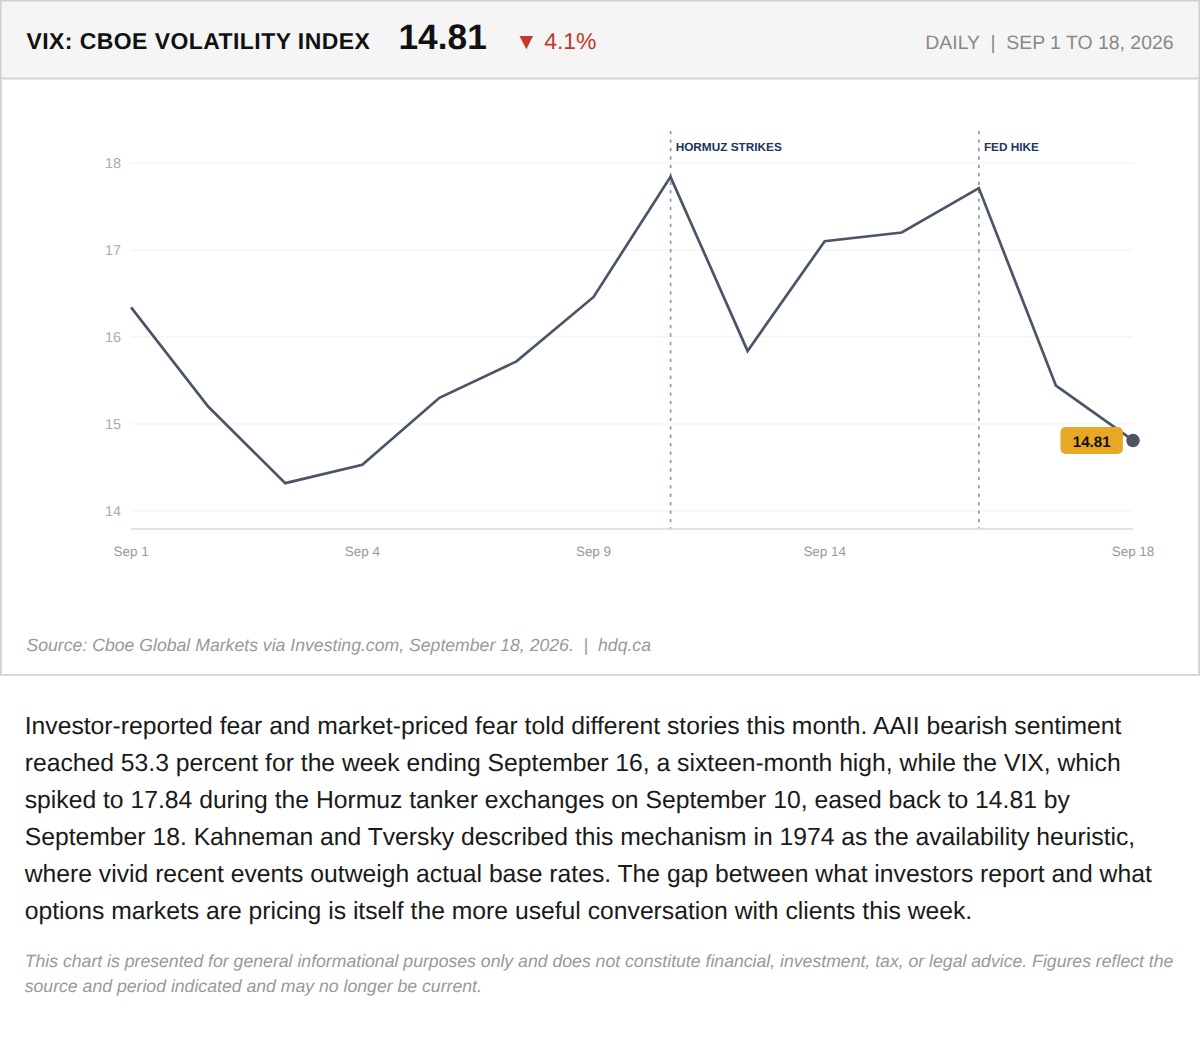
Investor-reported fear and market-priced fear told different stories this month.
The Fear Investors Report and the Fear the Market Is Pricing Have Split
September 21, 2026
View chart & download