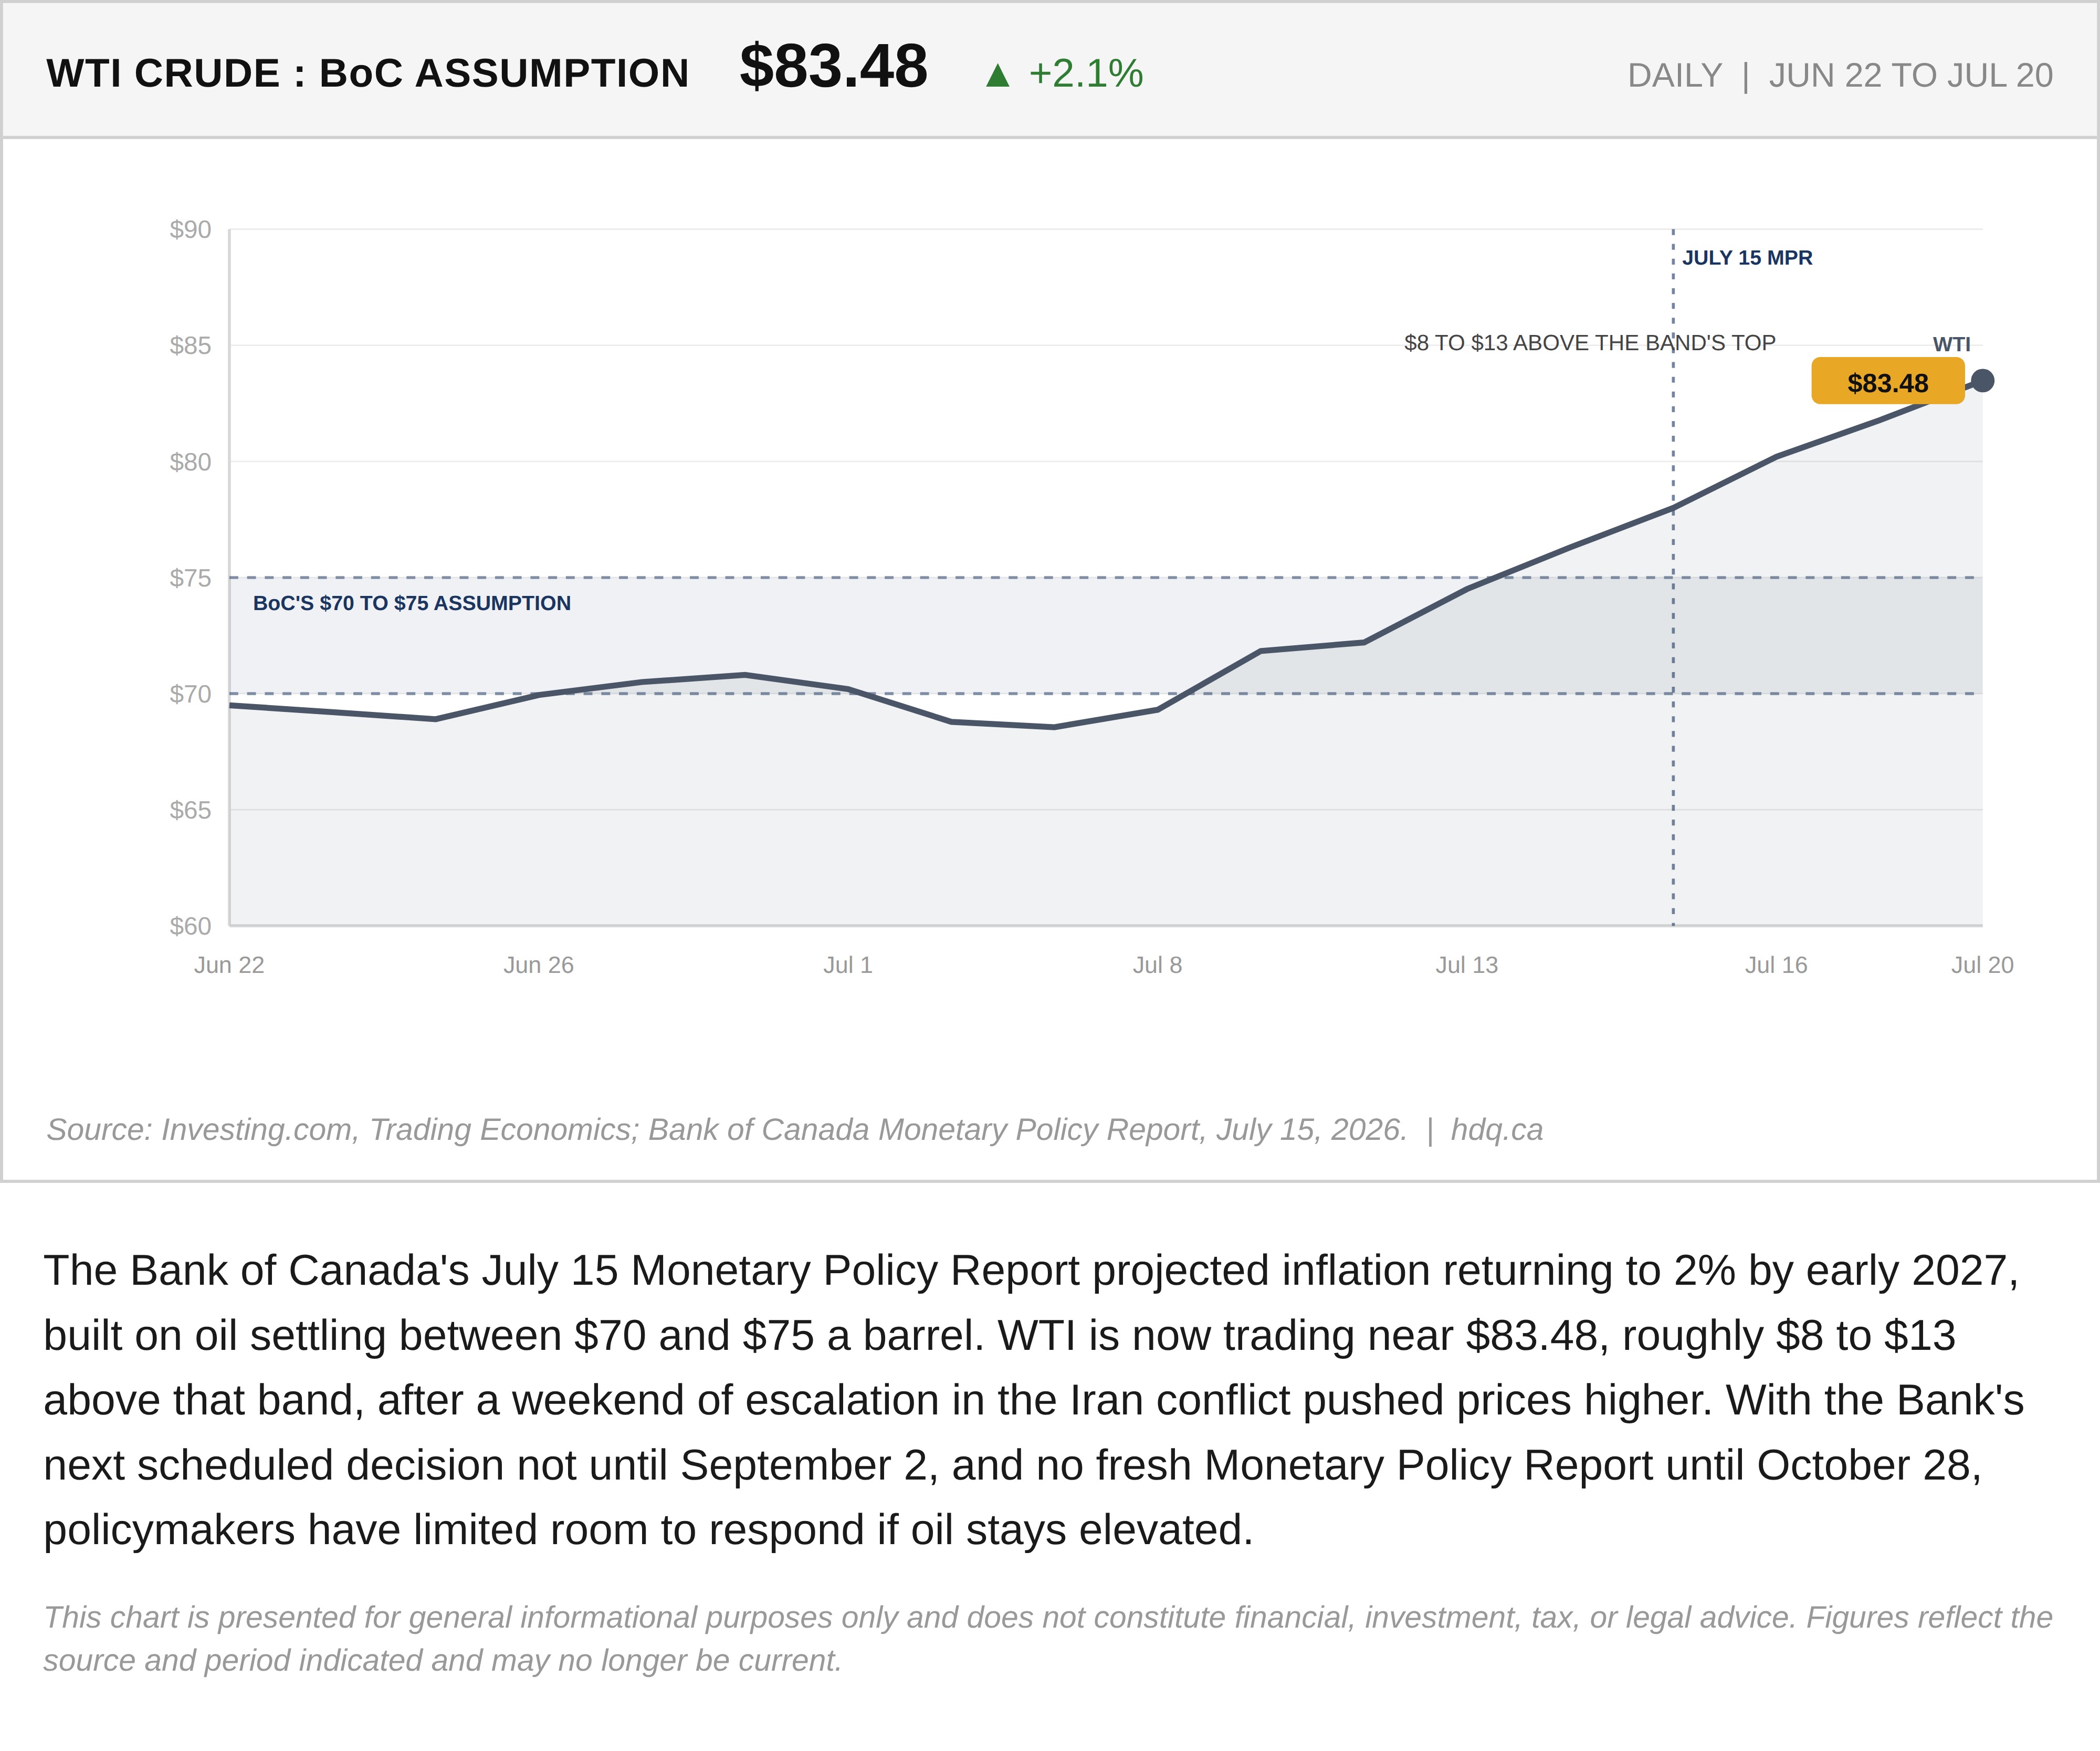
The Bank of Canada's July 15 Monetary Policy Report projected inflation returning to 2% by early 2027, built on oil settling between $70 and $75 a barrel. WTI is now trading near $83.48, roughly $8 to $13 above that band, after a weekend of escalation in the Iran conflict pushed prices higher. With the Bank's next scheduled decision not until September 2, and no fresh Monetary Policy Report until October 28, policymakers have limited room to respond if oil stays elevated.
This chart is presented for general informational purposes only and does not constitute financial, investment, tax, or legal advice. Figures reflect the source and period indicated and may no longer be current.

Related charts
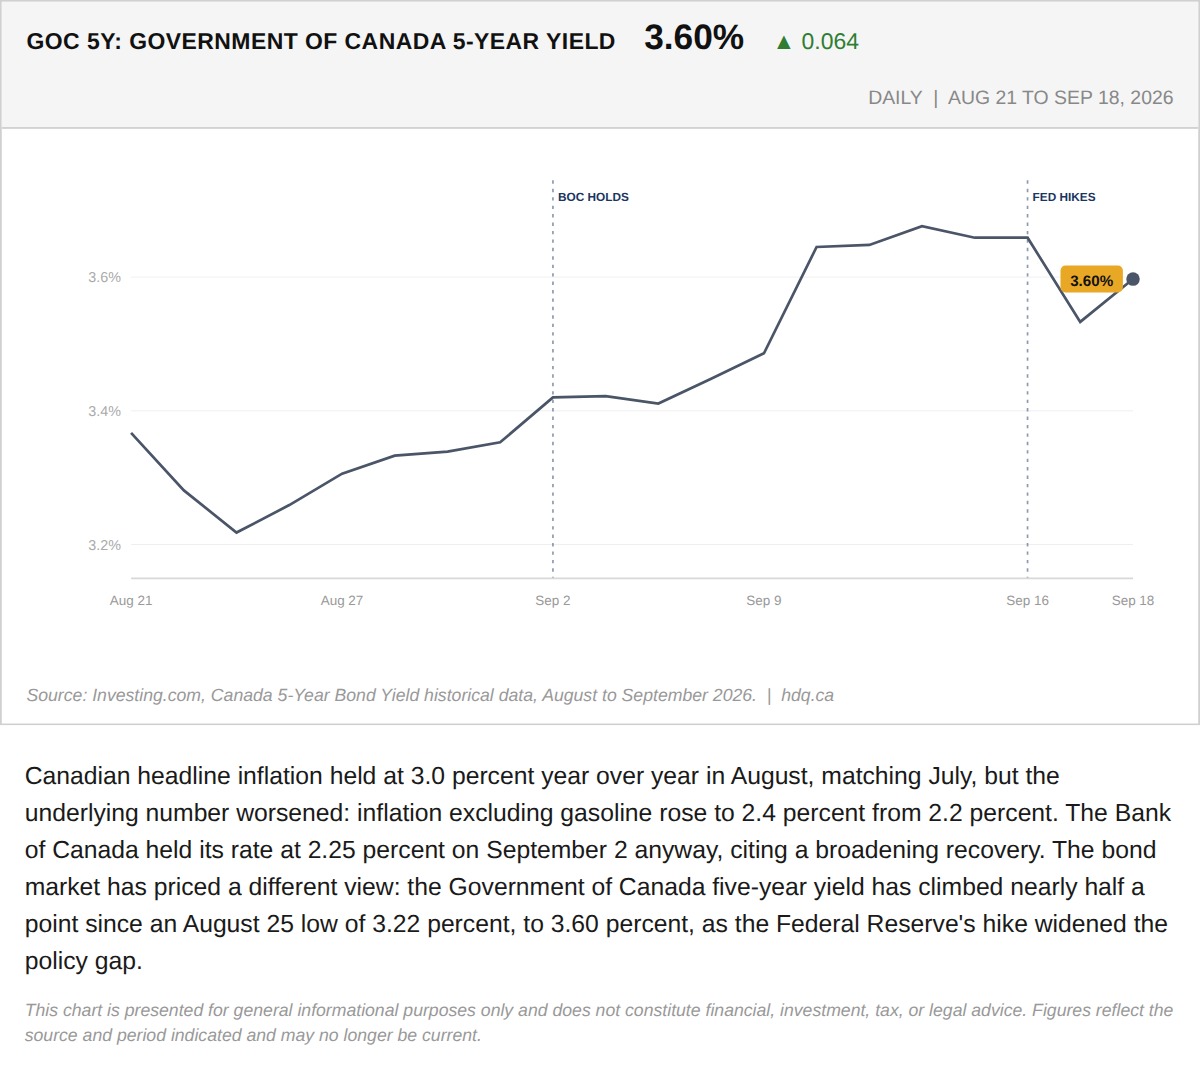
Canadian headline inflation held at 3.0 percent year over year in August, matching July, but the underlying number worsened: inflation…
The Bond Market Already Moved Before the Bank of Canada Has To
September 21, 2026
View chart & download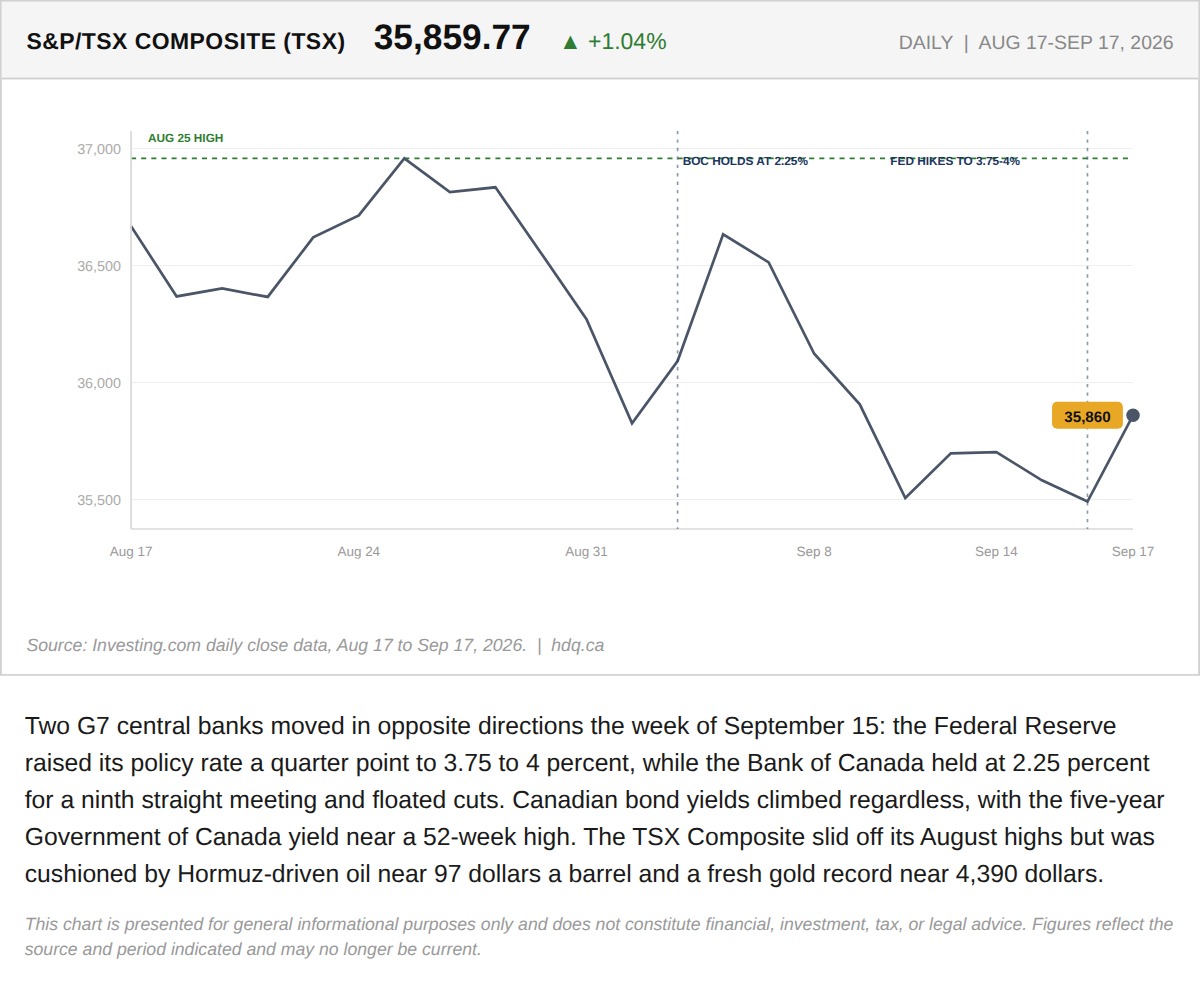
Two G7 central banks moved in opposite directions the week of September 15: the Federal Reserve raised its policy rate a quarter point to…
The Week the Bank of Canada's Own Rate Stopped Setting Canadian Borrowing Costs
September 19, 2026
View chart & download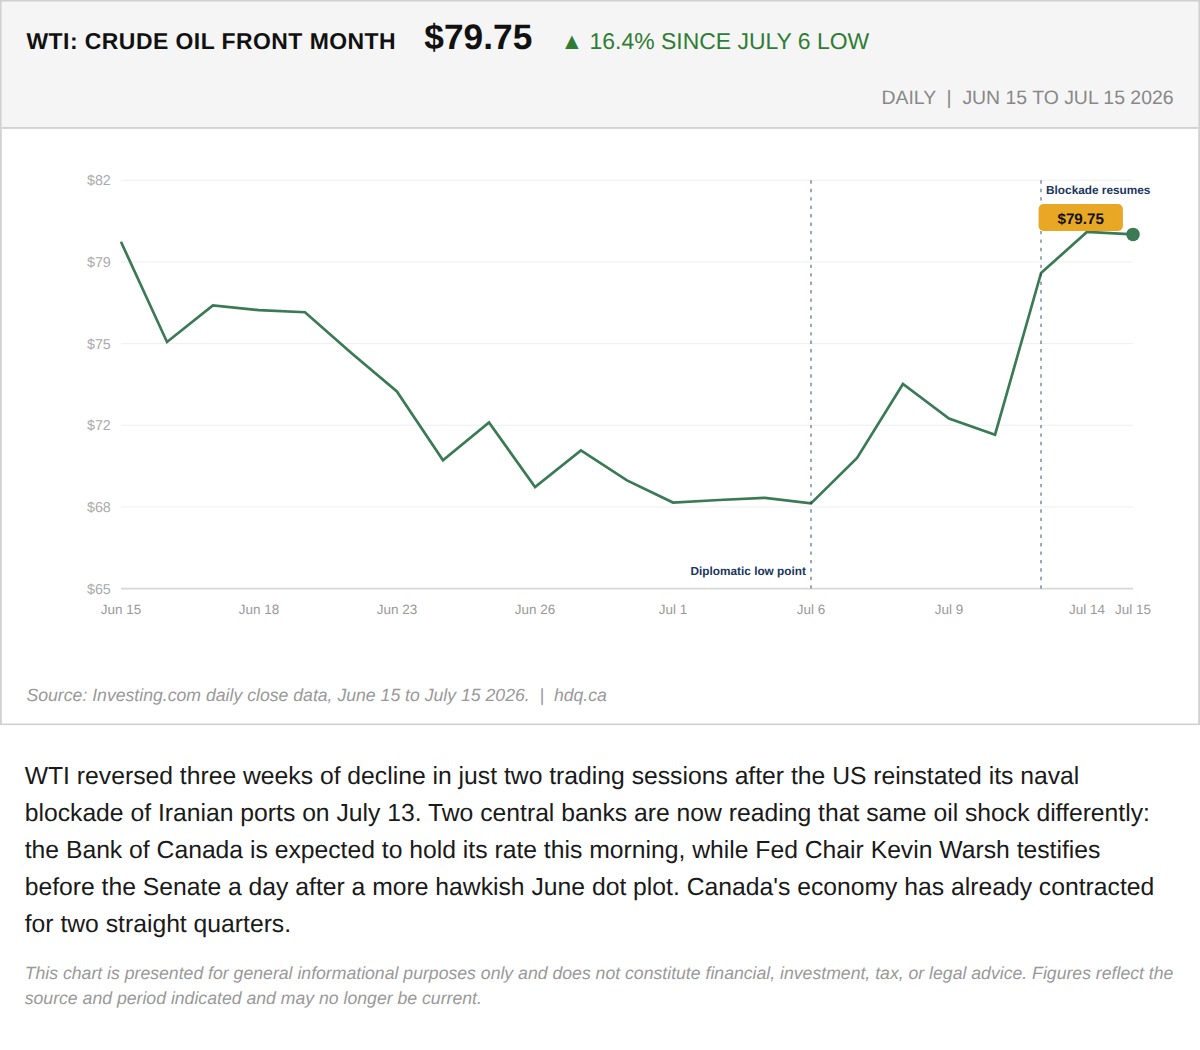
WTI reversed three weeks of decline in just two trading sessions after the US reinstated its naval blockade of Iranian ports on July 13.
July 15, 2026
View chart & download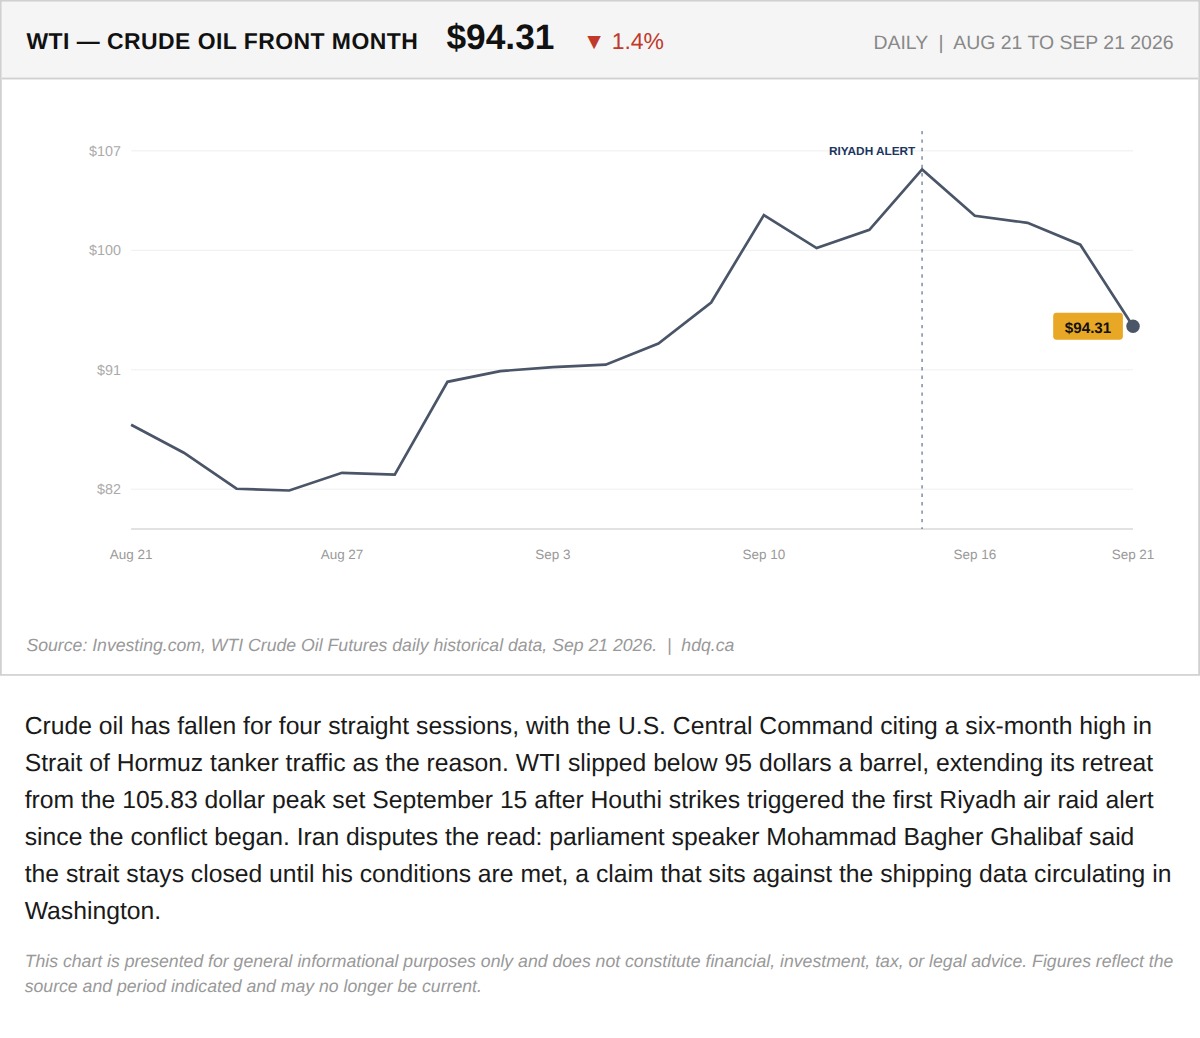
Crude oil has fallen for four straight sessions, with the U.S.
Oil Falls for a Fourth Session as Hormuz Shipping Data Is Disputed
September 21, 2026
View chart & download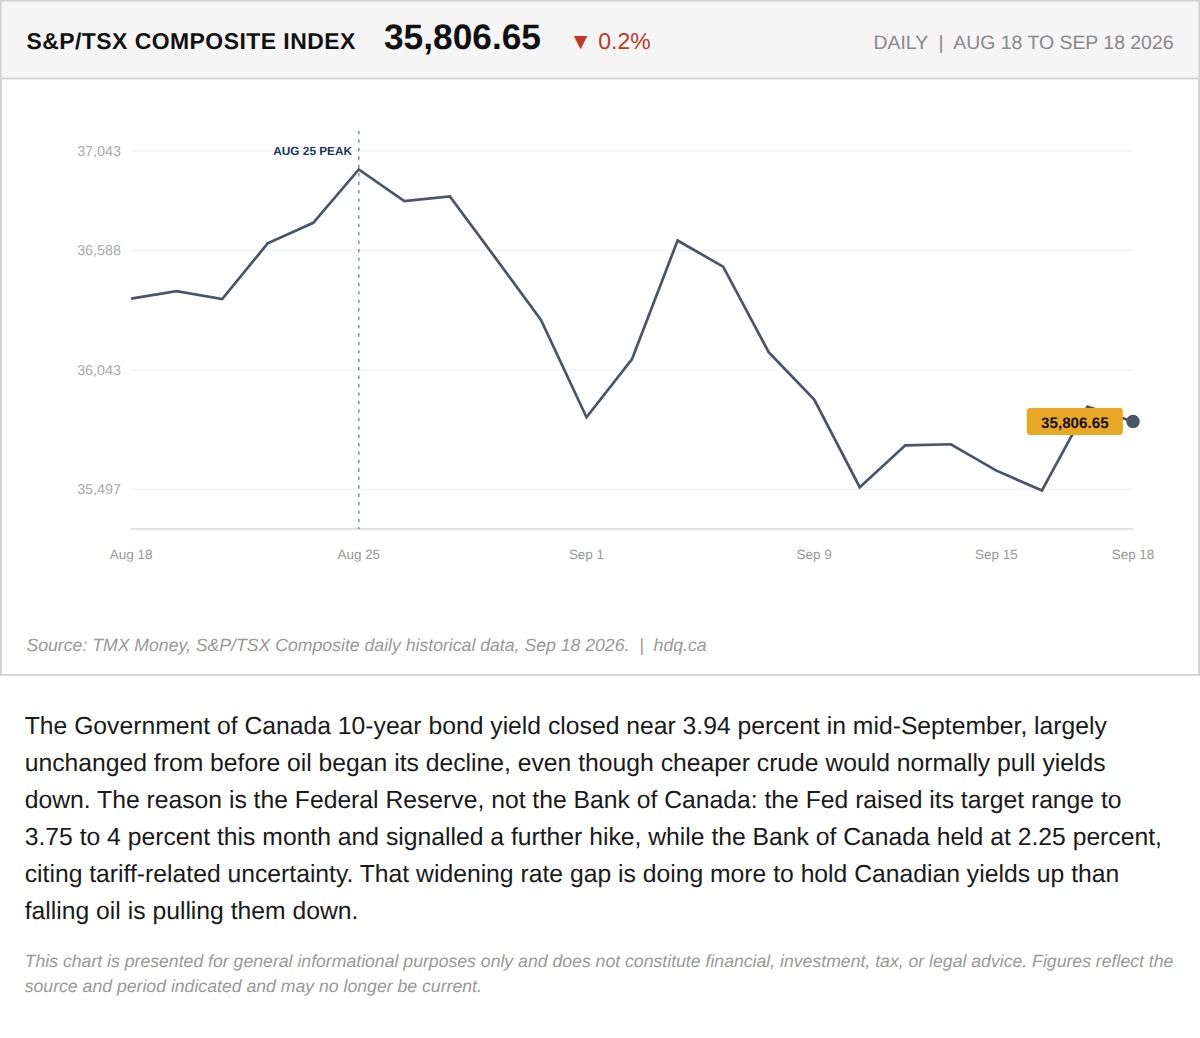
The Government of Canada 10-year bond yield closed near 3.94 percent in mid-September, largely unchanged from before oil began its decline,…
TSX Slides as Canadian Bond Yields Stay Elevated Despite Falling Oil
September 21, 2026
View chart & download
Brent was the only one of the three to finish above its starting level, while the index and gold both fell.
Brent, TSX and Gold Rebased to the August 31 Close
September 30, 2026
View chart & download