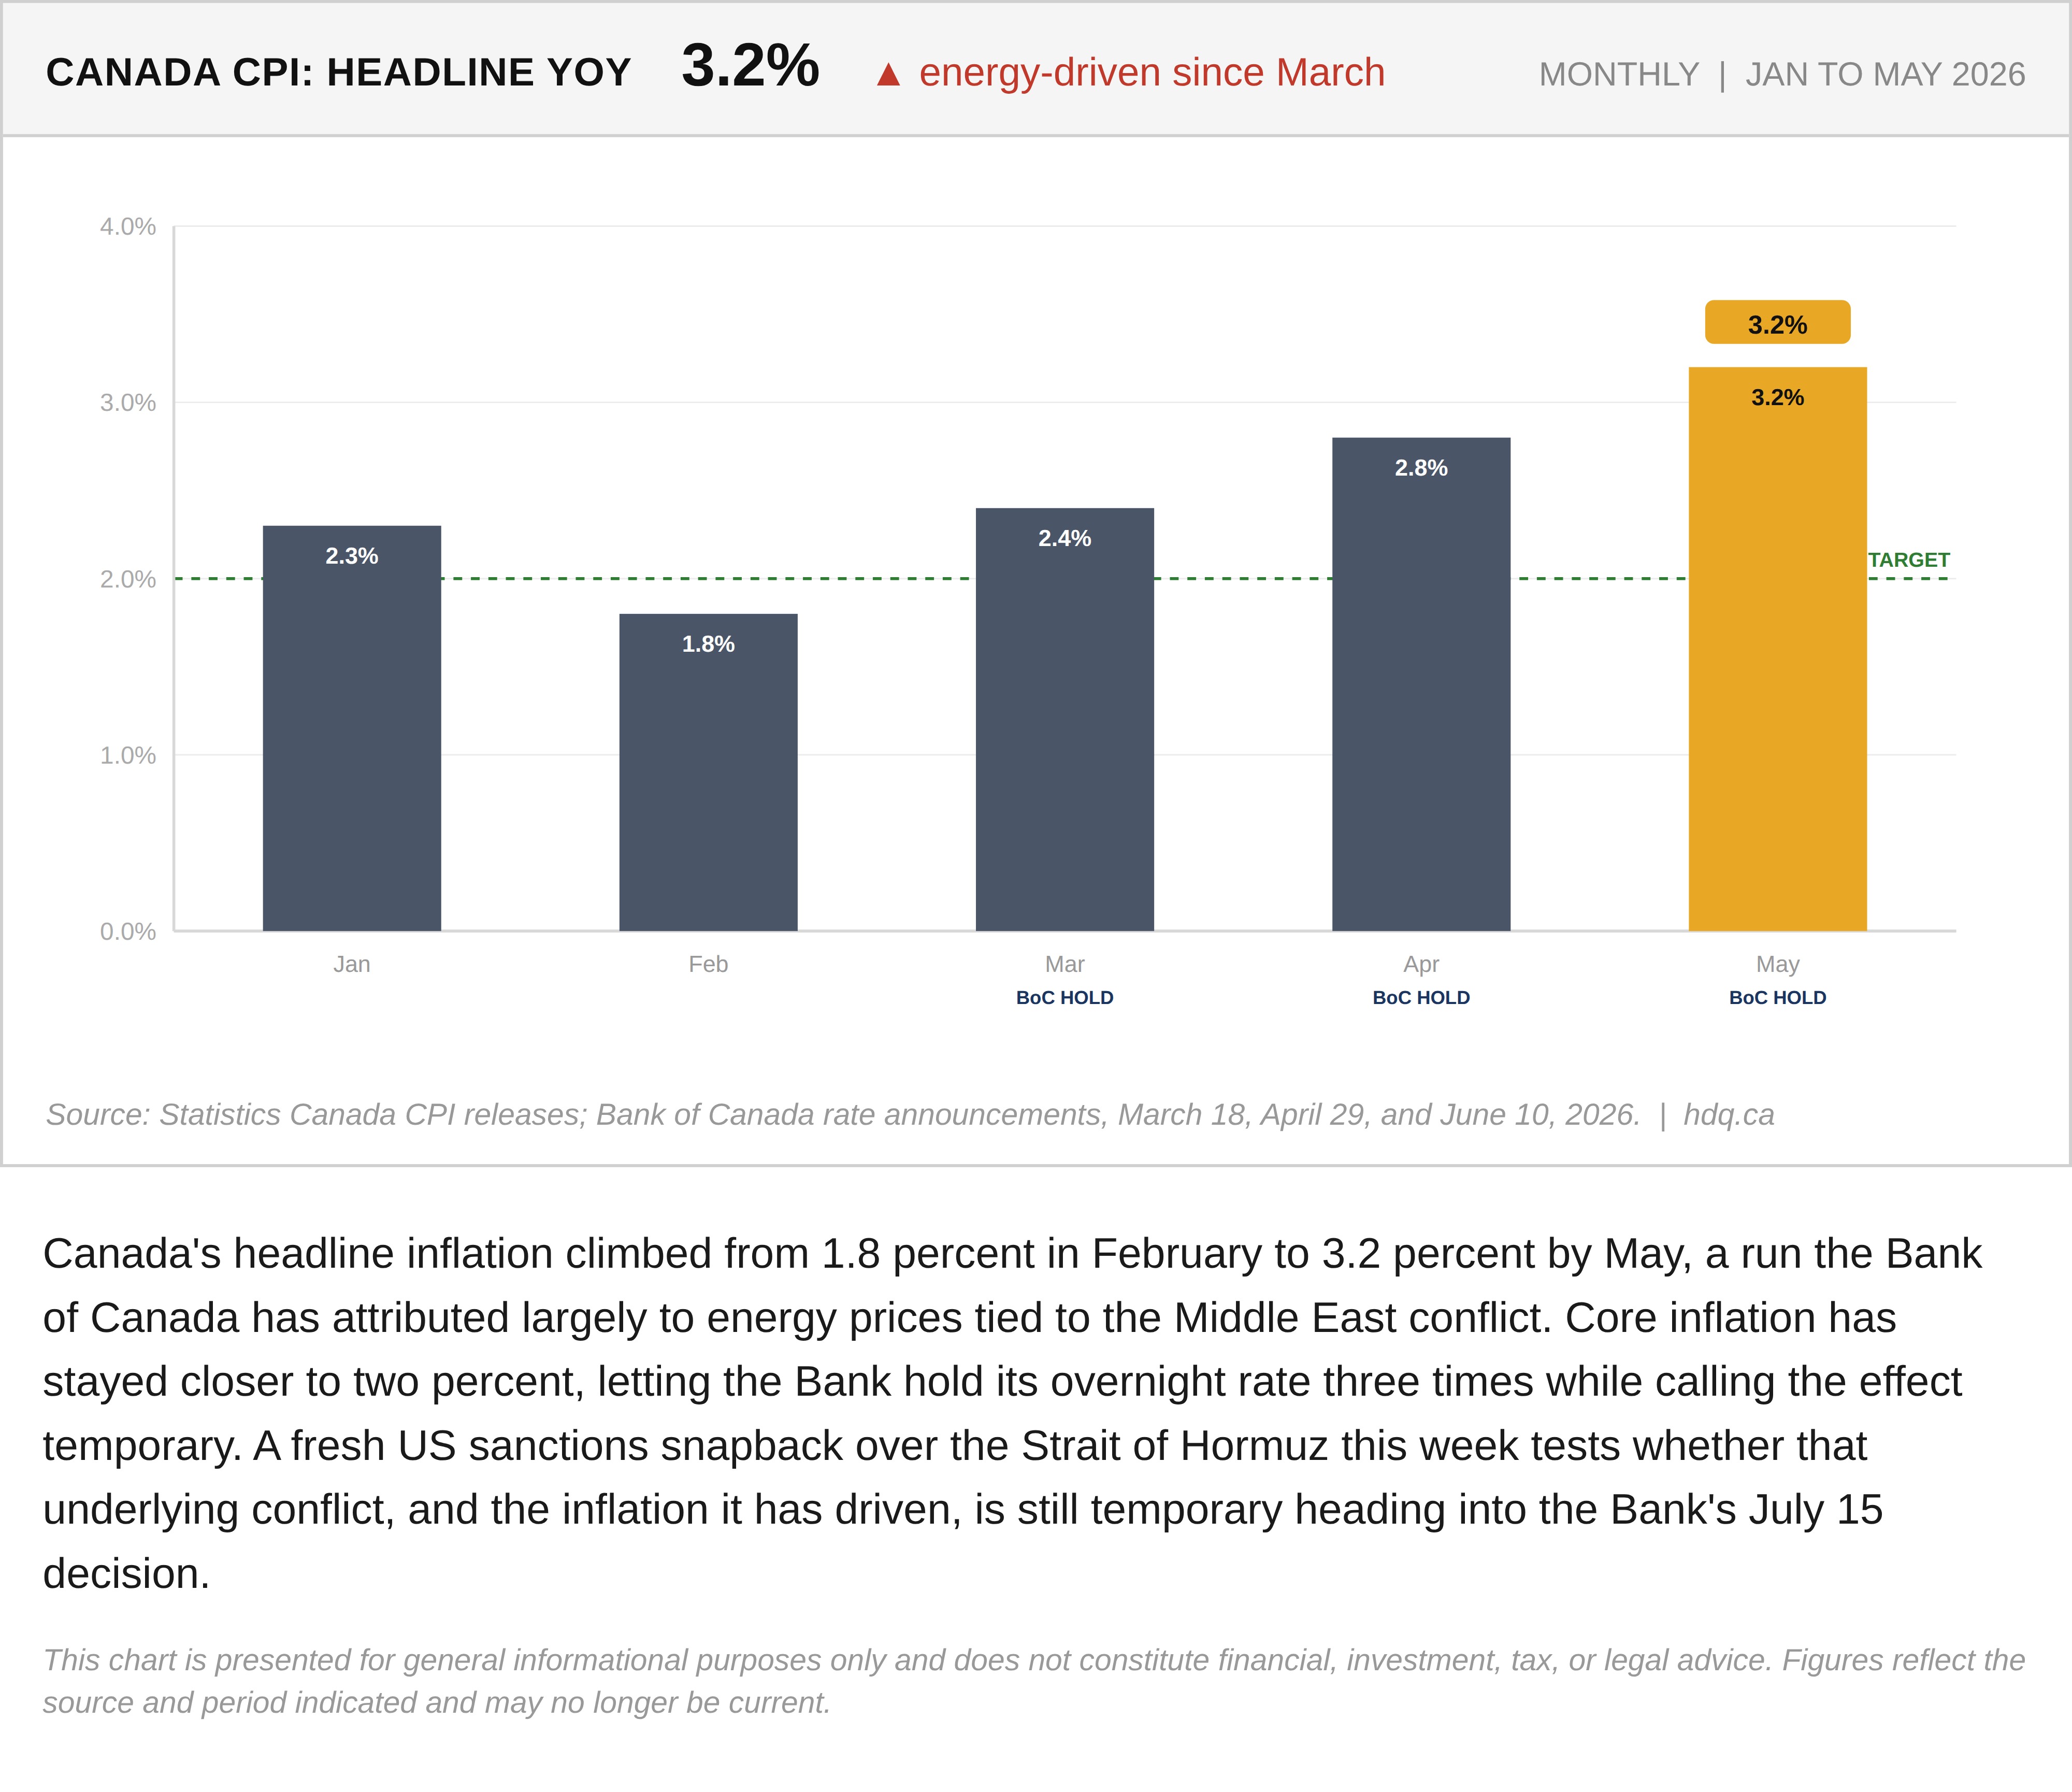
Canada's headline inflation climbed from 1.8 percent in February to 3.2 percent by May, a run the Bank of Canada has attributed largely to energy prices tied to the Middle East conflict. Core inflation has stayed closer to two percent, letting the Bank hold its overnight rate three times while calling the effect temporary. A fresh US sanctions snapback over the Strait of Hormuz this week tests whether that underlying conflict, and the inflation it has driven, is still temporary heading into the Bank's July 15 decision.
This chart is presented for general informational purposes only and does not constitute financial, investment, tax, or legal advice. Figures reflect the source and period indicated and may no longer be current.

Related charts
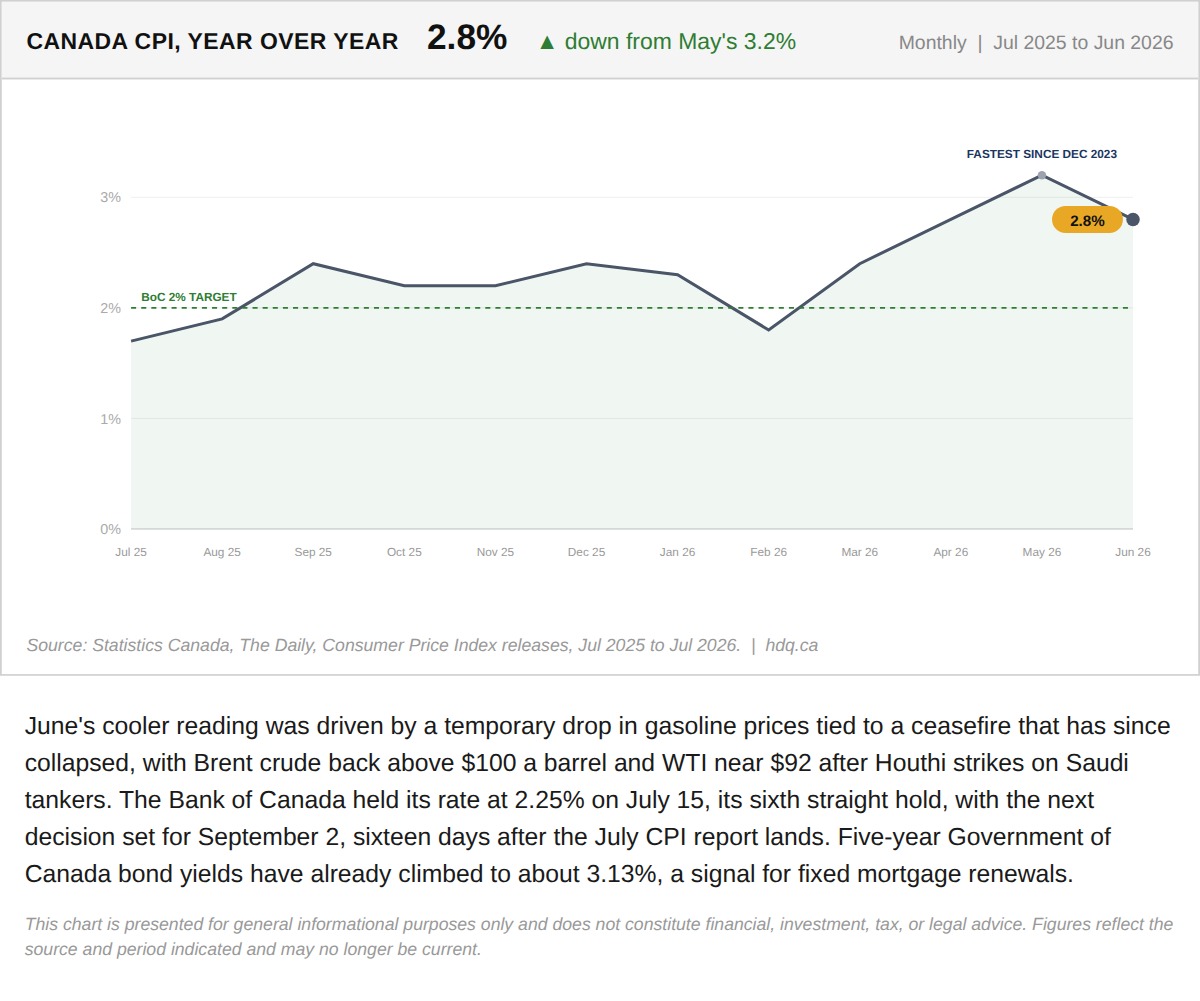
June's cooler reading was driven by a temporary drop in gasoline prices tied to a ceasefire that has since collapsed, with Brent crude back…
June's Cooler Inflation Print Rested on a Ceasefire That Has Already Broken
July 24, 2026
View chart & download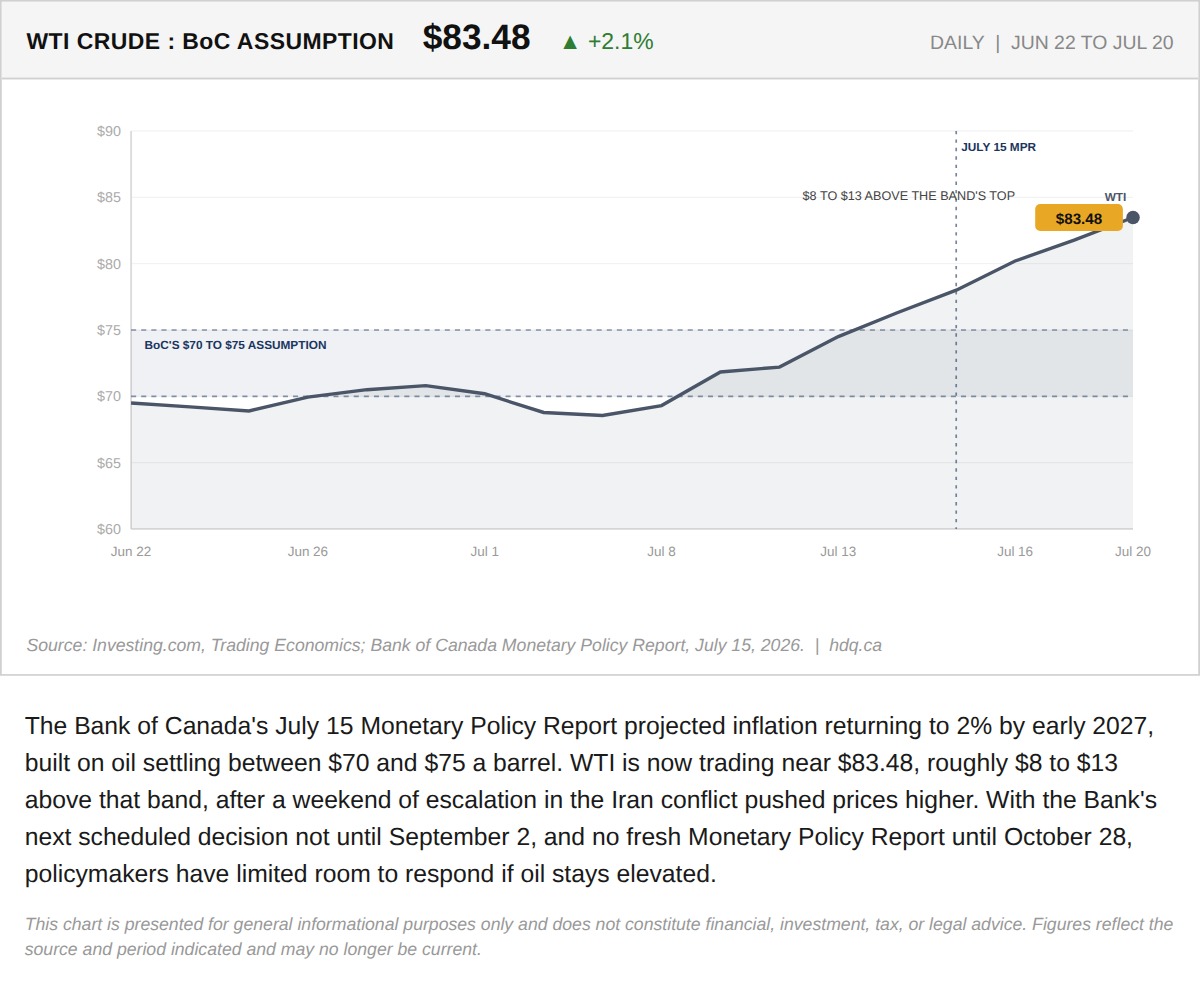
The Bank of Canada's July 15 Monetary Policy Report projected inflation returning to 2% by early 2027, built on oil settling between $70 and $75 a barrel.
The Bank of Canada's Path Back to 2% Assumed Oil at $70 to $75. It's Trading Near $84.
July 20, 2026
View chart & download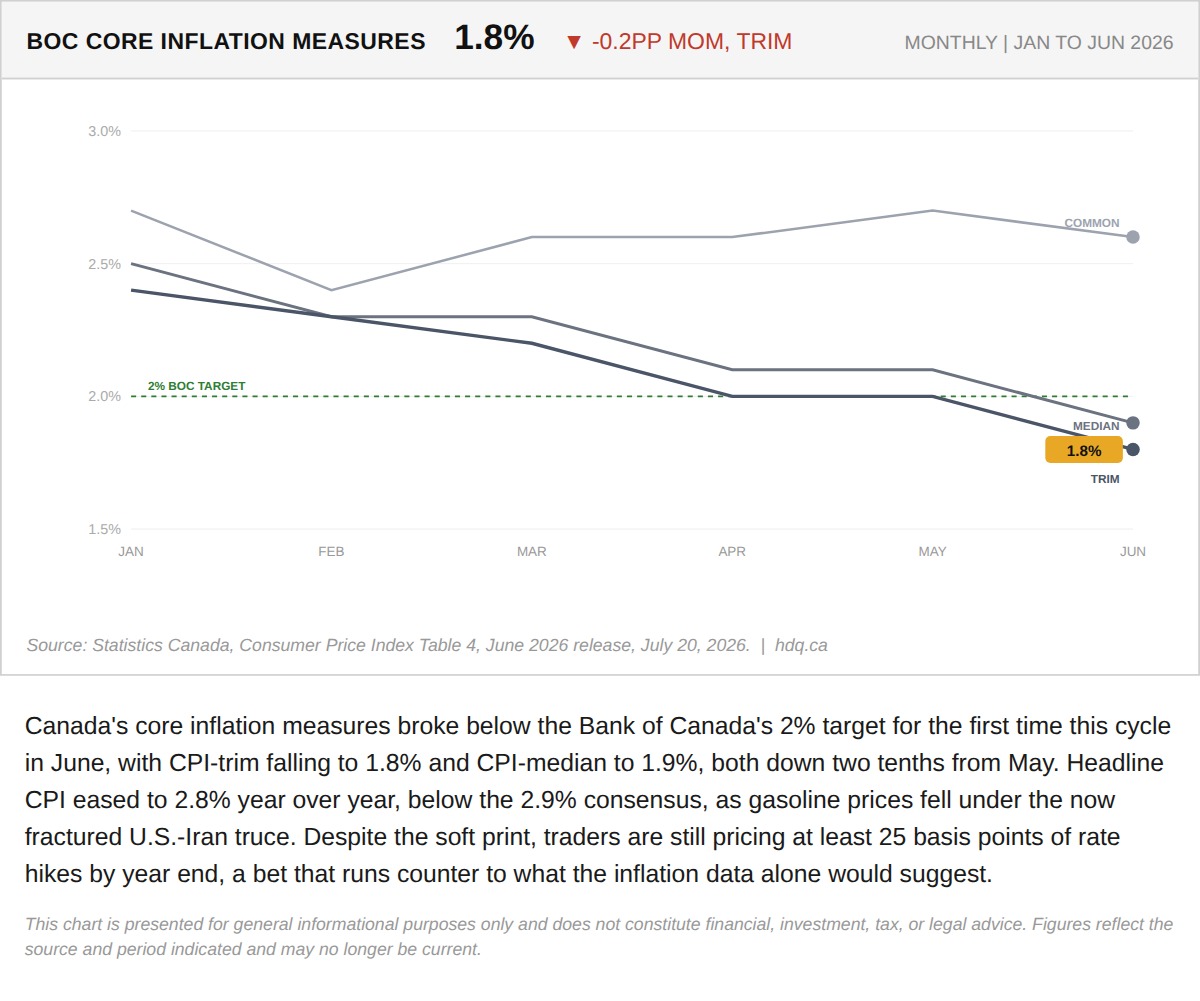
Canada's core inflation measures broke below the Bank of Canada's 2% target for the first time this cycle in June, with CPI-trim falling to…
July 20, 2026
View chart & download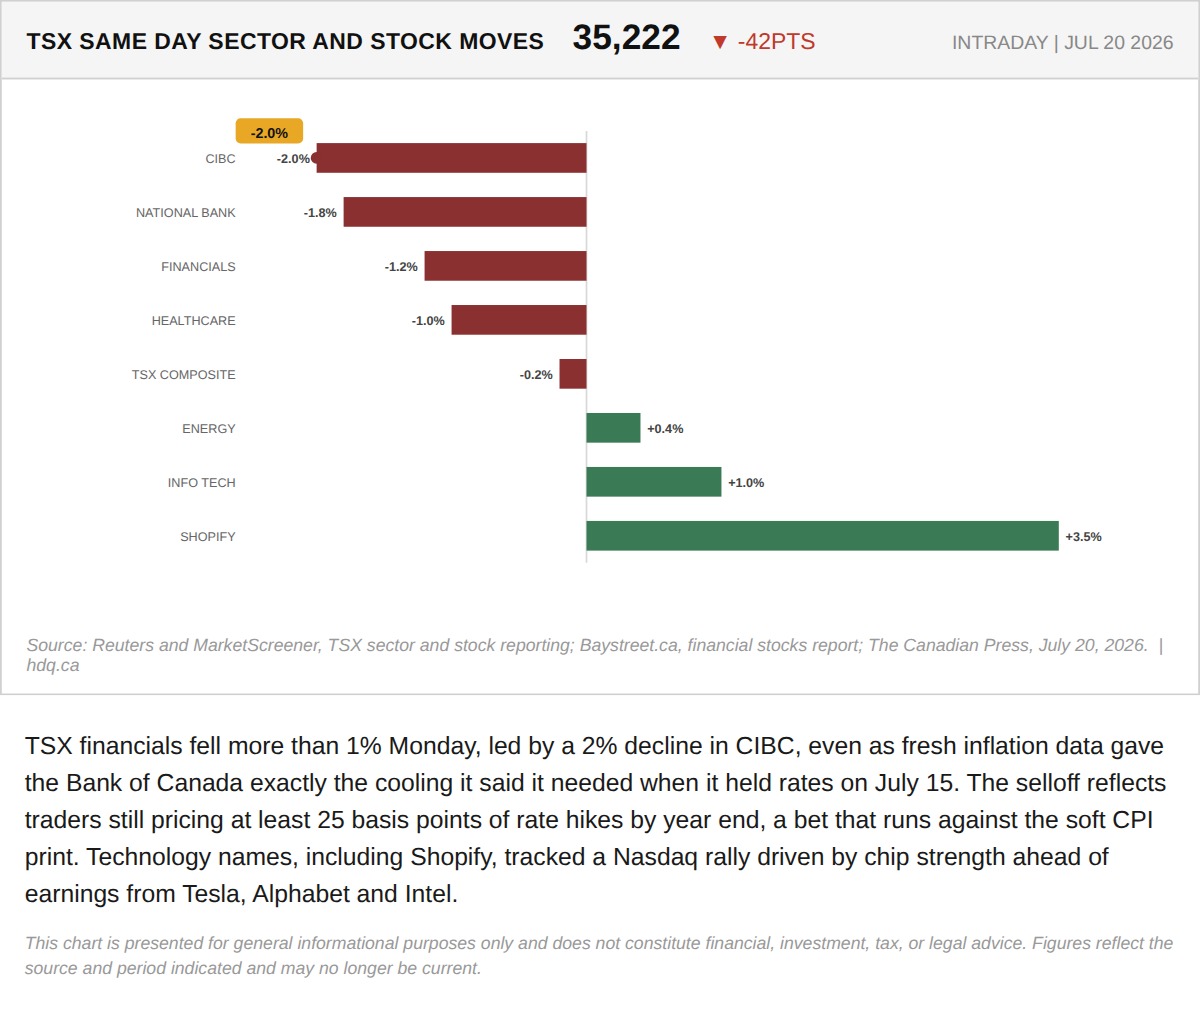
TSX financials fell more than 1% Monday, led by a 2% decline in CIBC, even as fresh inflation data gave the Bank of Canada exactly the…
July 20, 2026
View chart & download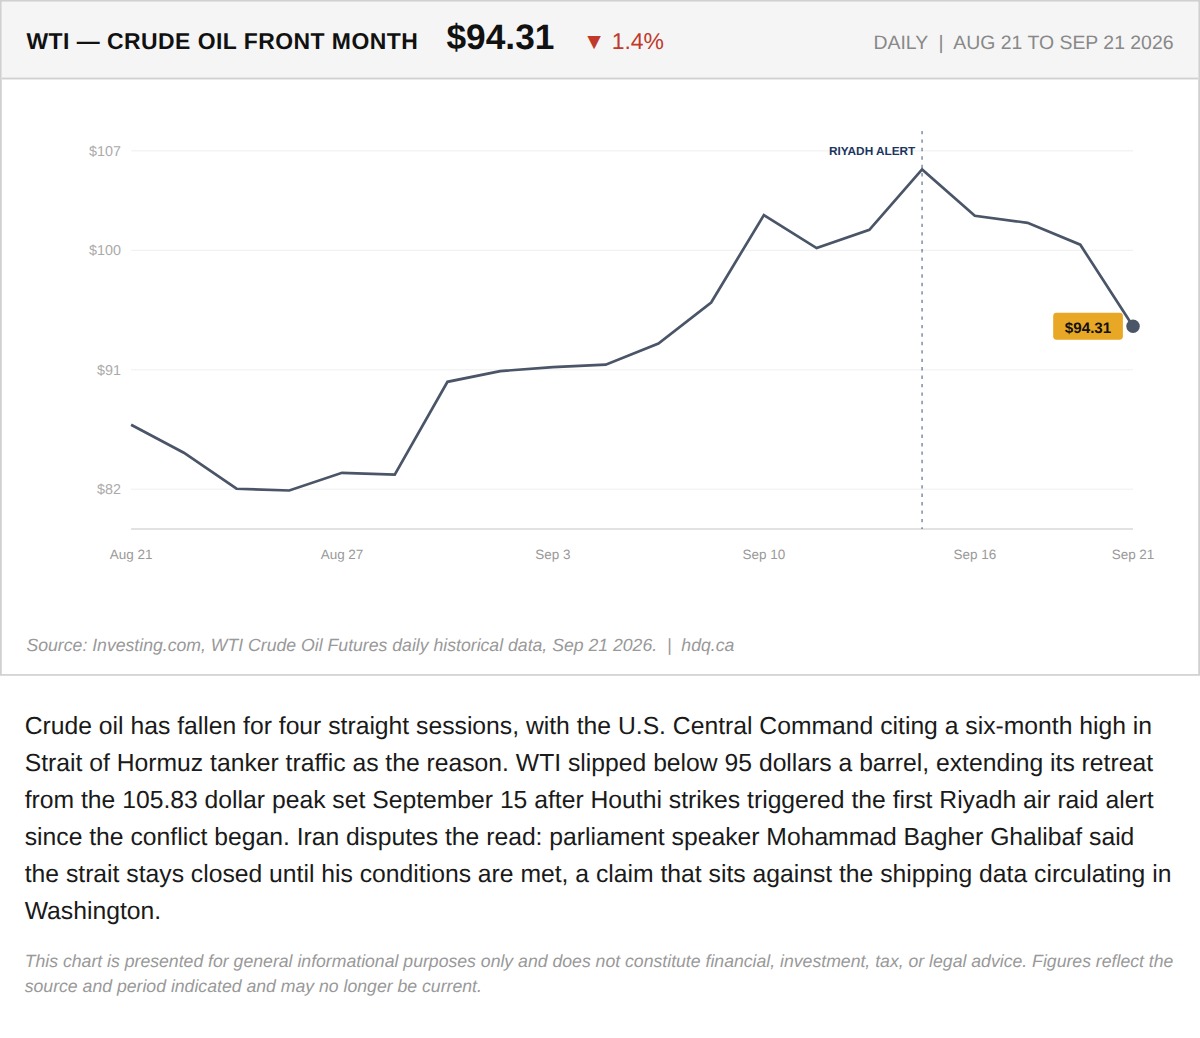
Crude oil has fallen for four straight sessions, with the U.S.
Oil Falls for a Fourth Session as Hormuz Shipping Data Is Disputed
September 21, 2026
View chart & download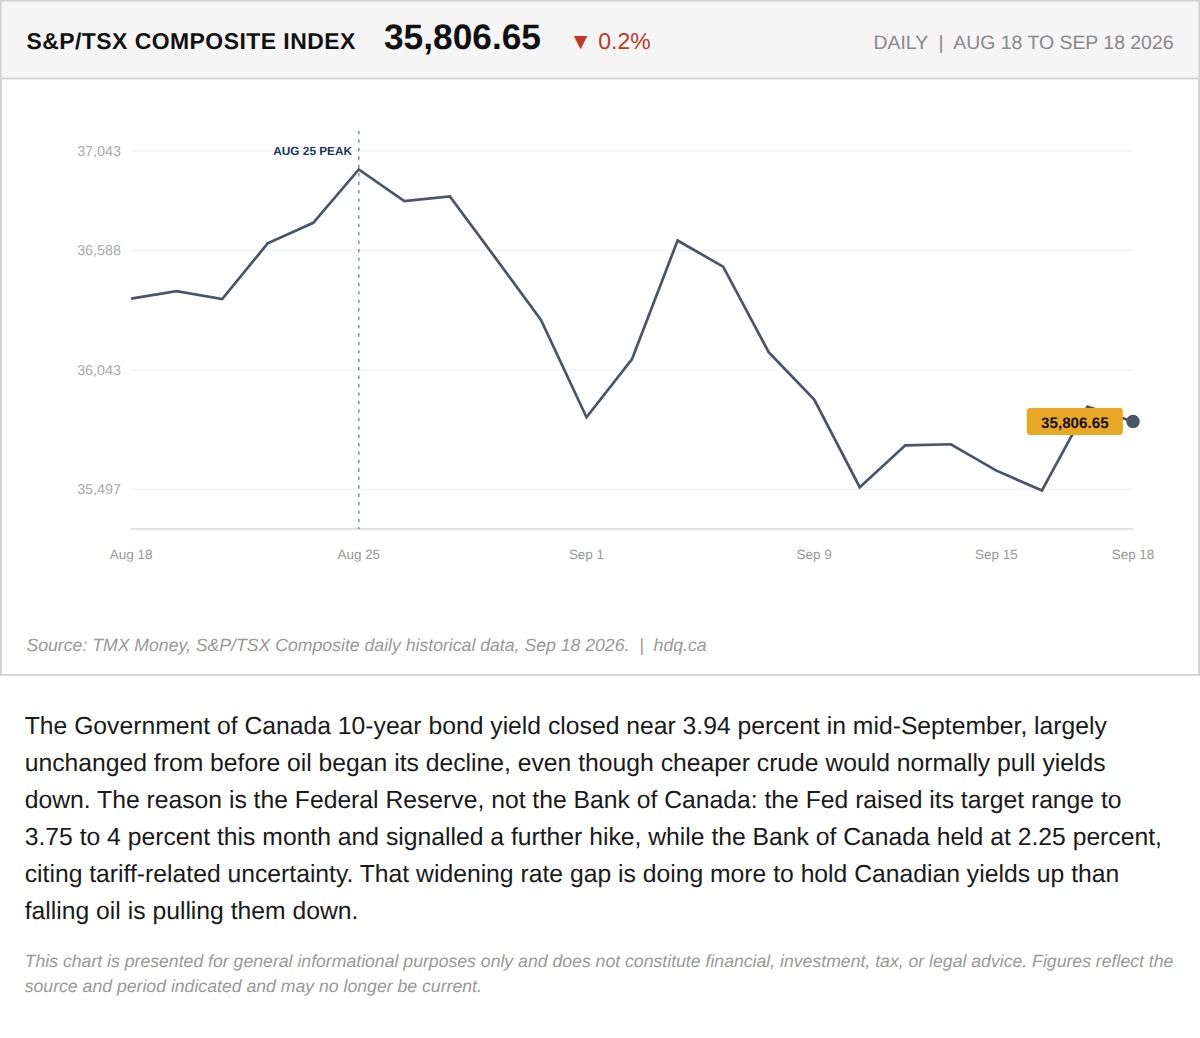
The Government of Canada 10-year bond yield closed near 3.94 percent in mid-September, largely unchanged from before oil began its decline,…
TSX Slides as Canadian Bond Yields Stay Elevated Despite Falling Oil
September 21, 2026
View chart & download