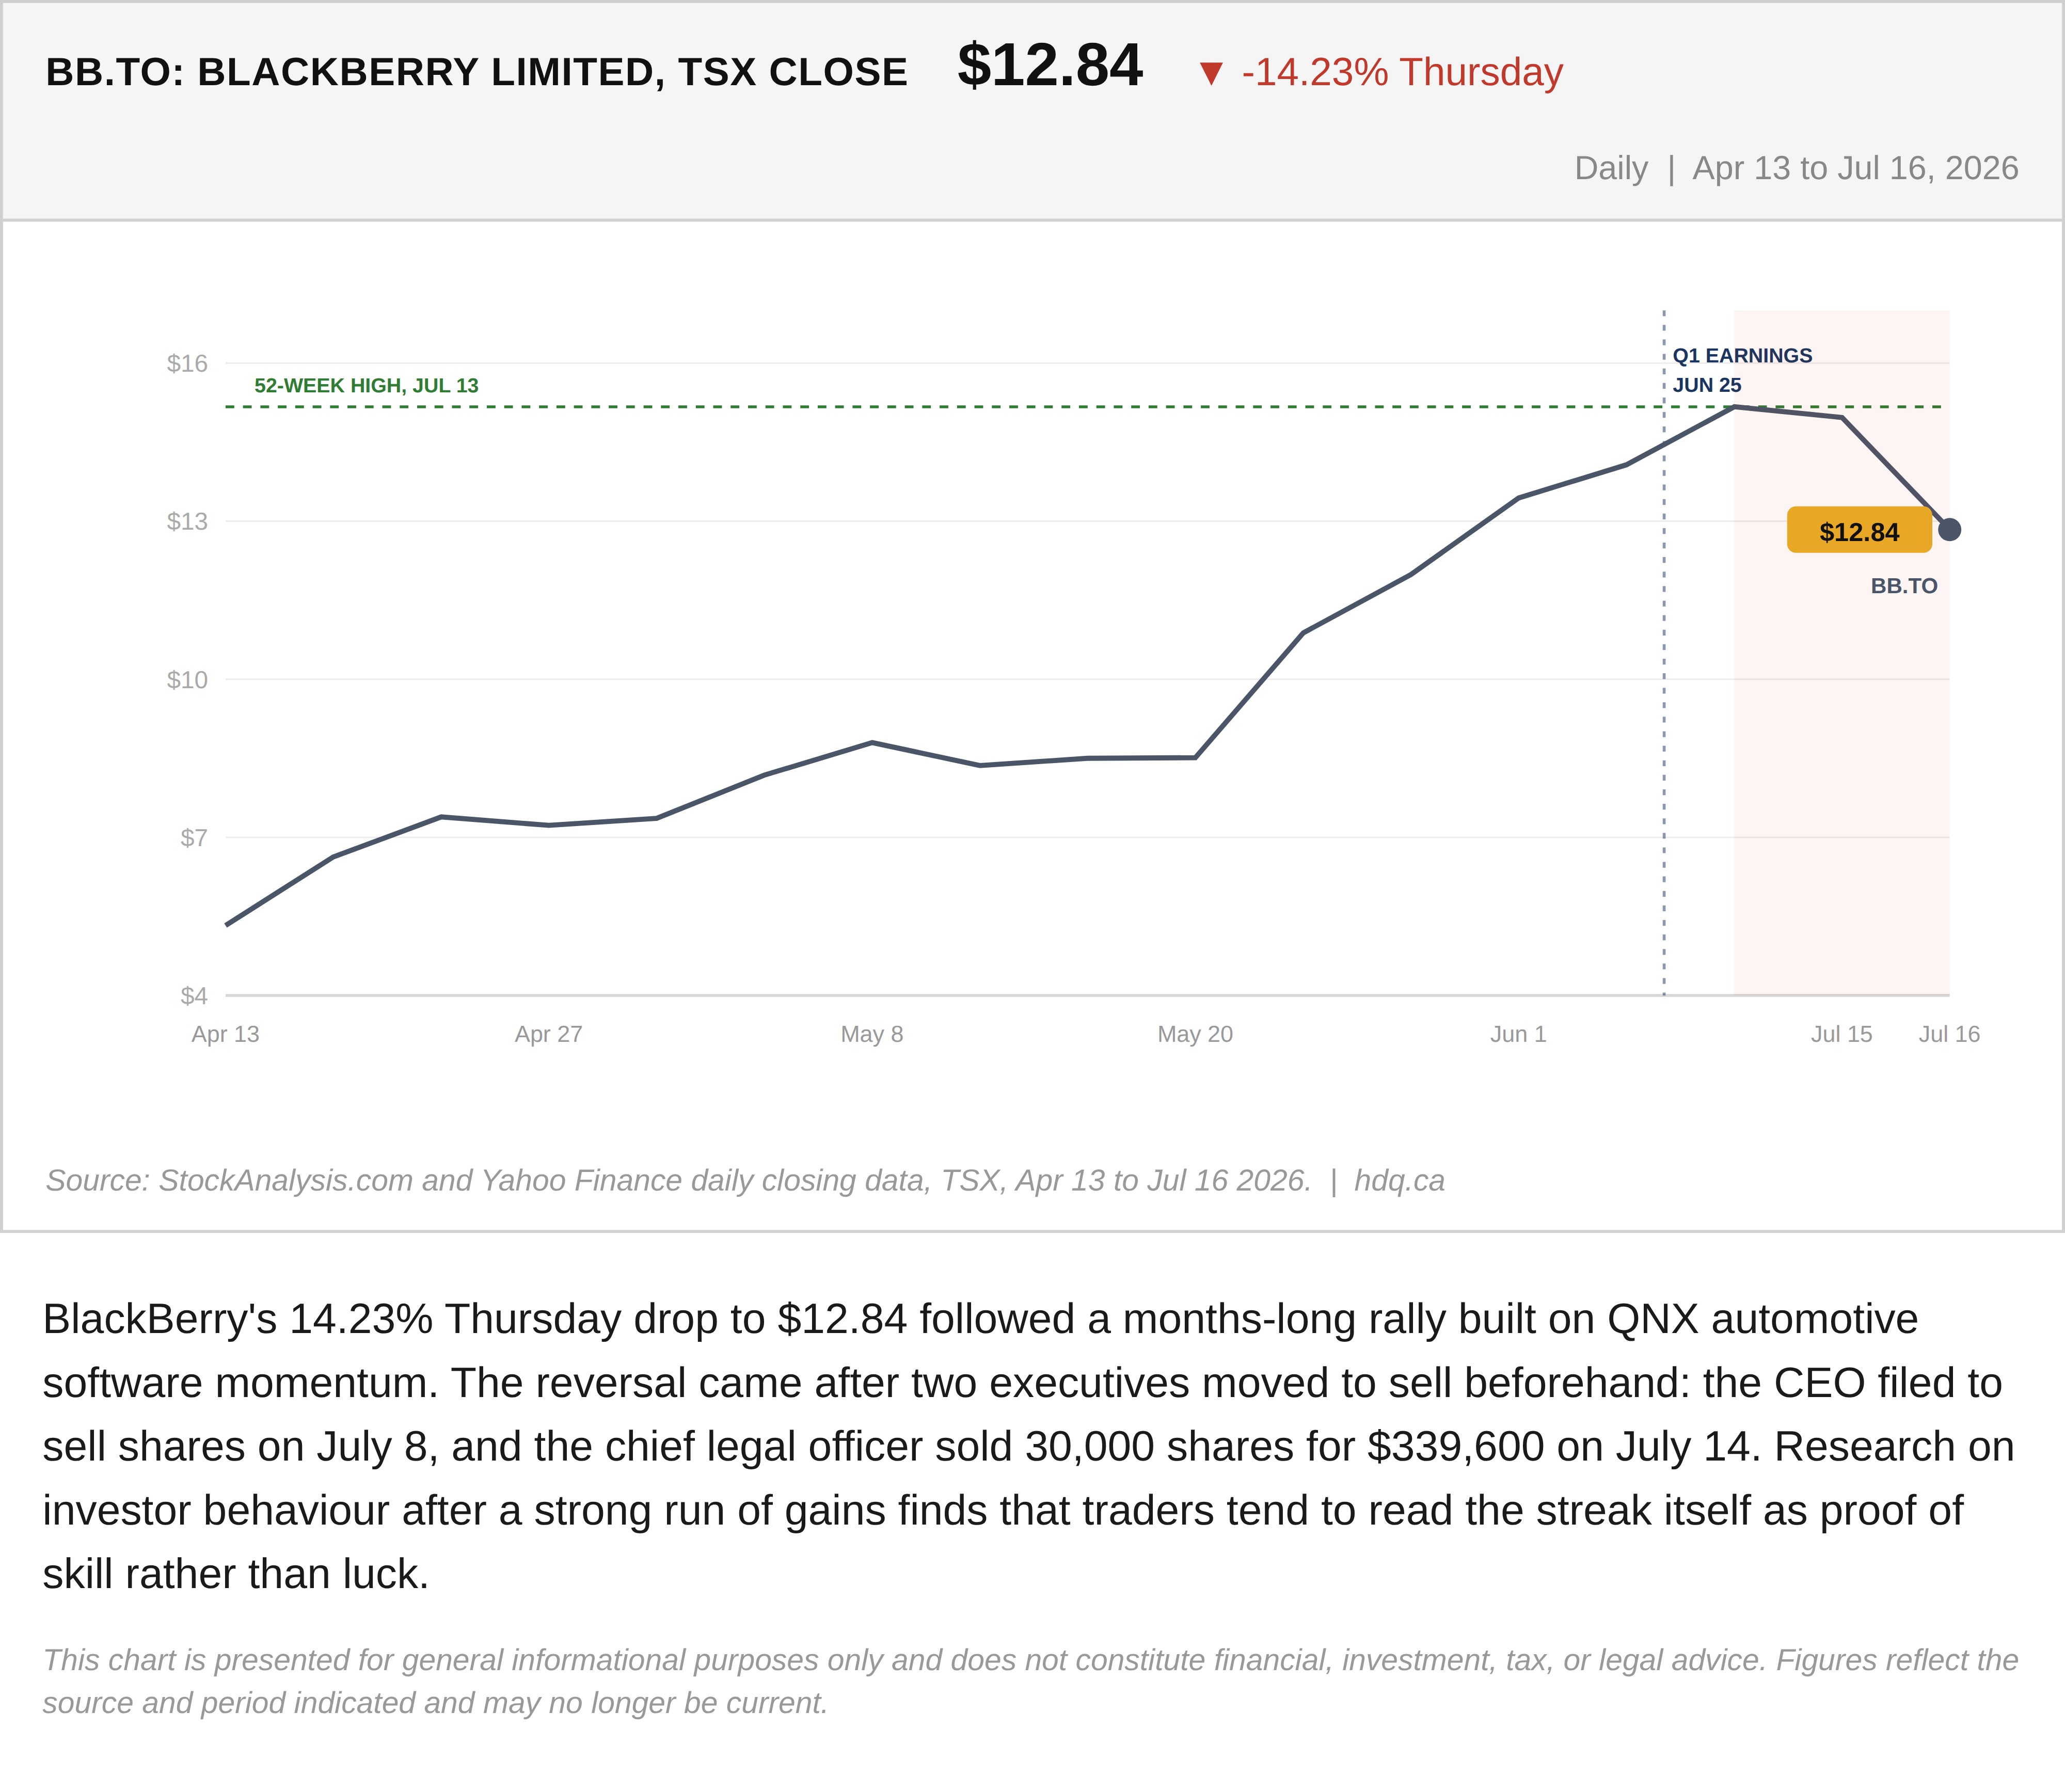
BlackBerry's 14.23% Thursday drop to $12.84 followed a months-long rally built on QNX automotive software momentum. The reversal came after two executives moved to sell beforehand: the CEO filed to sell shares on July 8, and the chief legal officer sold 30,000 shares for $339,600 on July 14. Research on investor behaviour after a strong run of gains finds that traders tend to read the streak itself as proof of skill rather than luck.
This chart is presented for general informational purposes only and does not constitute financial, investment, tax, or legal advice. Figures reflect the source and period indicated and may no longer be current.

Related charts
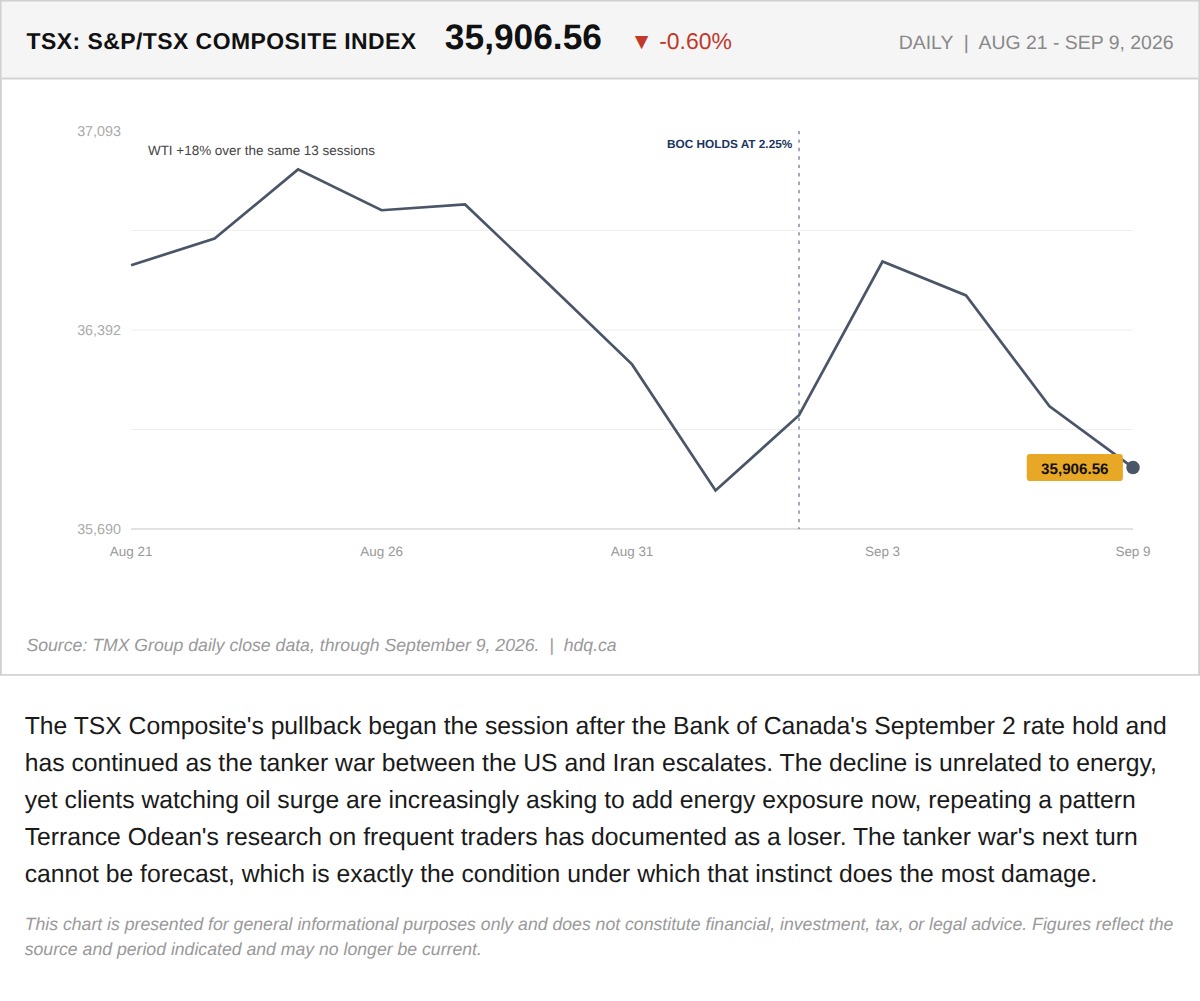
The TSX Composite's pullback began the session after the Bank of Canada's September 2 rate hold and has continued as the tanker war between the US and Iran escalates.
Recency Bias Is Pulling Clients Into the Energy Rally at the Worst Possible Entry Point
September 10, 2026
View chart & download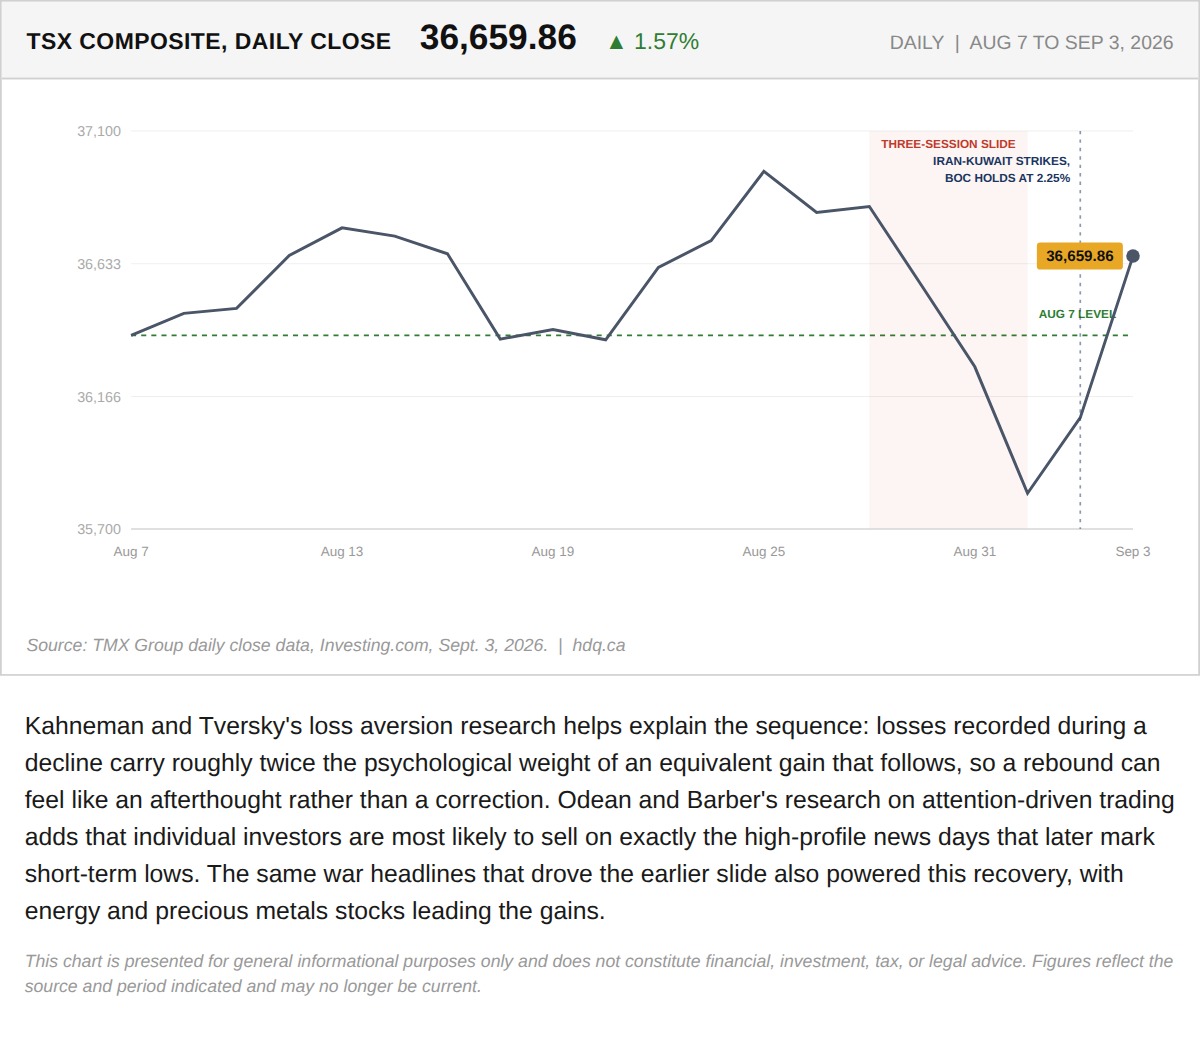
Kahneman and Tversky's loss aversion research helps explain the sequence: losses recorded during a decline carry roughly twice the…
Why the TSX's Two-Day Rebound Is the Most Dangerous Data Point on the Chart
September 4, 2026
View chart & download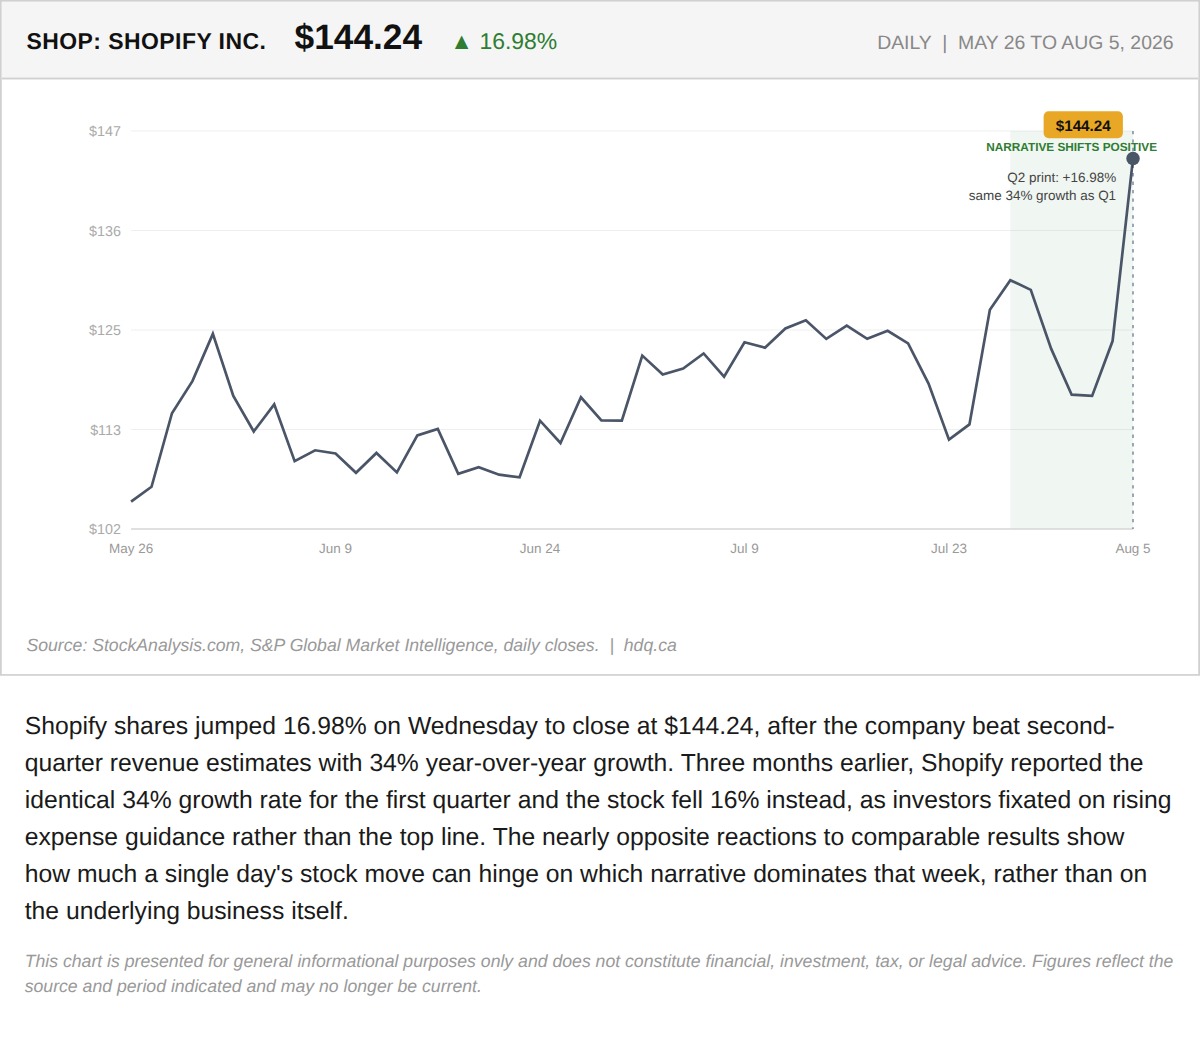
Shopify shares jumped 16.98% on Wednesday to close at $144.24, after the company beat second-quarter revenue estimates with 34% year-over-year growth.
Shopify's Stock Swung 33 Points on Nearly Identical Earnings Reports
August 5, 2026
View chart & download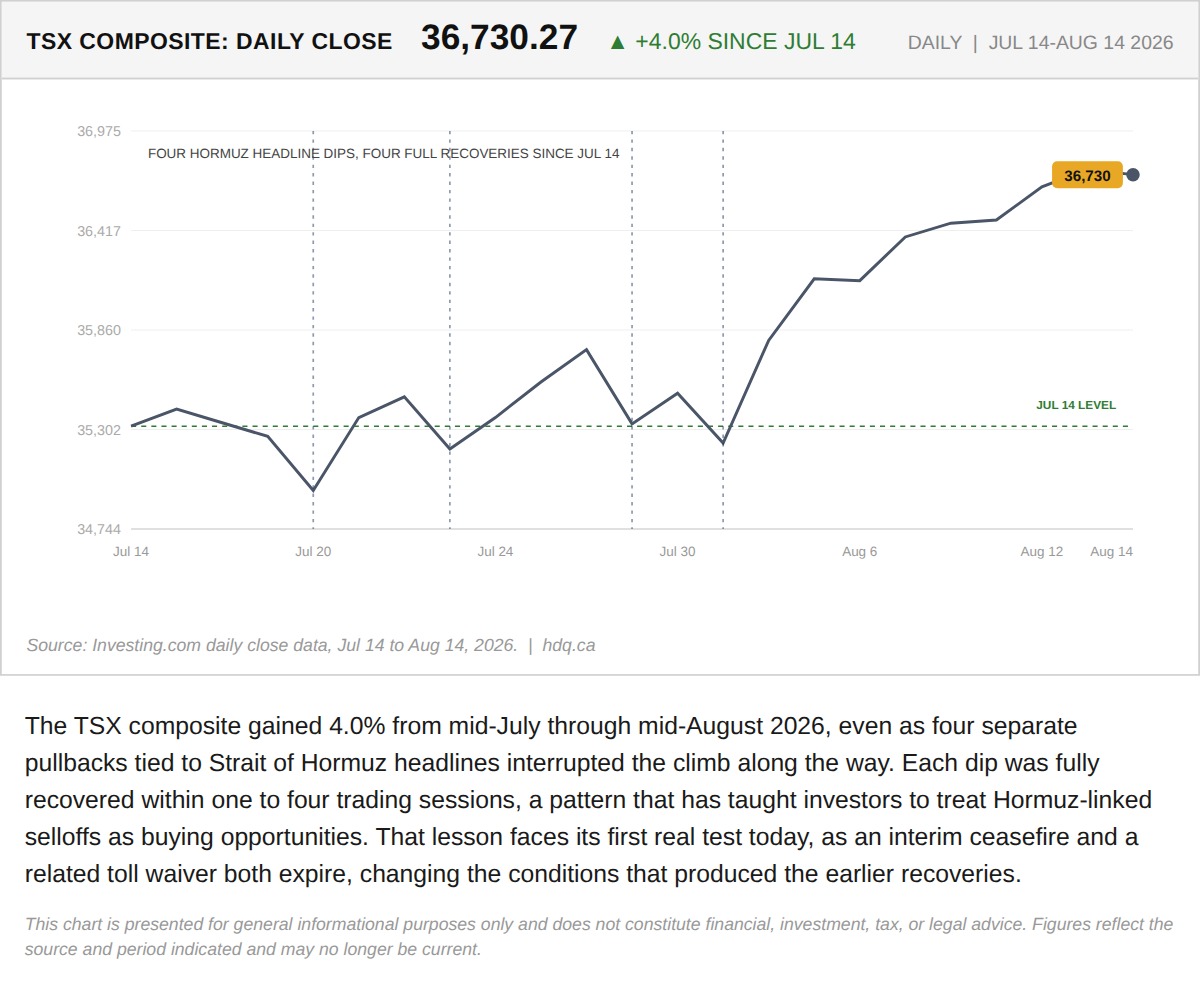
The TSX composite gained 4.0% from mid-July through mid-August 2026, even as four separate pullbacks tied to Strait of Hormuz headlines interrupted the climb along the way.
Four Hormuz Dips Recovered in a Month. Today Tests Whether the Pattern Holds.
August 17, 2026
View chart & download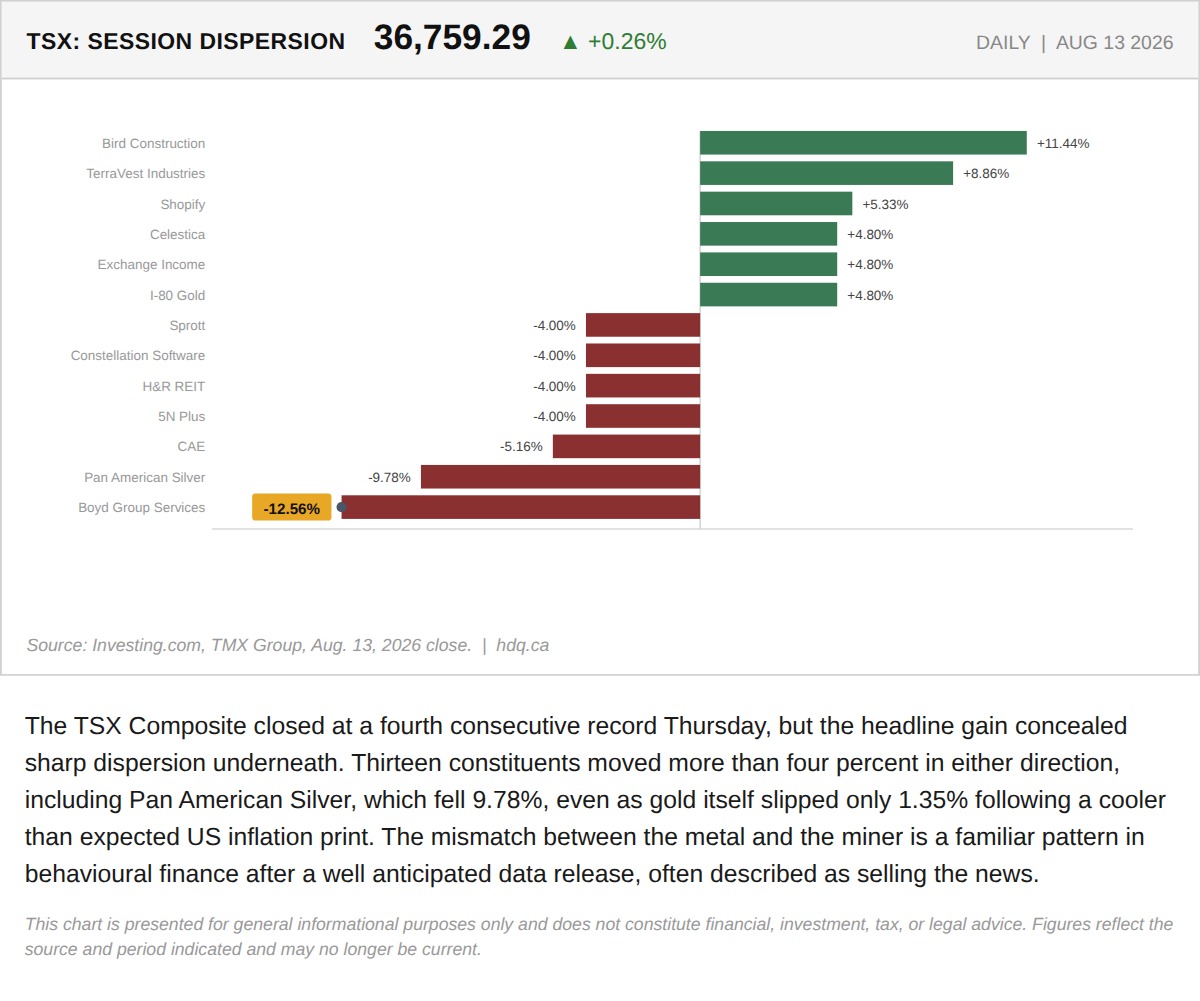
The TSX Composite closed at a fourth consecutive record Thursday, but the headline gain concealed sharp dispersion underneath.
Gold Miners Sold the News on a Record TSX Session
August 14, 2026
View chart & download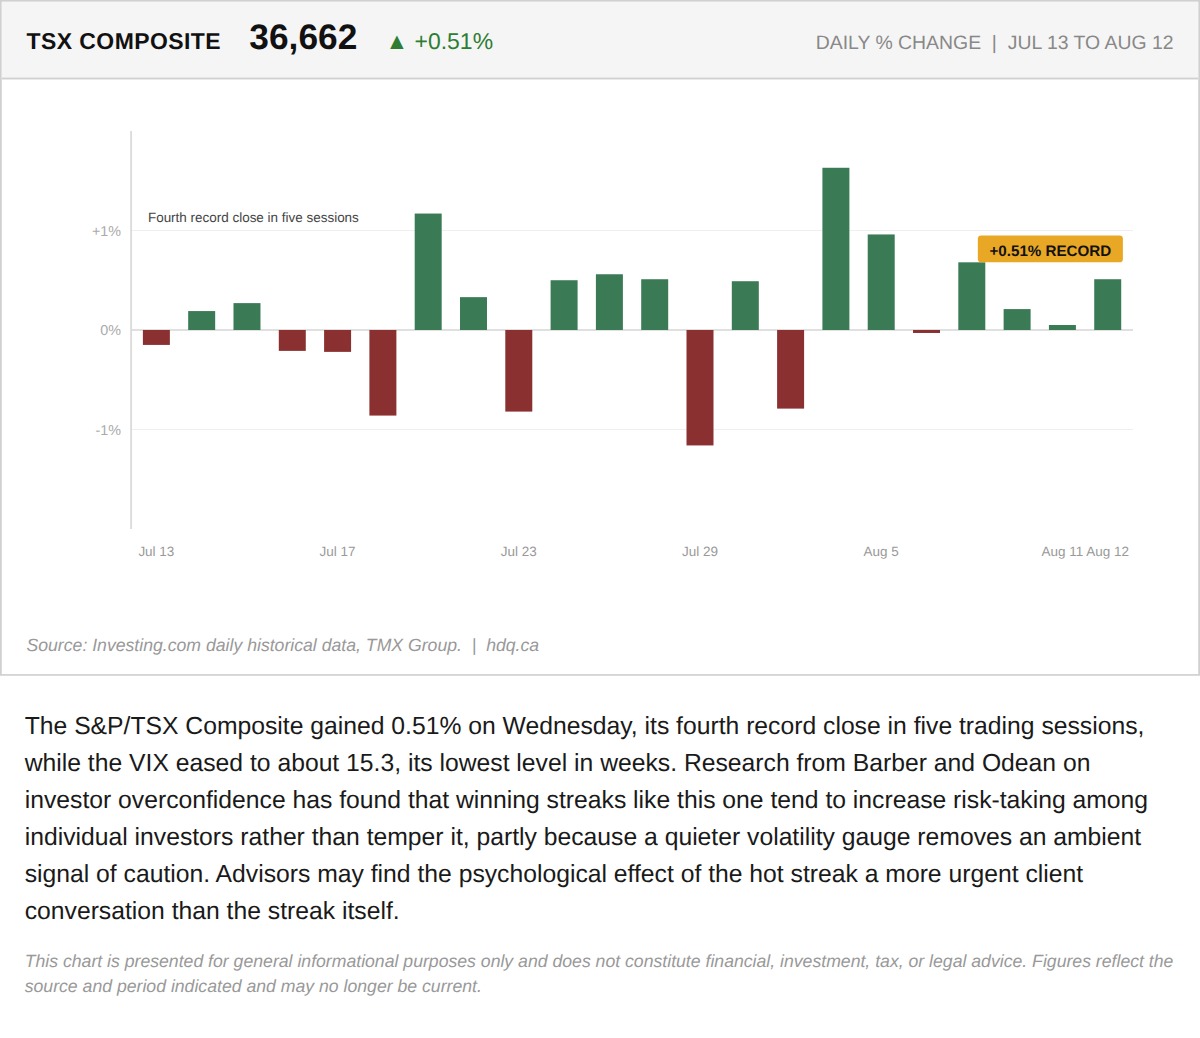
The S&P/TSX Composite gained 0.51% on Wednesday, its fourth record close in five trading sessions, while the VIX eased to about 15.3, its lowest level in weeks.
Overconfidence Is the Real Cost of a Four Session Record Streak
August 13, 2026
View chart & download