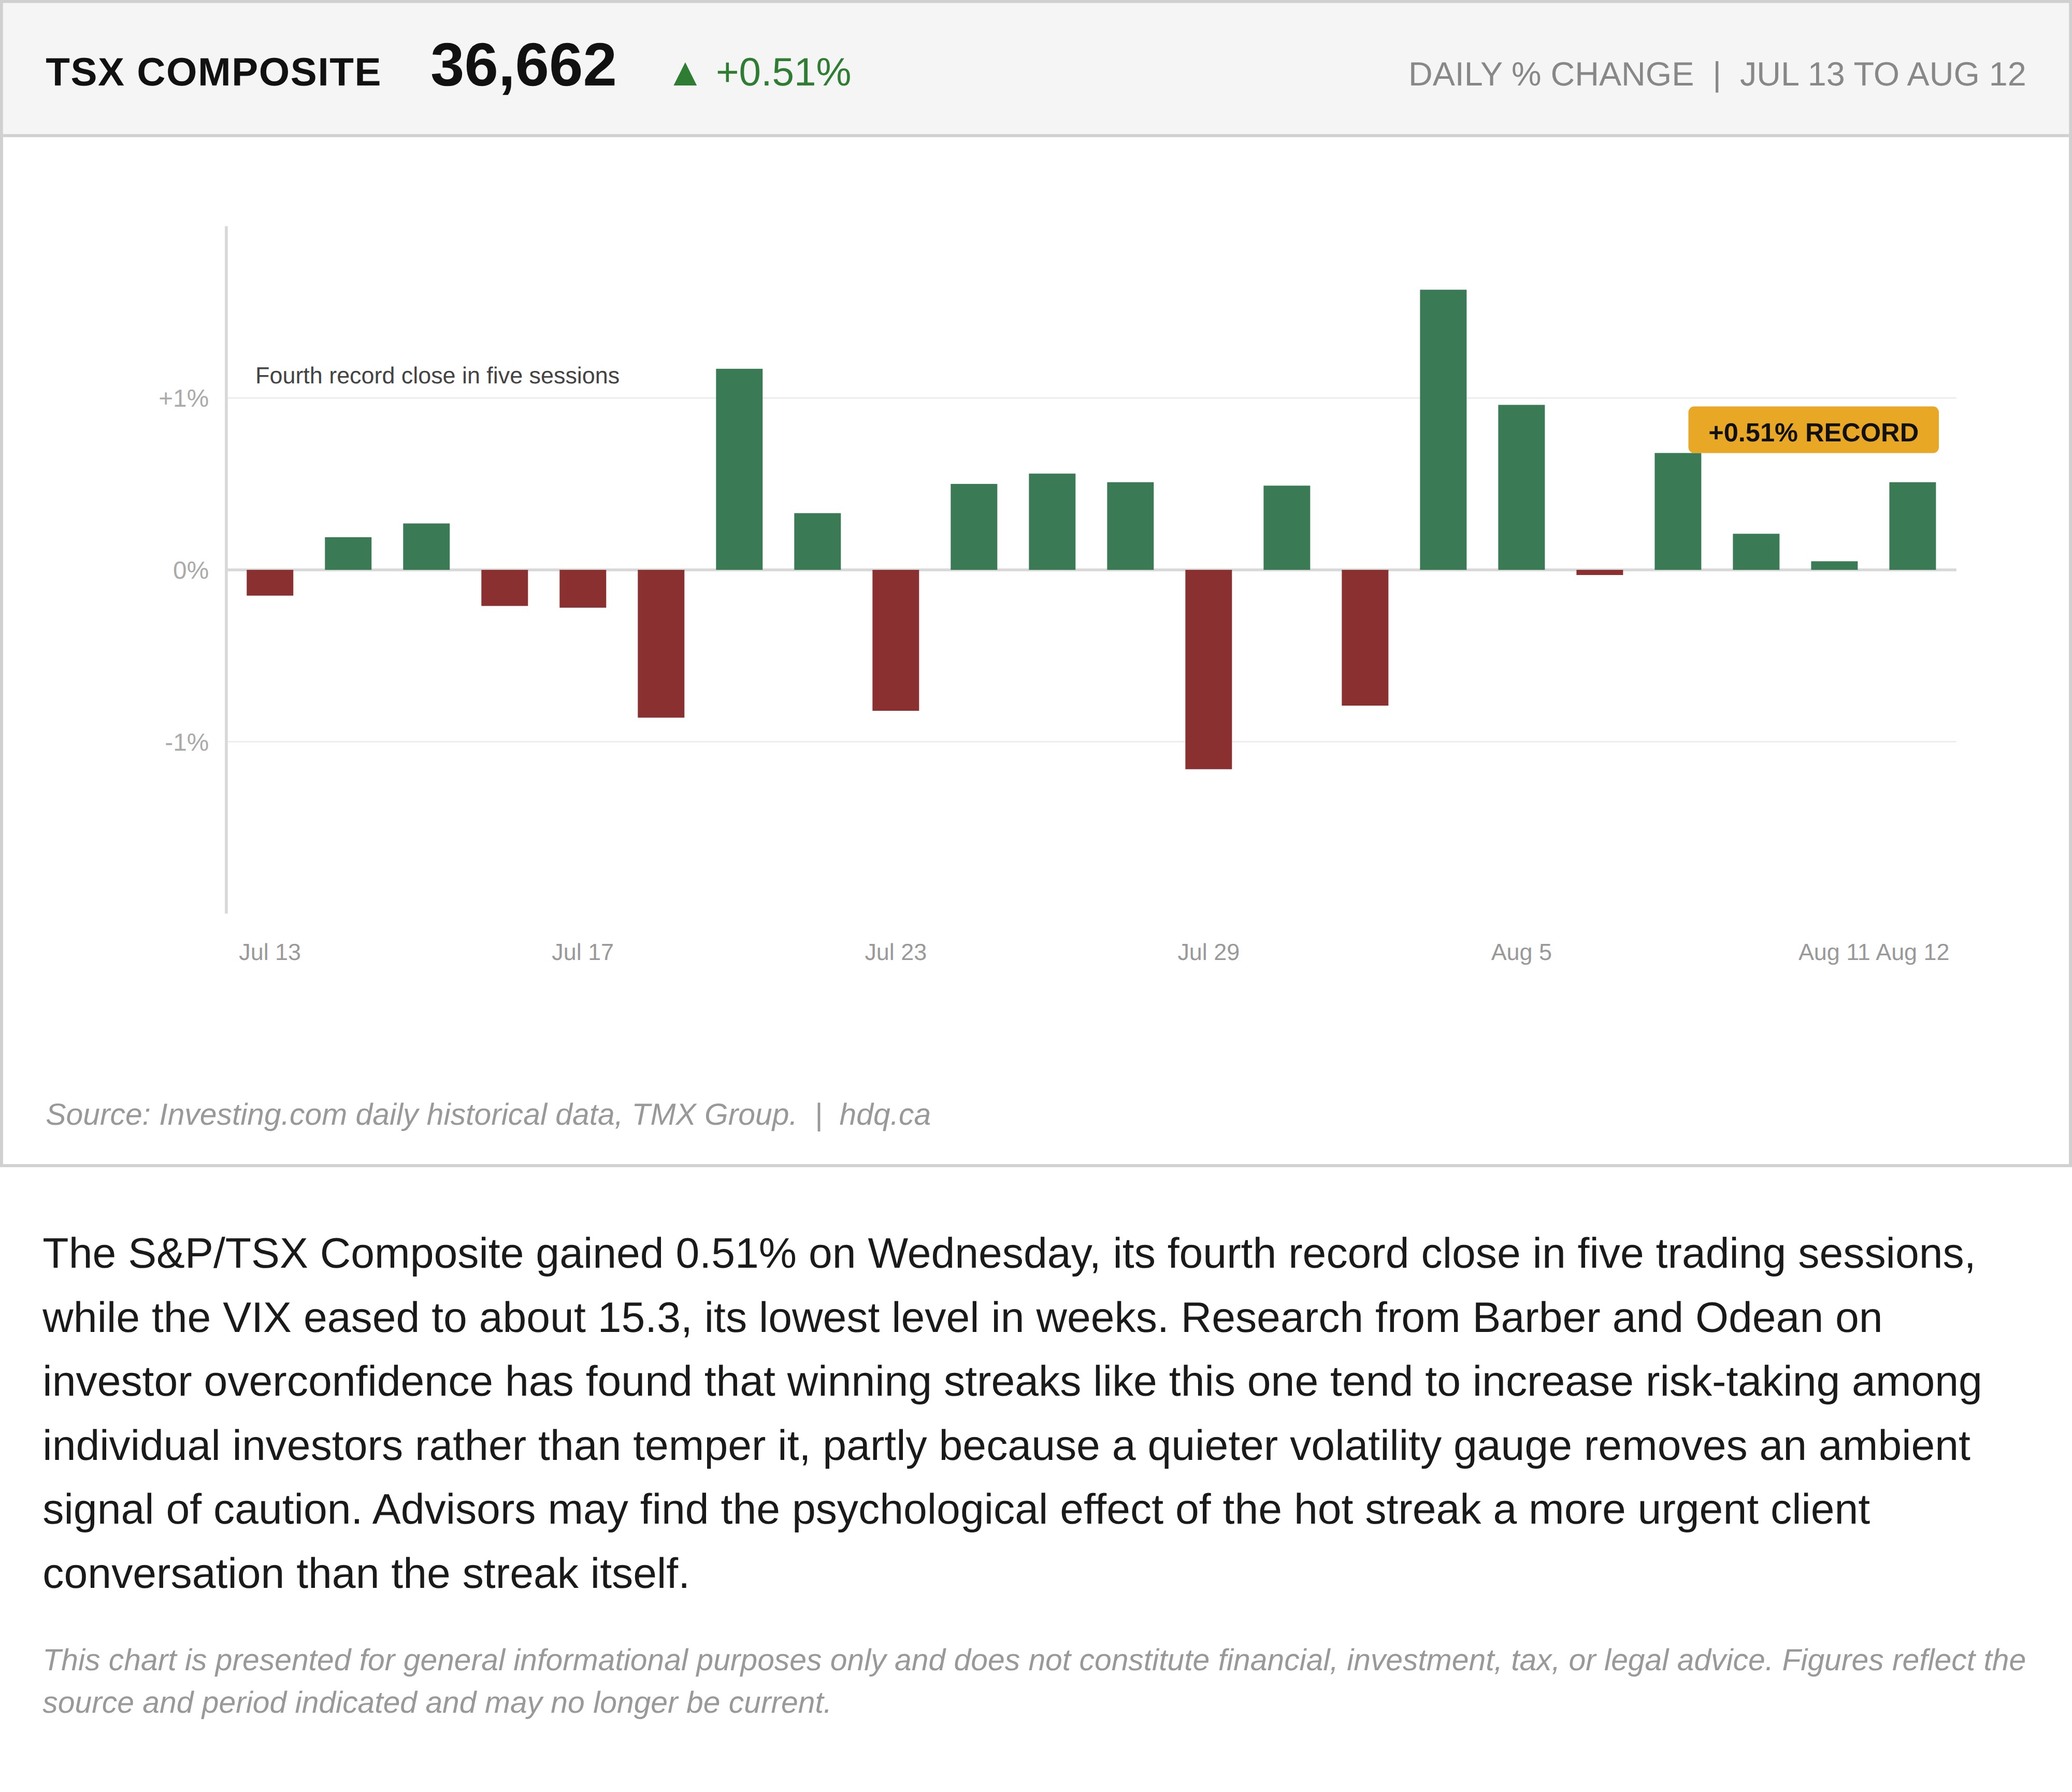
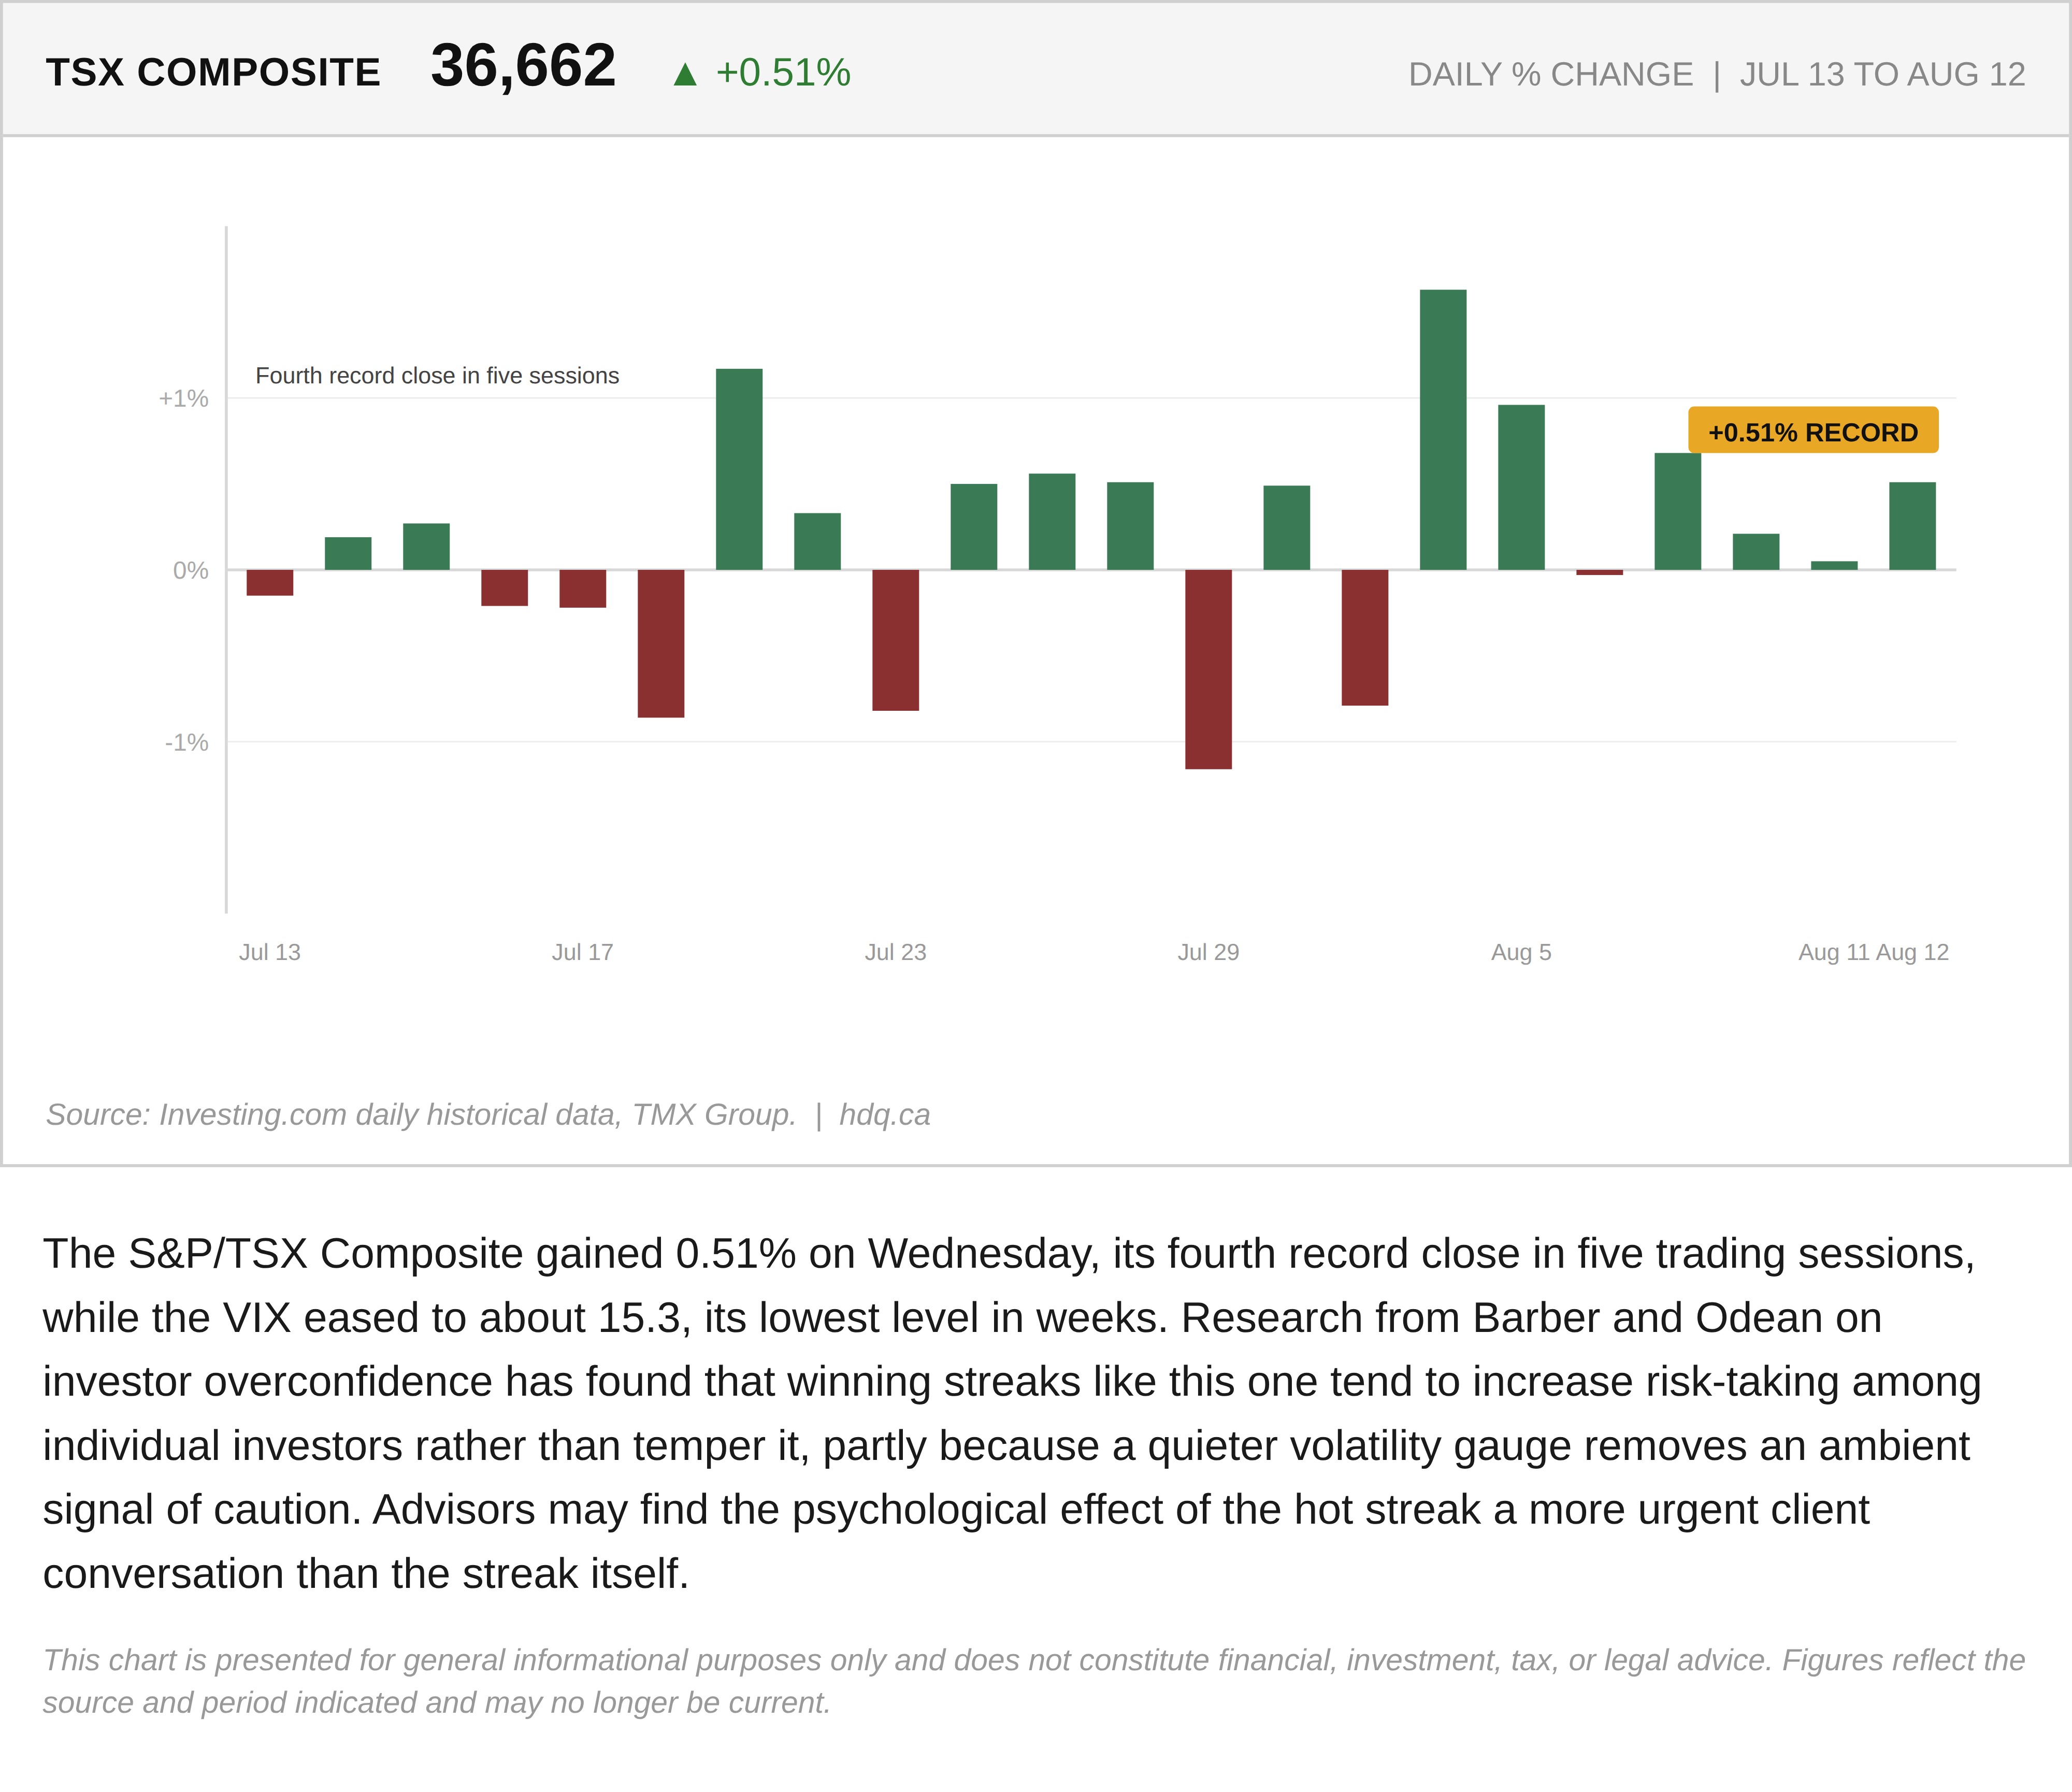
The S&P/TSX Composite gained 0.51% on Wednesday, its fourth record close in five trading sessions, while the VIX eased to about 15.3, its lowest level in weeks. Research from Barber and Odean on investor overconfidence has found that winning streaks like this one tend to increase risk-taking among individual investors rather than temper it, partly because a quieter volatility gauge removes an ambient signal of caution. Advisors may find the psychological effect of the hot streak a more urgent client conversation than the streak itself.
This chart is presented for general informational purposes only and does not constitute financial, investment, tax, or legal advice. Figures reflect the source and period indicated and may no longer be current.
Related charts
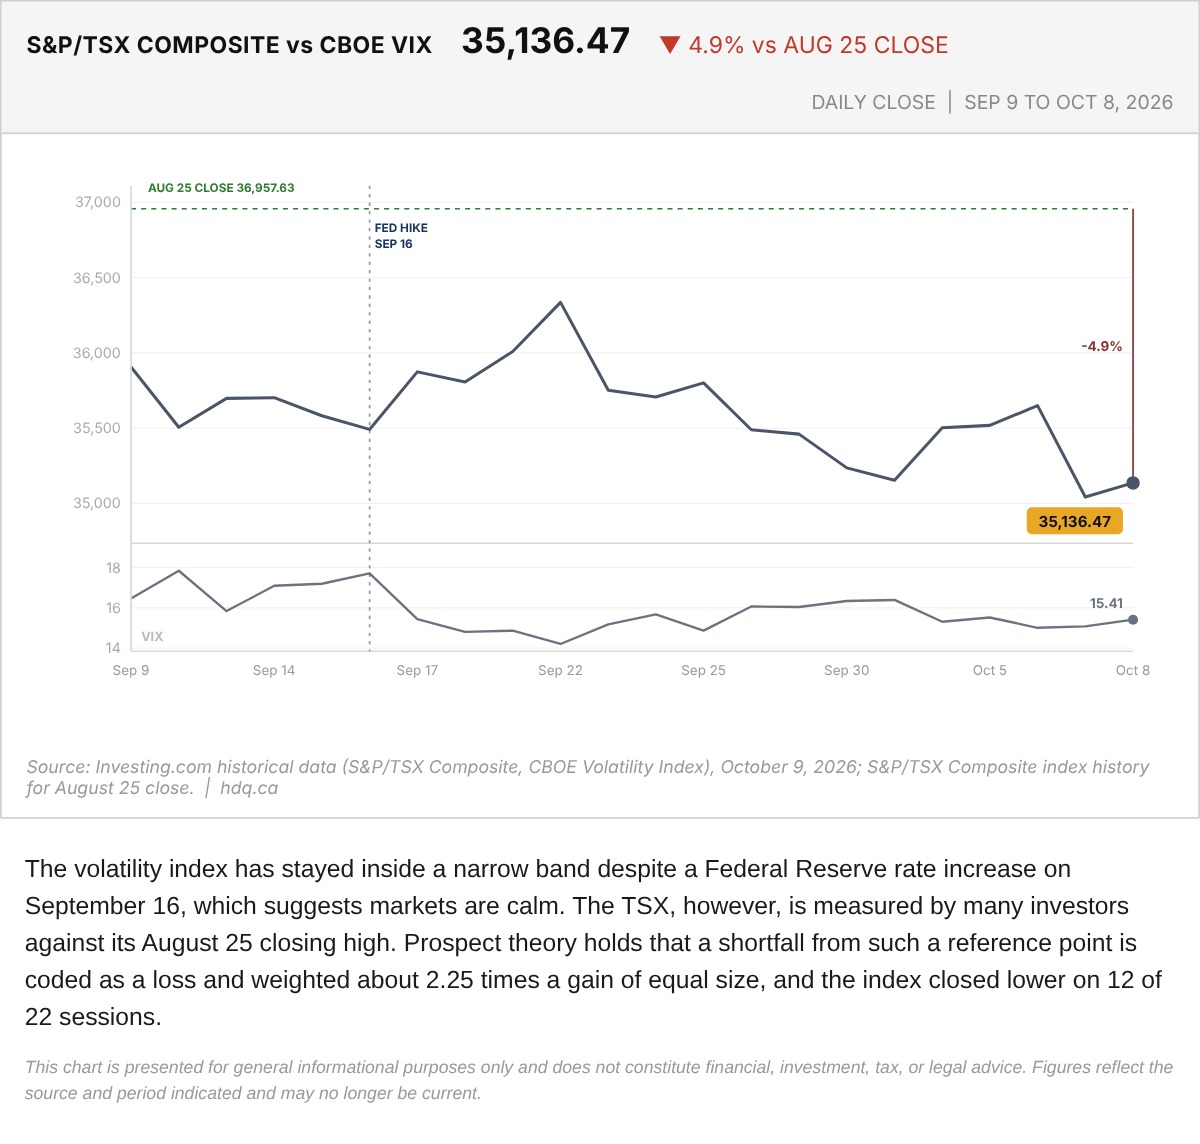
The volatility index has stayed inside a narrow band despite a Federal Reserve rate increase on September 16, which suggests markets are calm.
S&P/TSX Composite Against the Cboe VIX, September 9 to October 8
October 9, 2026
View chart & download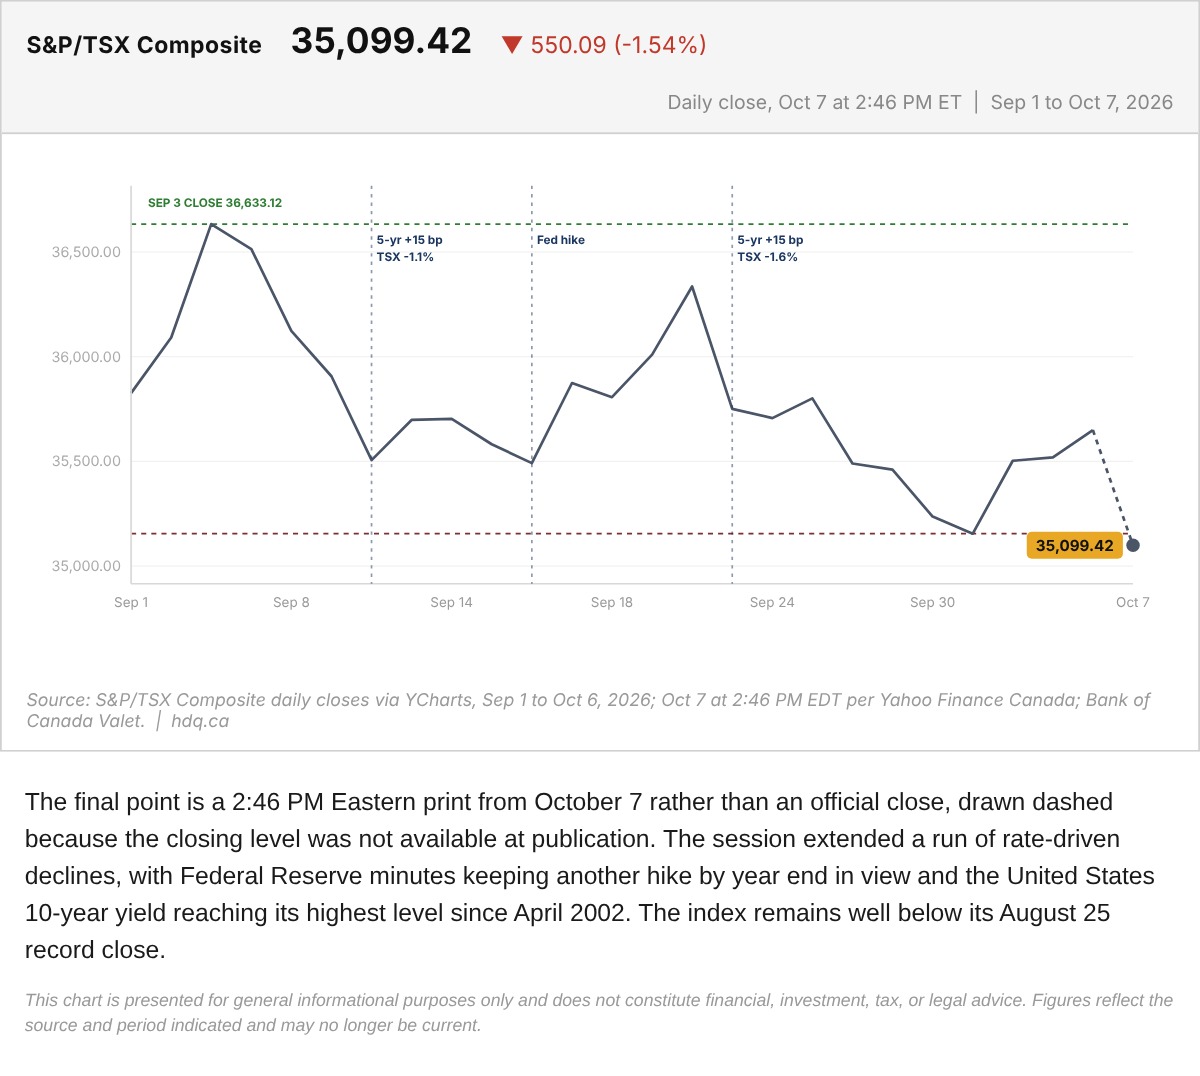
The final point is a 2:46 PM Eastern print from October 7 rather than an official close, drawn dashed because the closing level was not available at publication.
S&P/TSX Composite With the October 7 Midday Print
October 7, 2026
View chart & download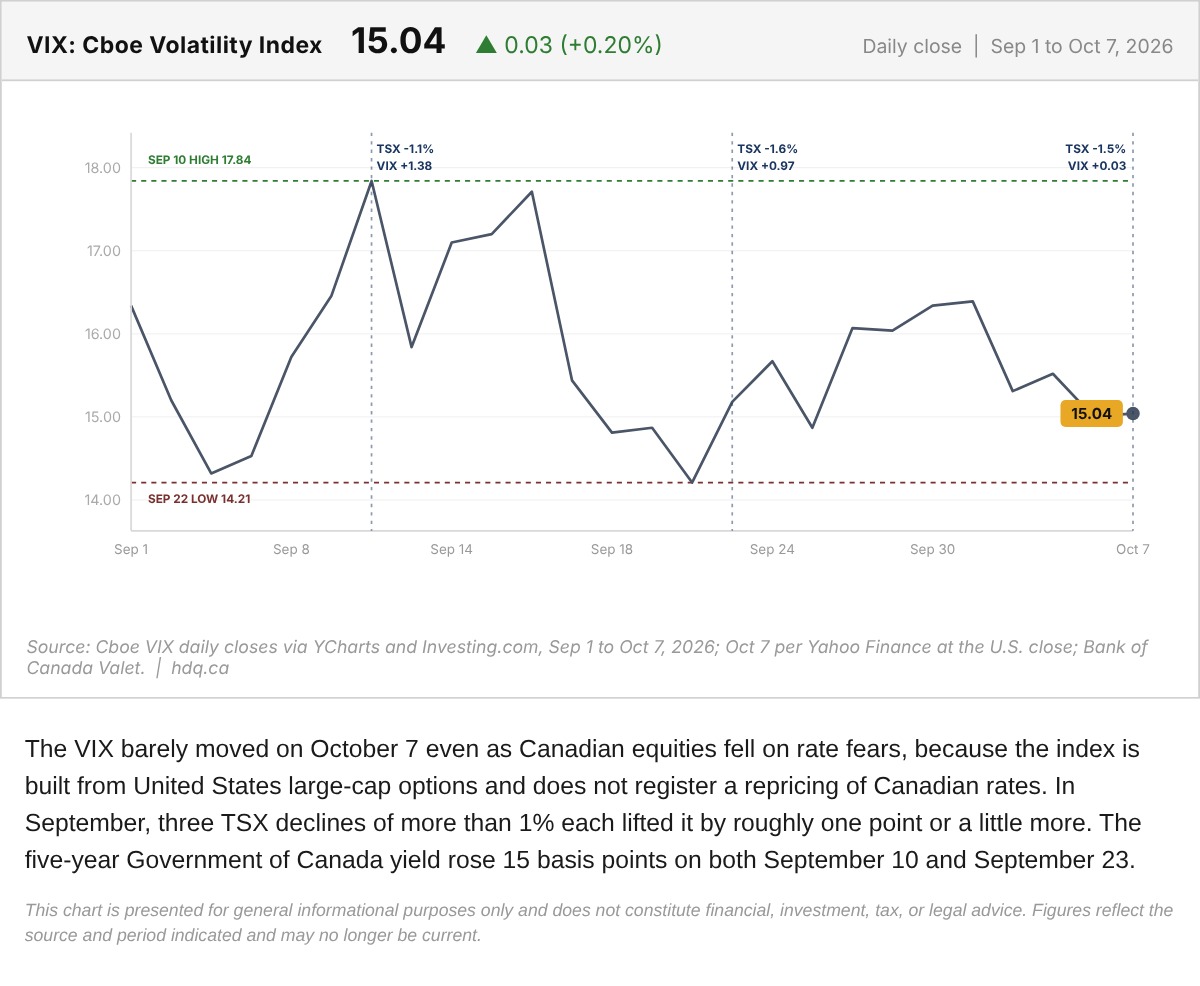
The VIX barely moved on October 7 even as Canadian equities fell on rate fears, because the index is built from United States large-cap…
VIX Daily Close on the Day Rate Fear Hit the TSX
October 7, 2026
View chart & download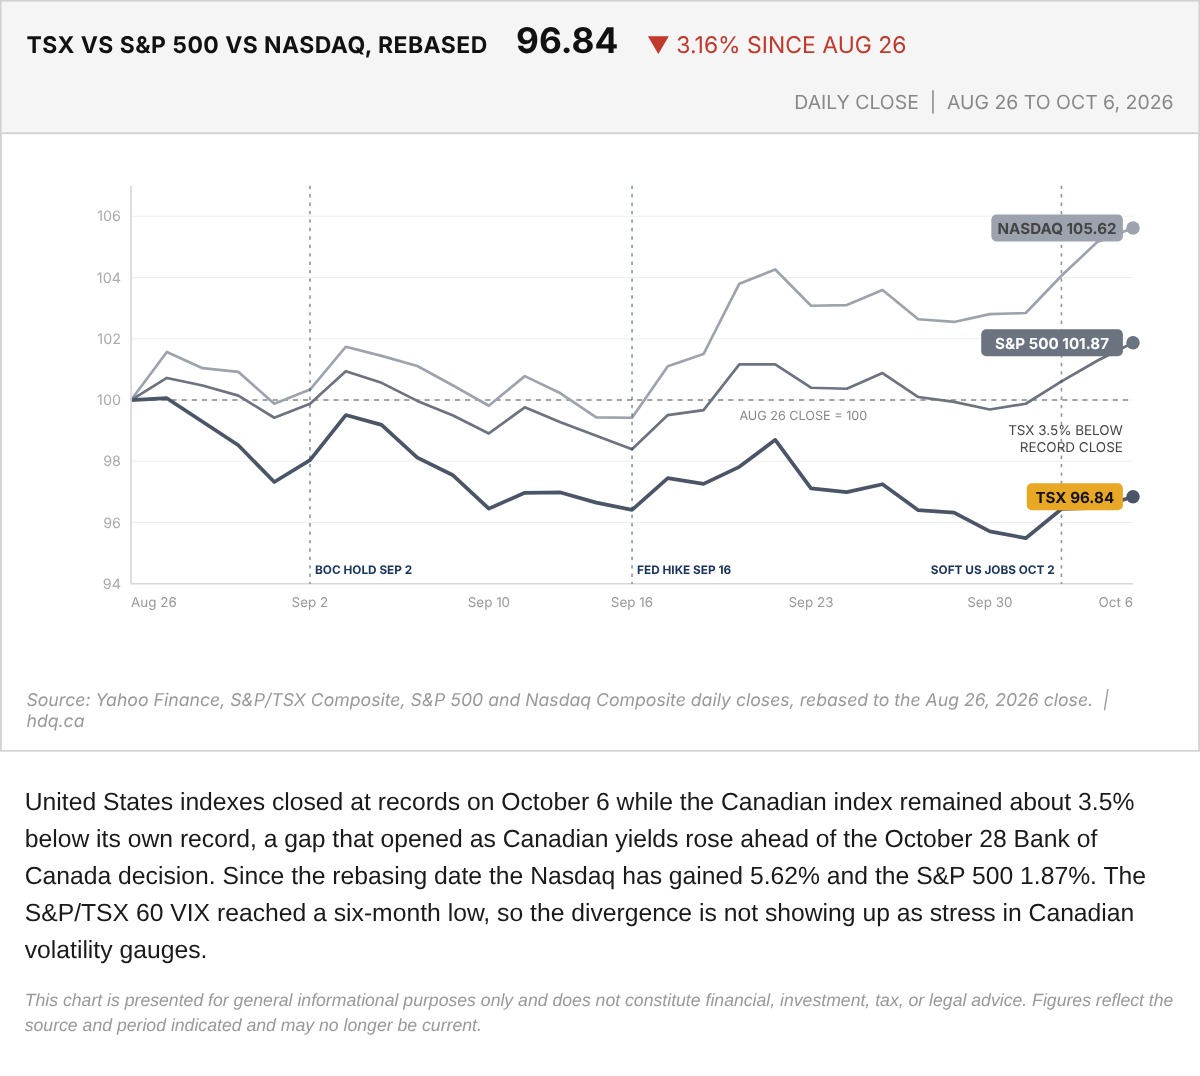
United States indexes closed at records on October 6 while the Canadian index remained about 3.5% below its own record, a gap that opened…
TSX, S&P 500 and Nasdaq Rebased to the August 26 Close
October 7, 2026
View chart & download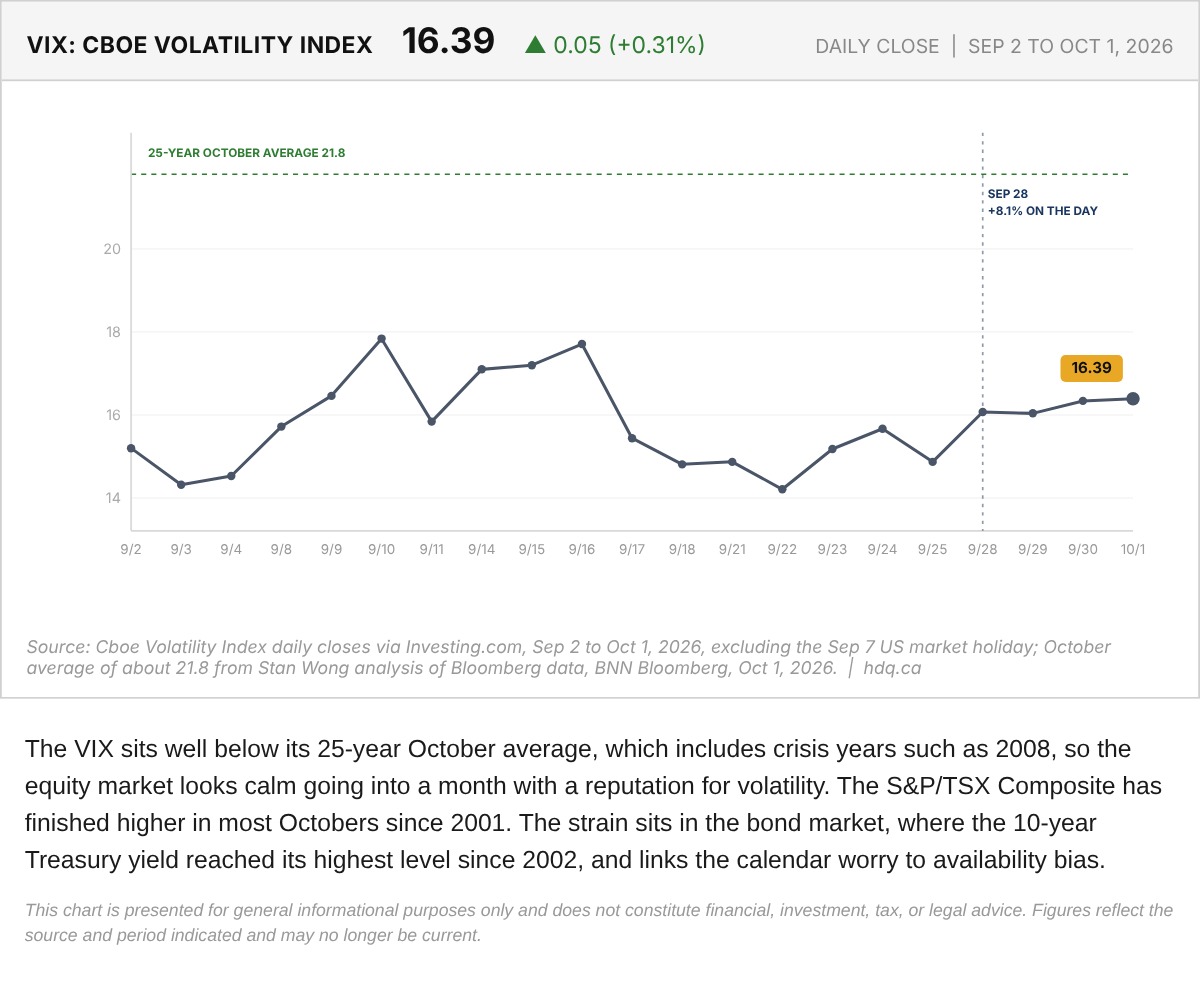
The VIX sits well below its 25-year October average, which includes crisis years such as 2008, so the equity market looks calm going into a month with a reputation for volatility.
Cboe Volatility Index (VIX) and the October Average, September 2 to October 1, 2026
October 2, 2026
View chart & download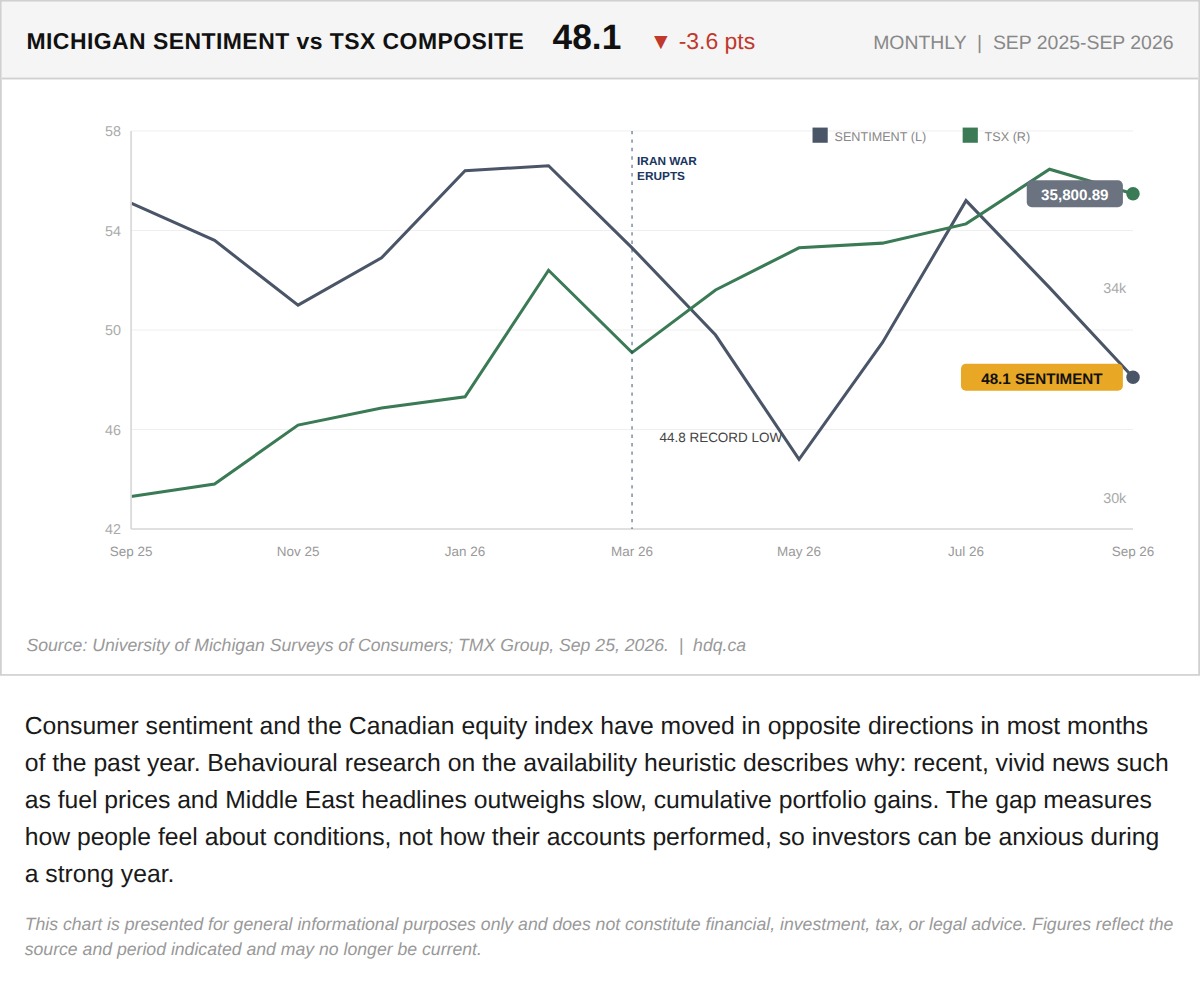
Consumer sentiment and the Canadian equity index have moved in opposite directions in most months of the past year.
Consumer Sentiment Falls While the TSX Rises
September 28, 2026
View chart & download