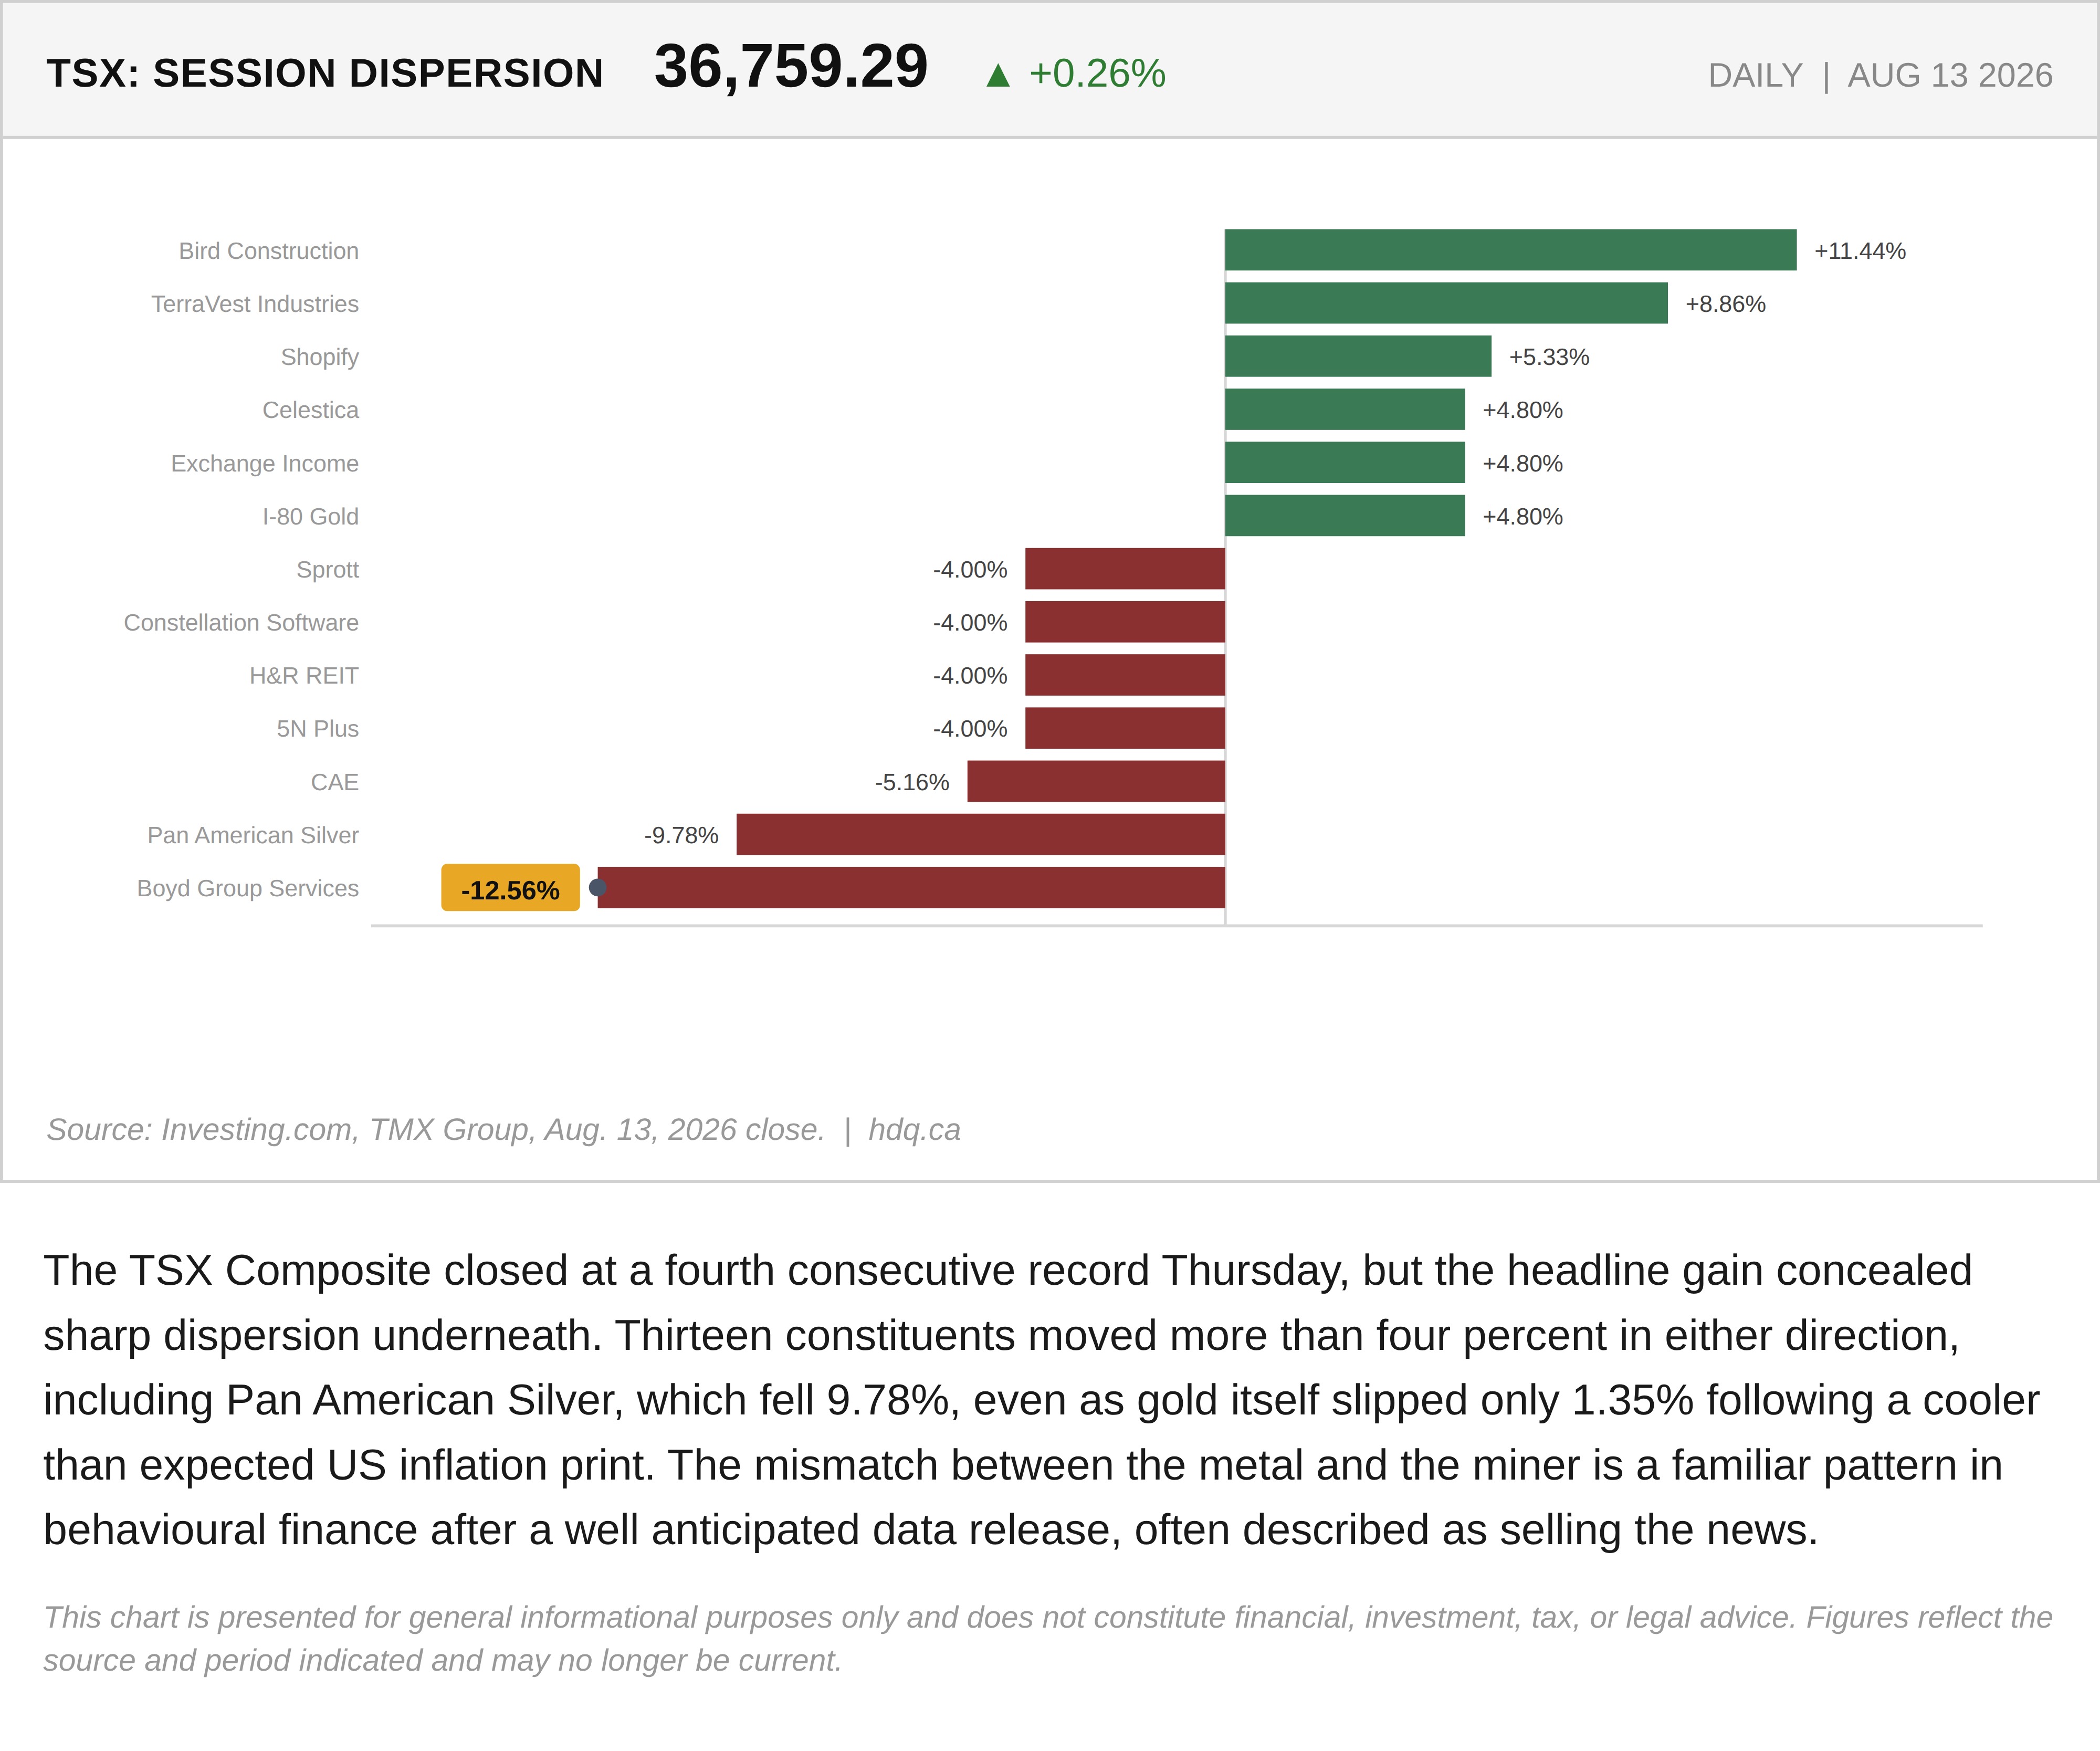
The TSX Composite closed at a fourth consecutive record Thursday, but the headline gain concealed sharp dispersion underneath. Thirteen constituents moved more than four percent in either direction, including Pan American Silver, which fell 9.78%, even as gold itself slipped only 1.35% following a cooler than expected US inflation print. The mismatch between the metal and the miner is a familiar pattern in behavioural finance after a well anticipated data release, often described as selling the news.
This chart is presented for general informational purposes only and does not constitute financial, investment, tax, or legal advice. Figures reflect the source and period indicated and may no longer be current.
Related charts
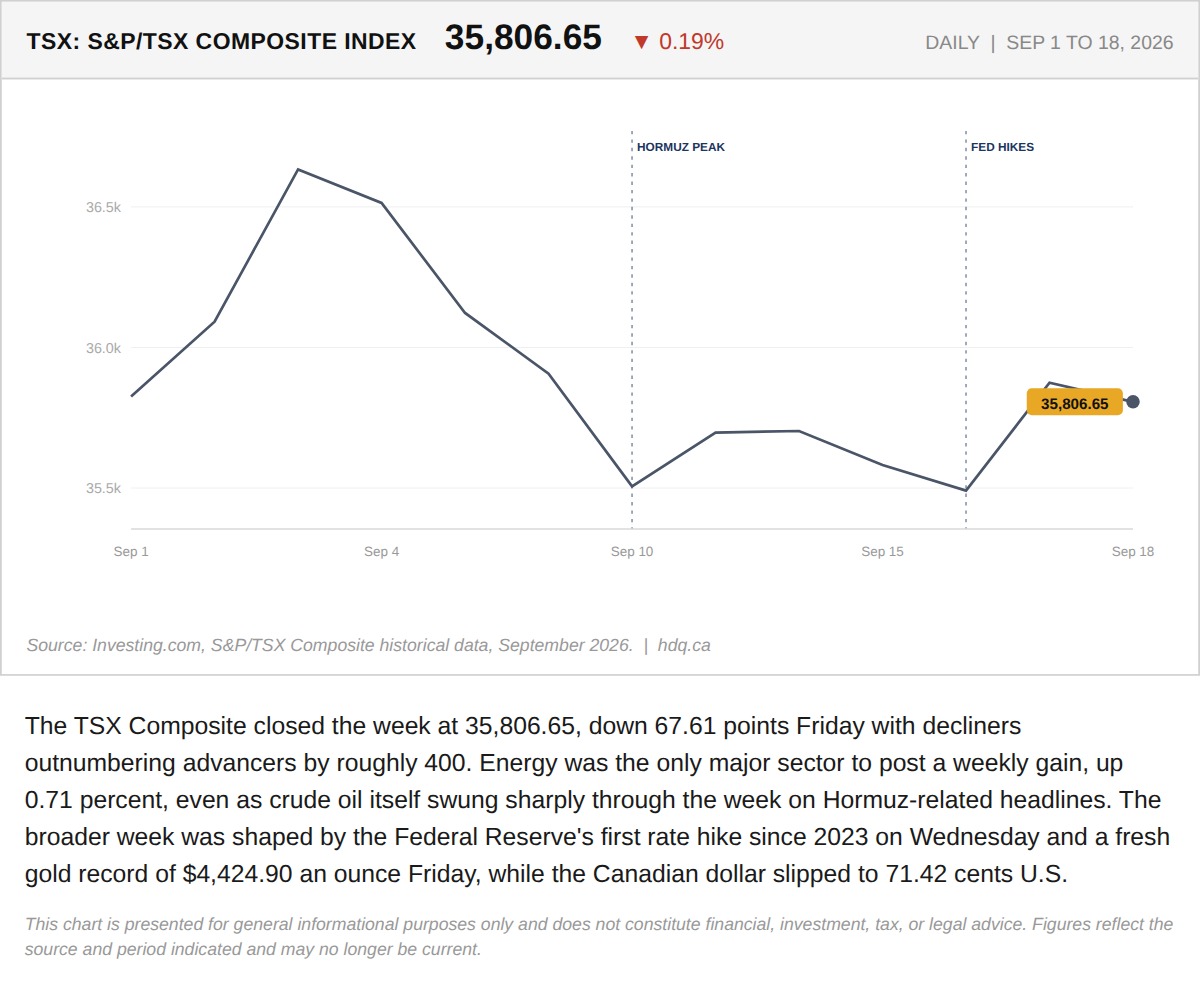
The TSX Composite closed the week at 35,806.65, down 67.61 points Friday with decliners outnumbering advancers by roughly 400.
The TSX Closed a Volatile Week at 35,806.65. Energy Was the Only Sector That Actually Held.
September 21, 2026
View chart & download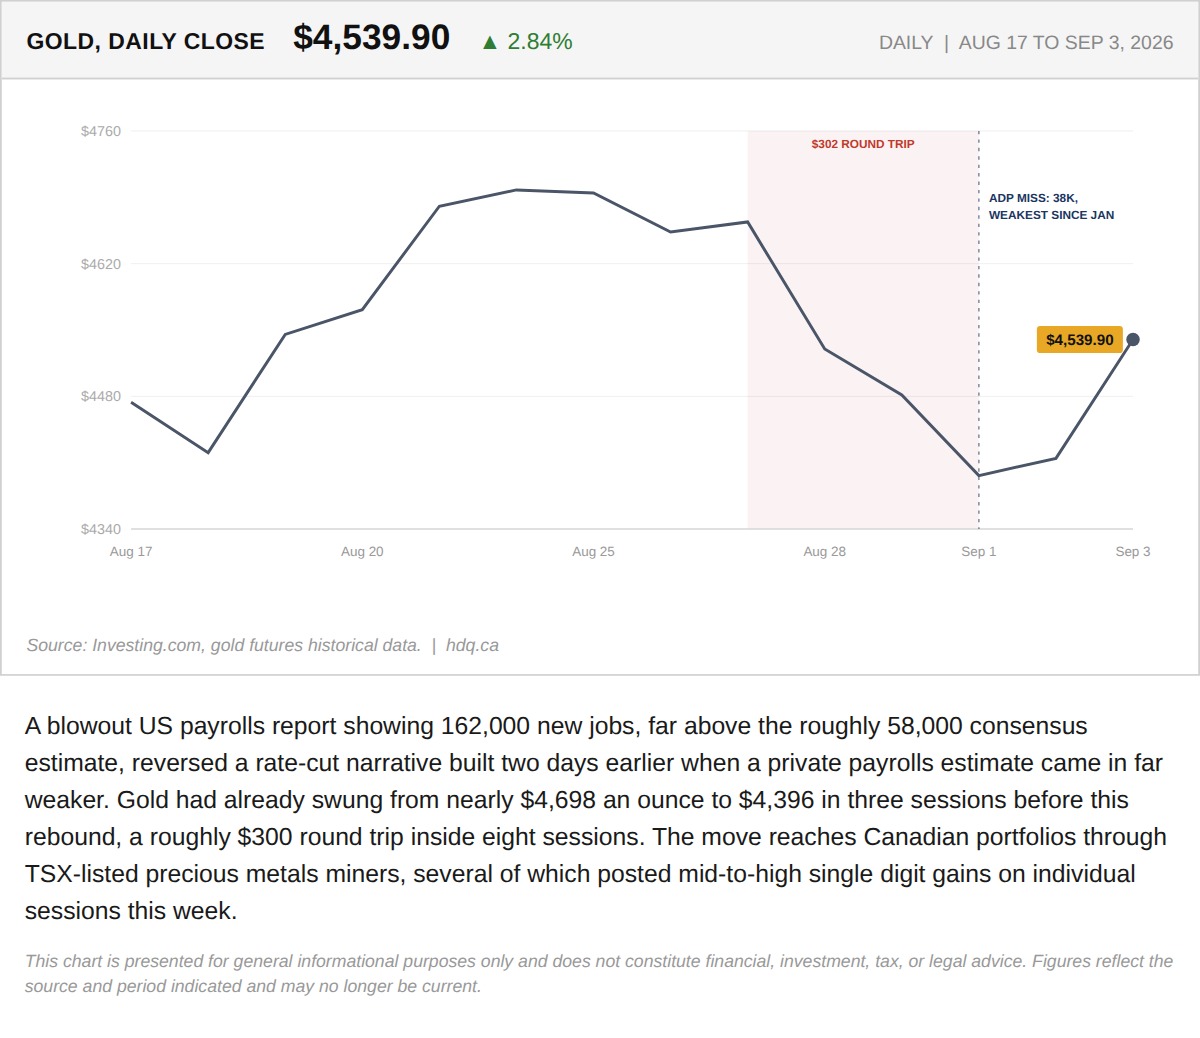
A blowout US payrolls report showing 162,000 new jobs, far above the roughly 58,000 consensus estimate, reversed a rate-cut narrative built…
September 4, 2026
View chart & download
Brent was the only one of the three to finish above its starting level, while the index and gold both fell.
Brent, TSX and Gold Rebased to the August 31 Close
September 30, 2026
View chart & download
The Bank of Canada held its policy rate at 2.25% for a seventh straight time, yet Canadian yields rose as United States yields surged.
Government of Canada Benchmark Yields, September 2026
September 30, 2026
View chart & download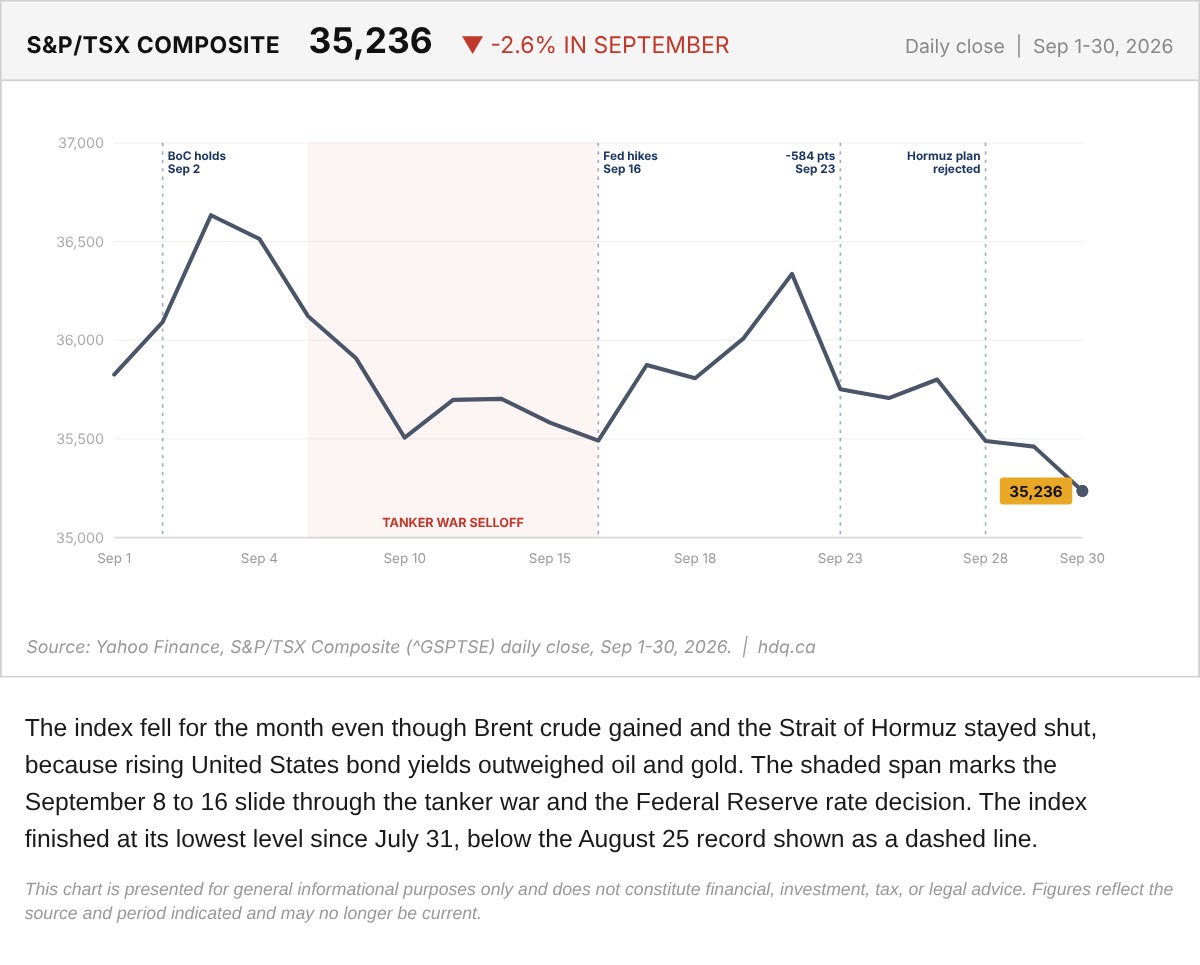
The index fell for the month even though Brent crude gained and the Strait of Hormuz stayed shut, because rising United States bond yields outweighed oil and gold.
S&P/TSX Composite Daily Close Through September 2026
September 30, 2026
View chart & download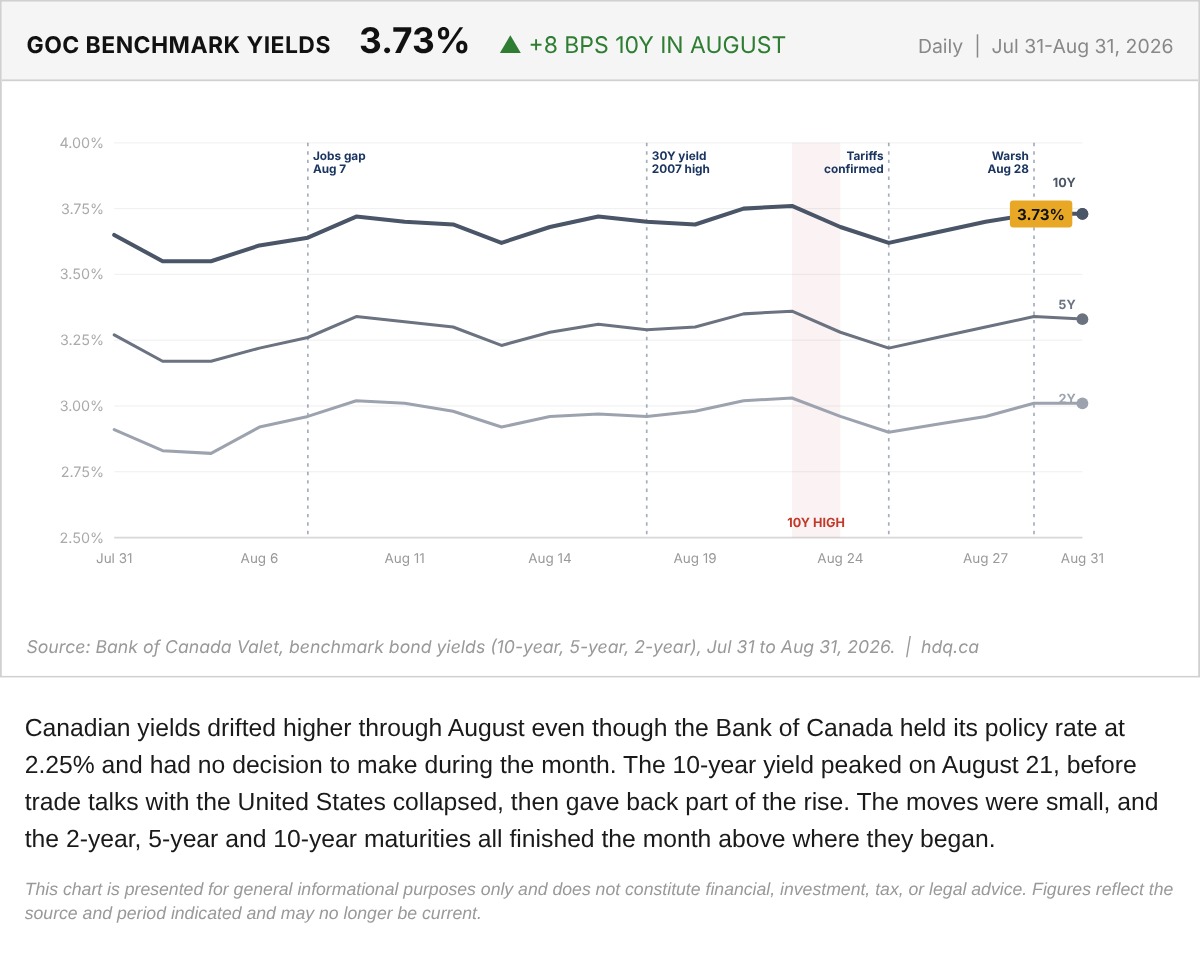
Canadian yields drifted higher through August even though the Bank of Canada held its policy rate at 2.25% and had no decision to make during the month.
Government of Canada Benchmark Yields, August 2026
August 31, 2026
View chart & download