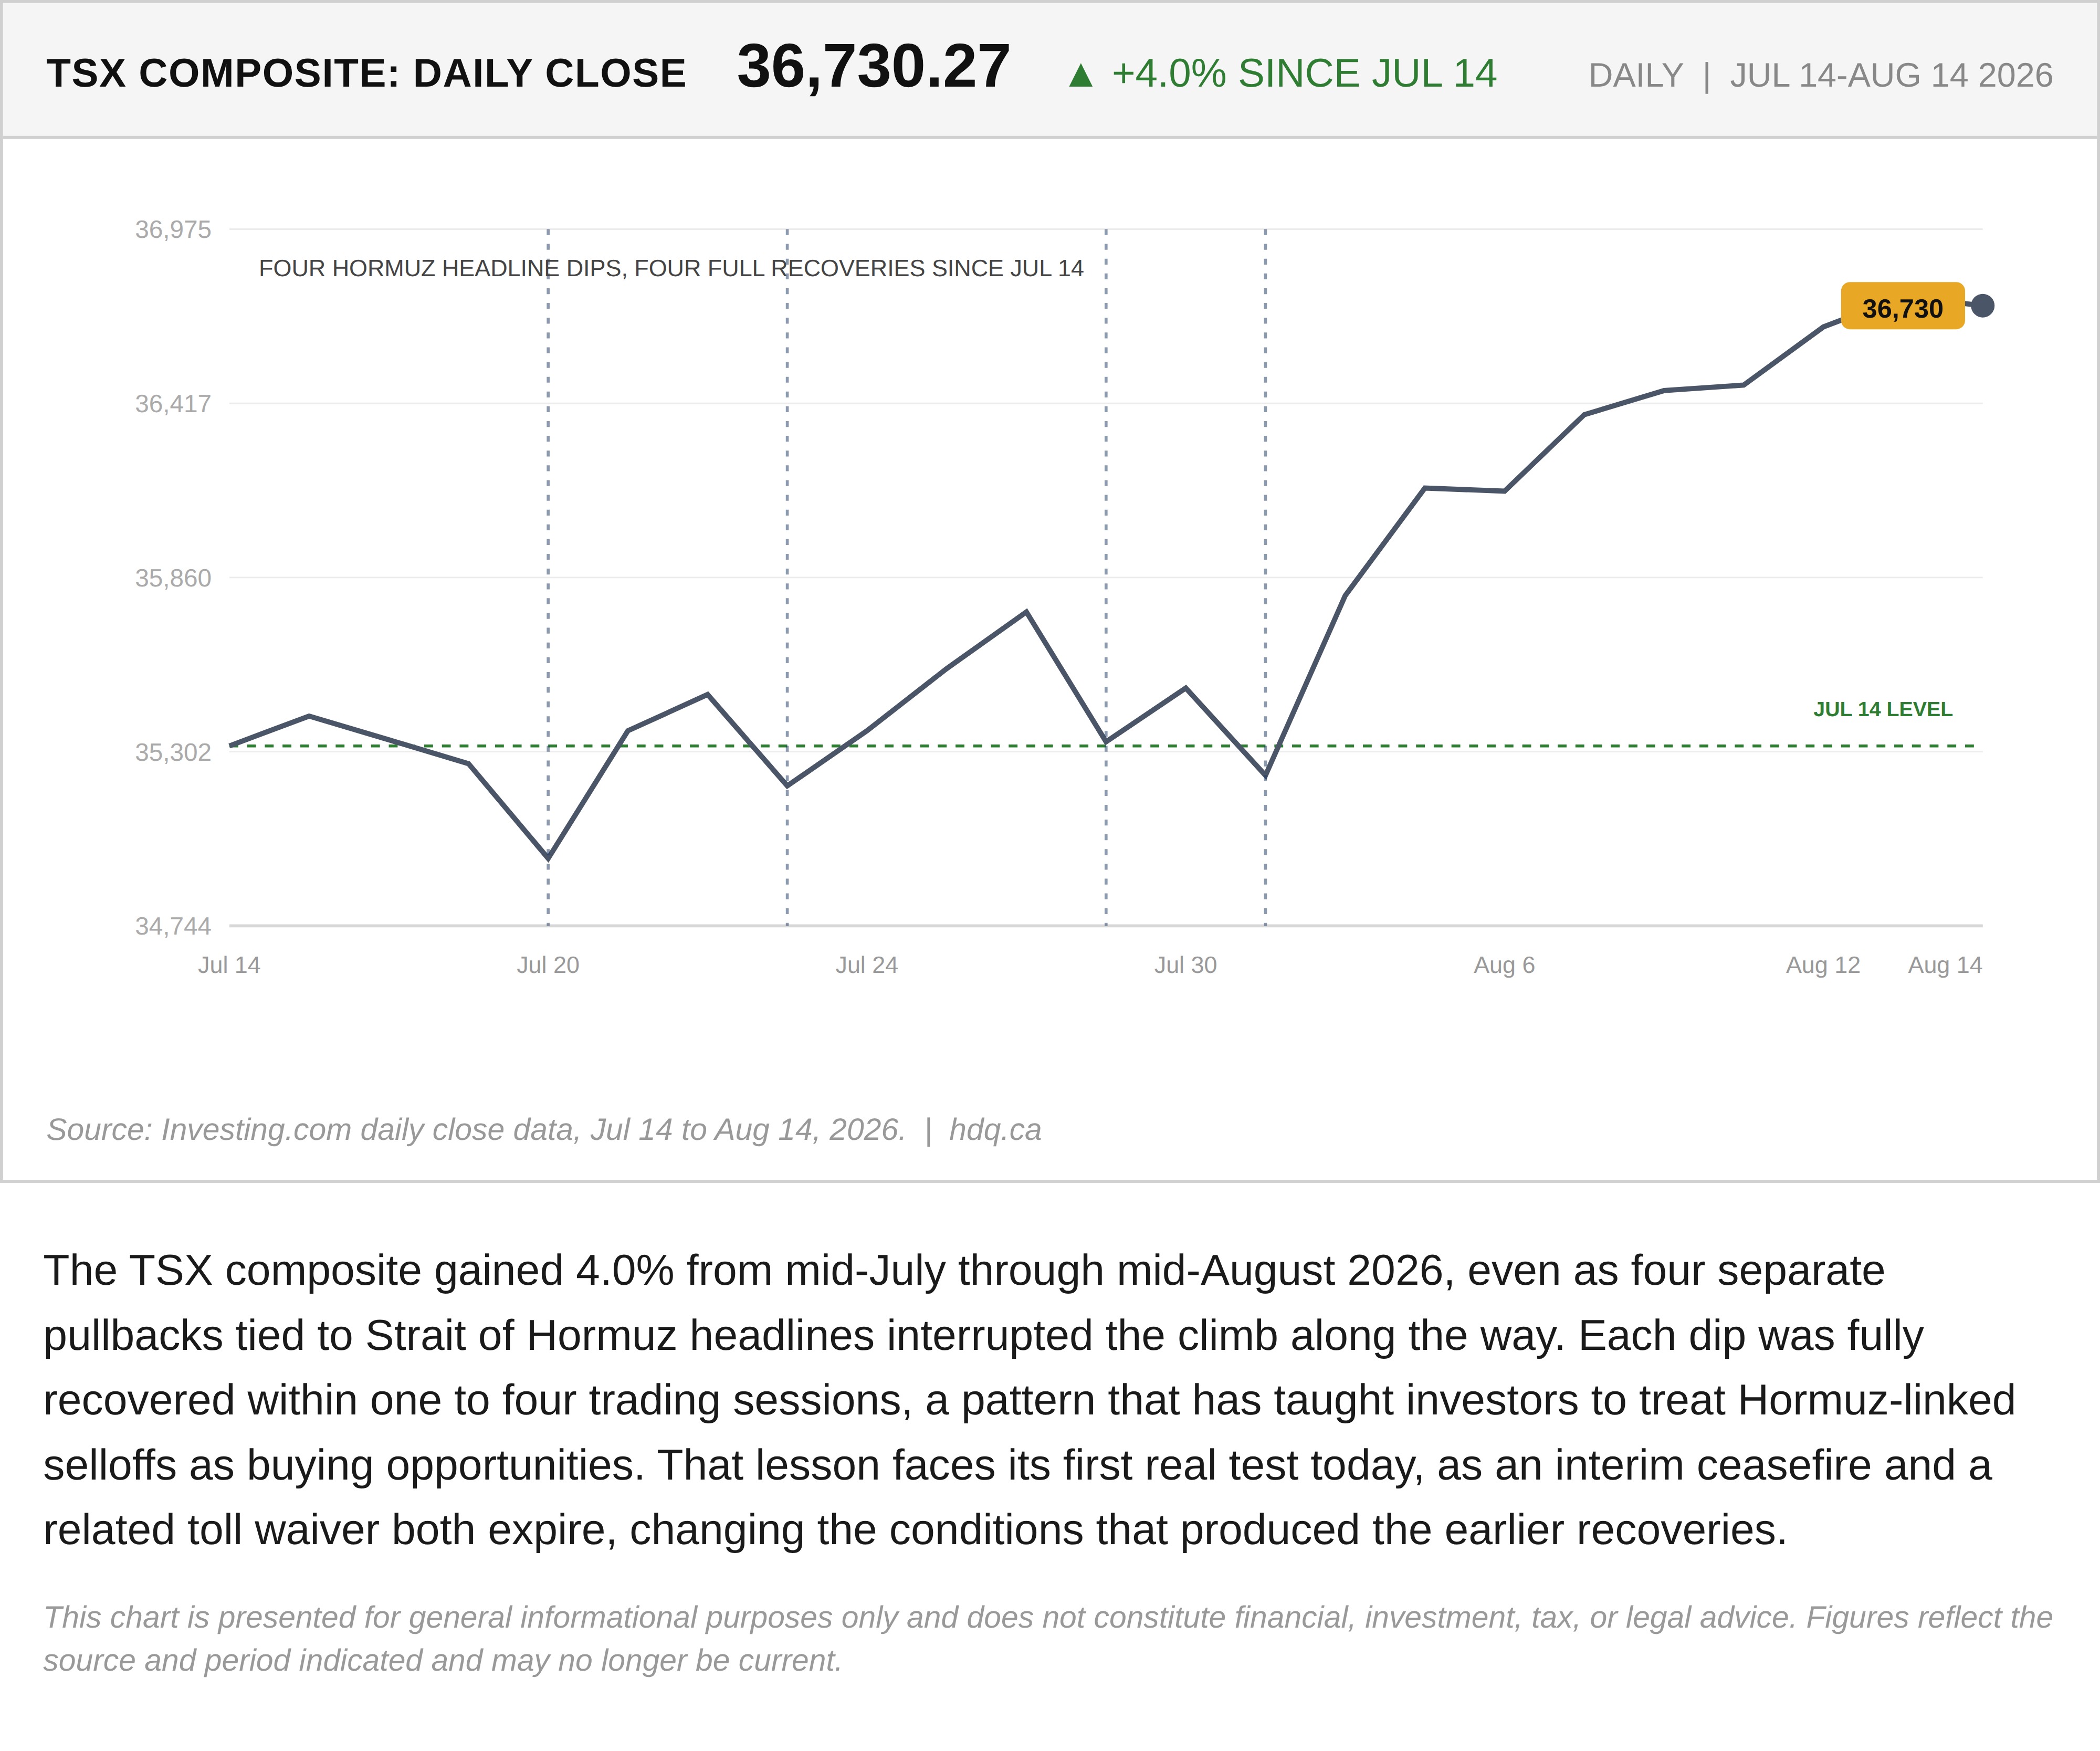
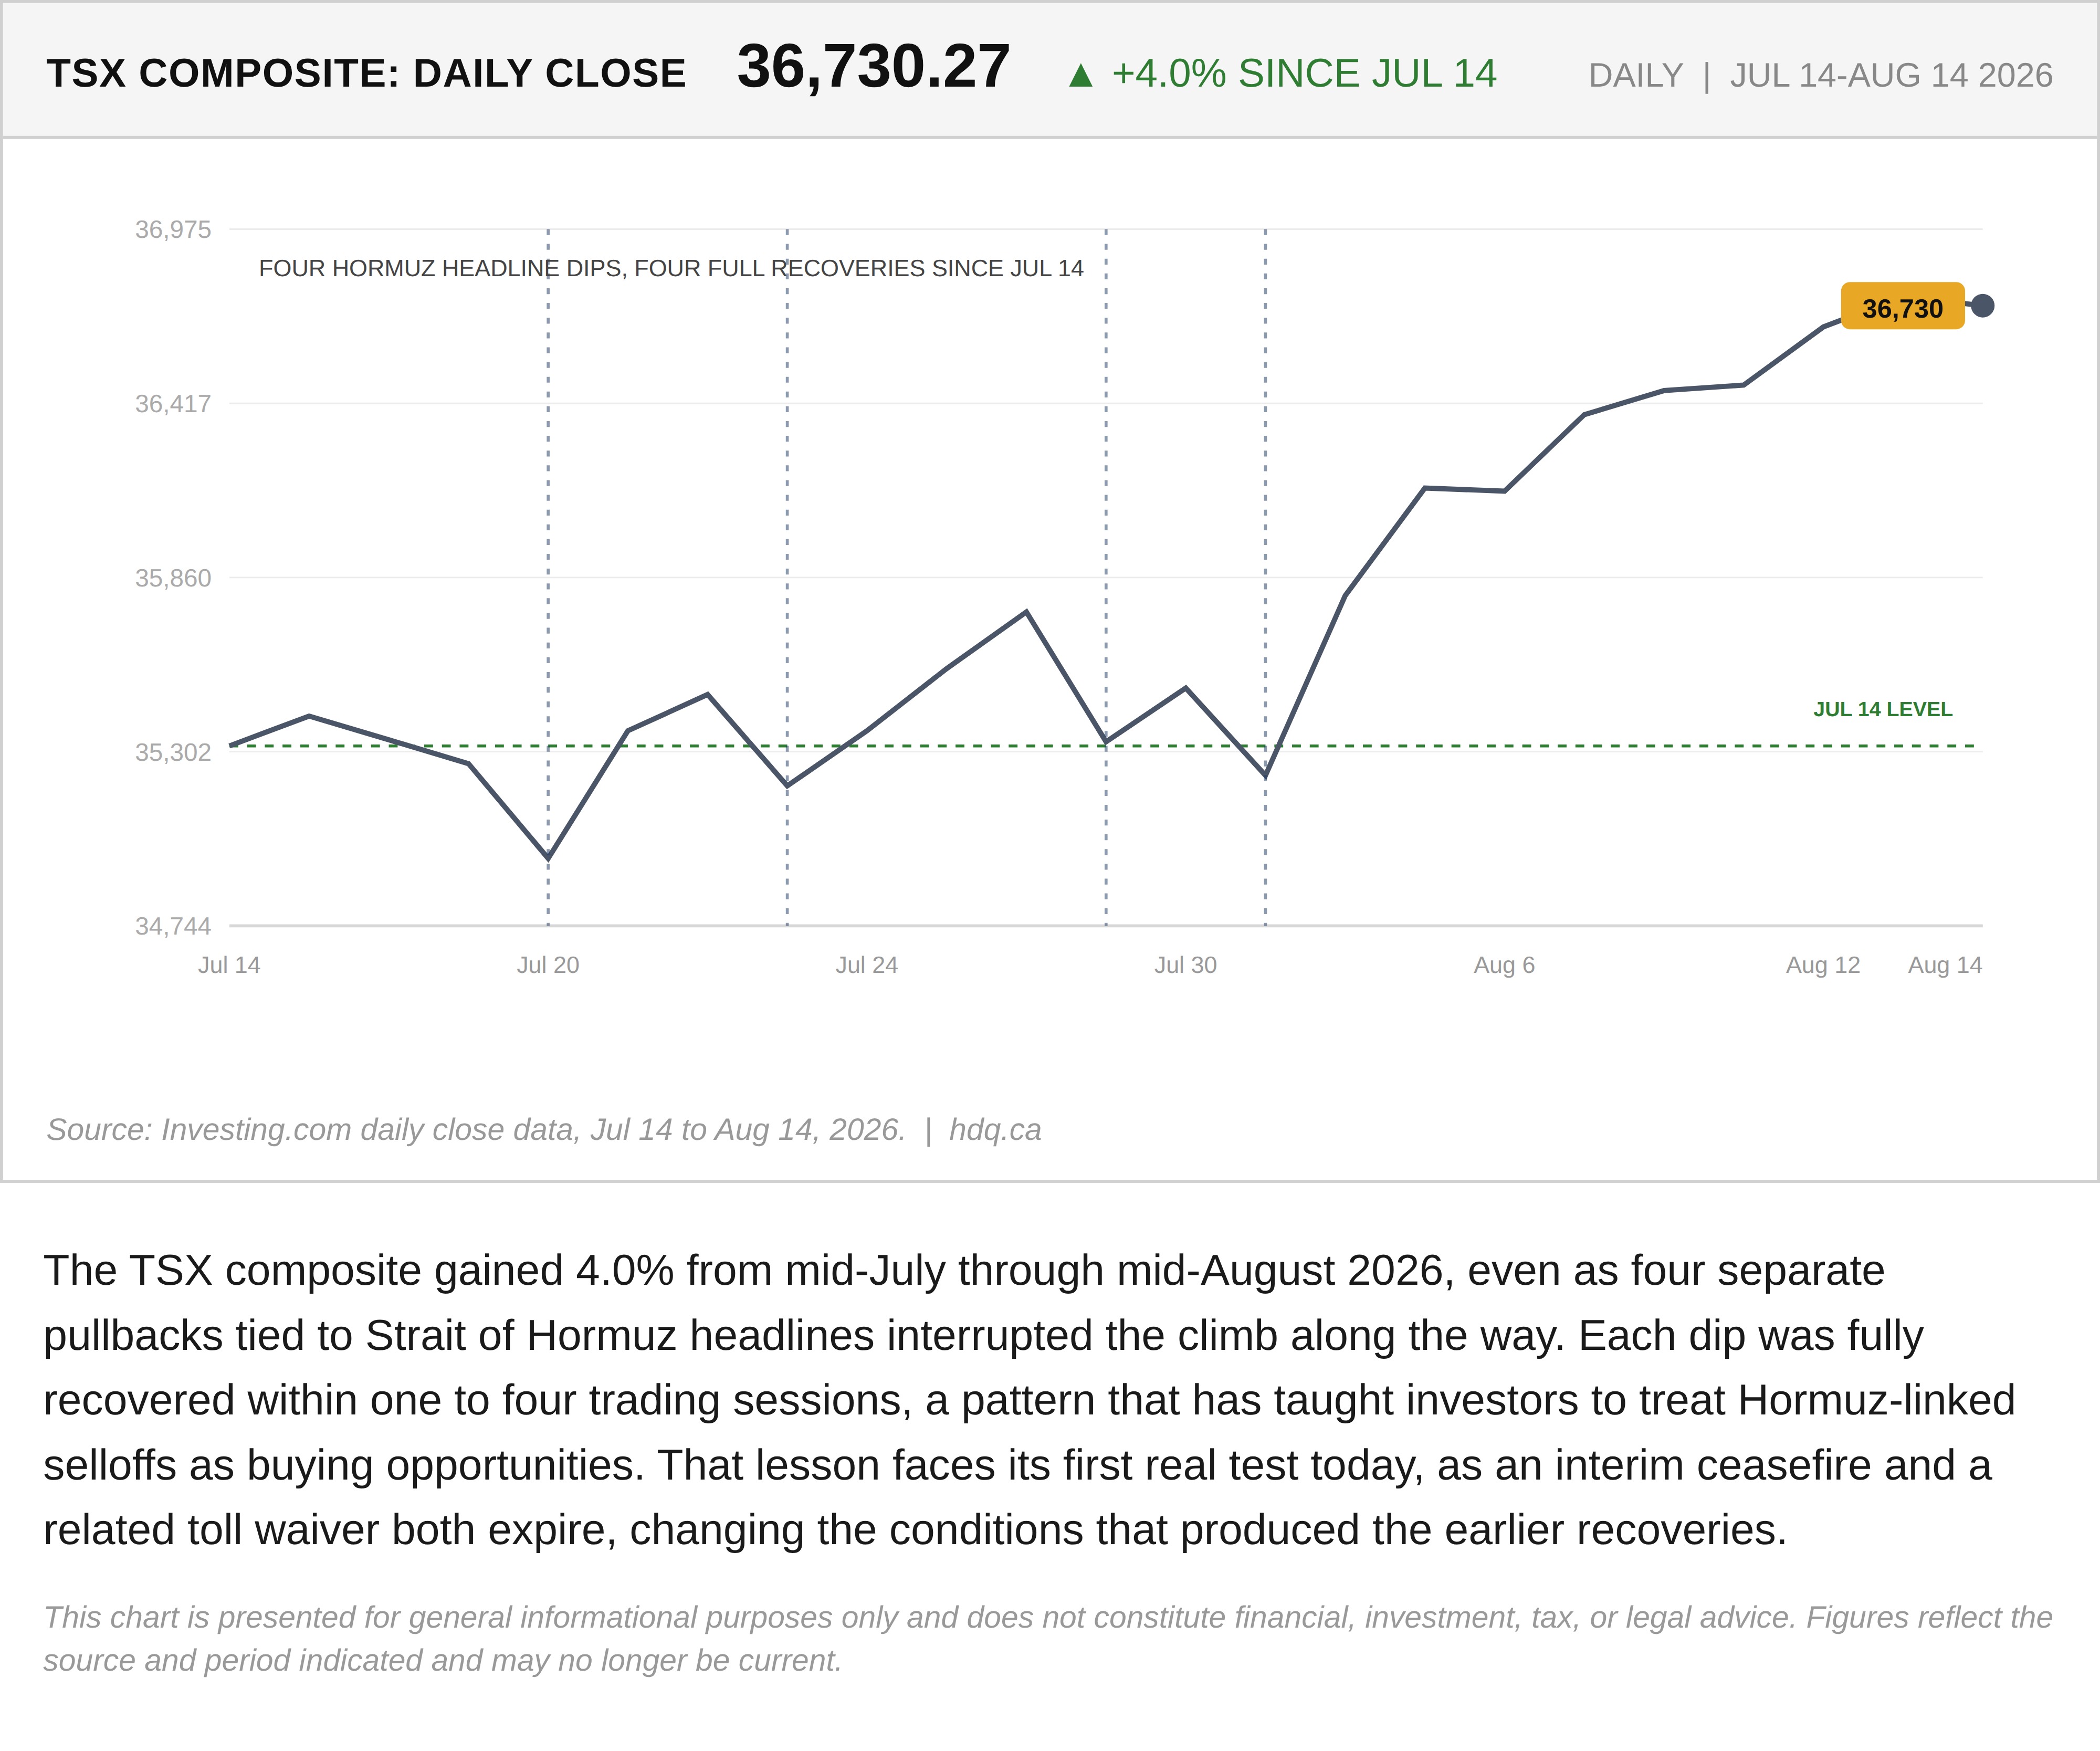
The TSX composite gained 4.0% from mid-July through mid-August 2026, even as four separate pullbacks tied to Strait of Hormuz headlines interrupted the climb along the way. Each dip was fully recovered within one to four trading sessions, a pattern that has taught investors to treat Hormuz-linked selloffs as buying opportunities. That lesson faces its first real test today, as an interim ceasefire and a related toll waiver both expire, changing the conditions that produced the earlier recoveries.
This chart is presented for general informational purposes only and does not constitute financial, investment, tax, or legal advice. Figures reflect the source and period indicated and may no longer be current.
Related charts
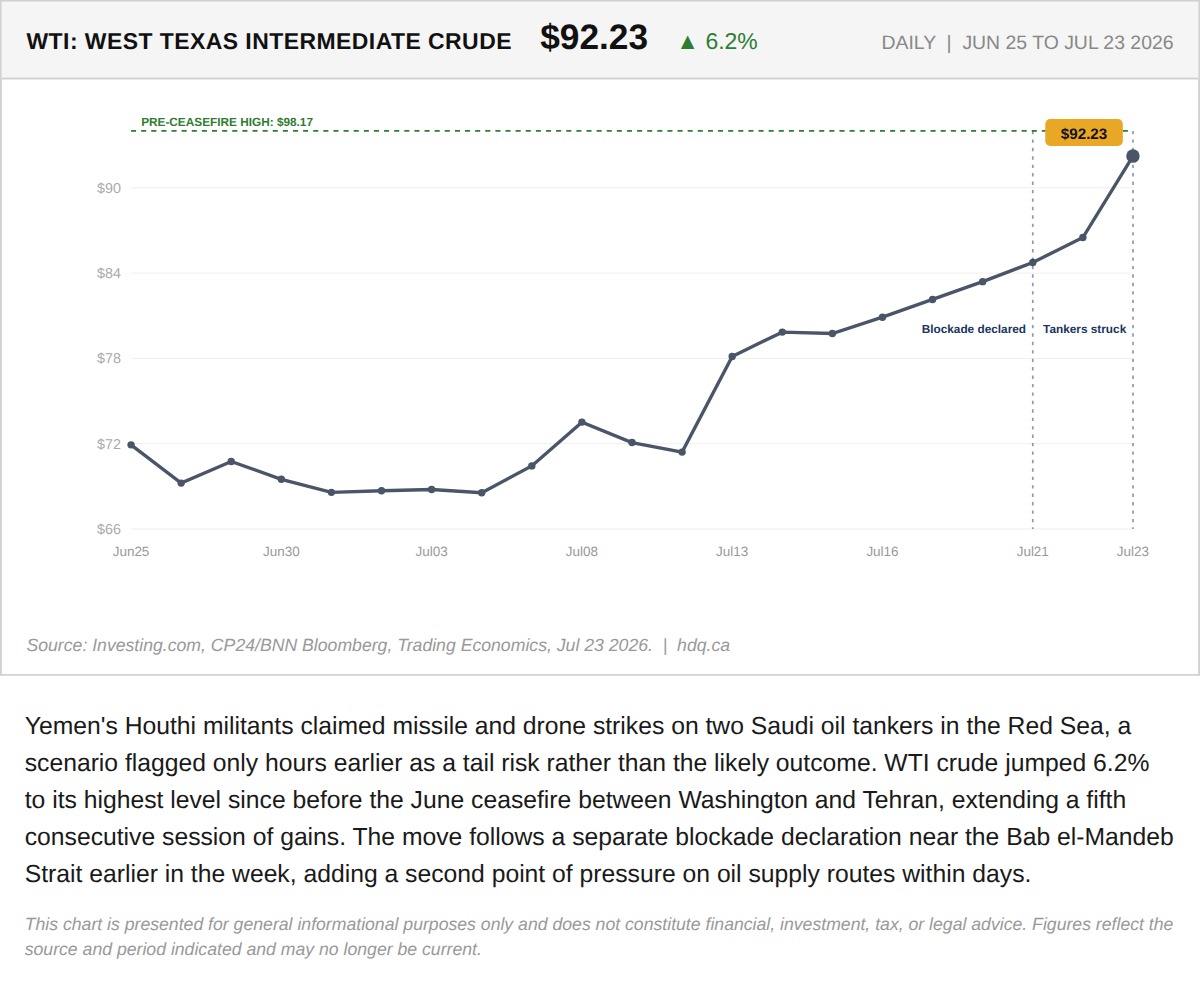
WTI crude has climbed to $74.40, up 11.1% since June 24, as the U.S.
The Strikes on Iran Got Bigger Overnight. The Market's Reaction Got Smaller.
July 9, 2026
View chart & download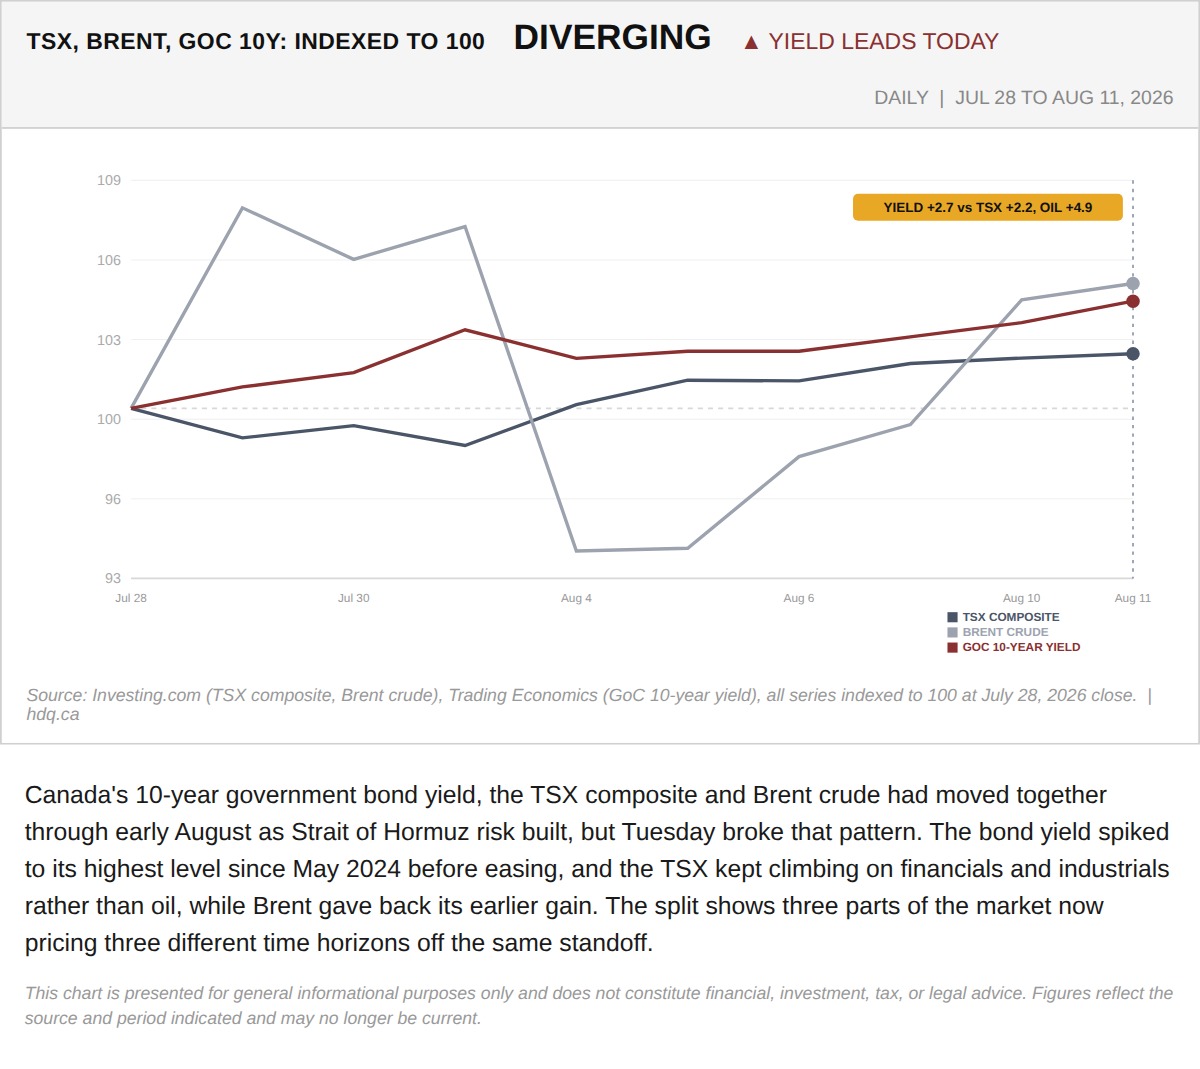
Canada's 10-year government bond yield, the TSX composite and Brent crude had moved together through early August as Strait of Hormuz risk built, but Tuesday broke that pattern.
TSX, Brent and Canada's 10-Year Yield Diverge
August 11, 2026
View chart & download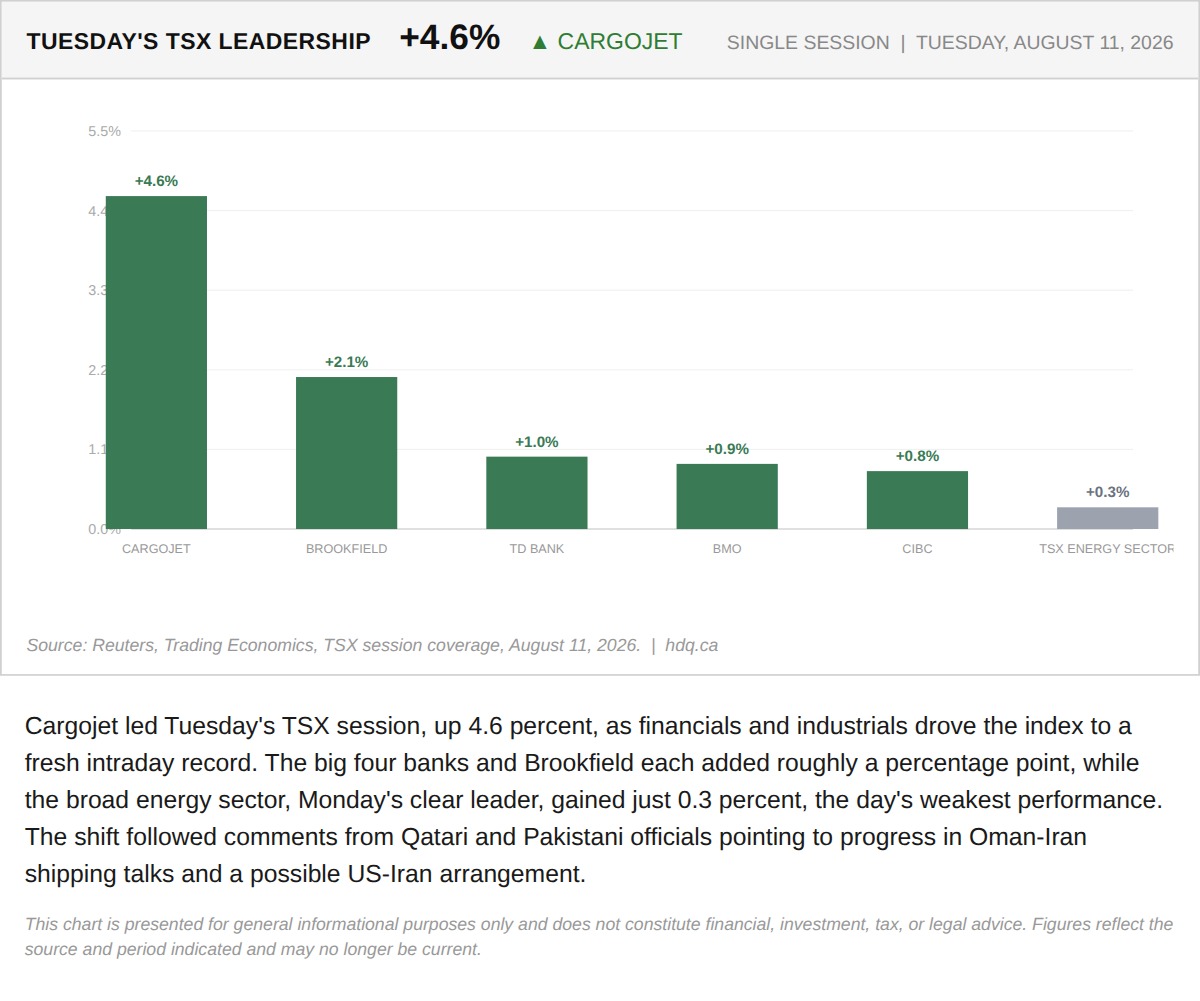
Cargojet led Tuesday's TSX session, up 4.6 percent, as financials and industrials drove the index to a fresh intraday record.
Cargojet Leads Tuesday's TSX as Energy Lags
August 11, 2026
View chart & download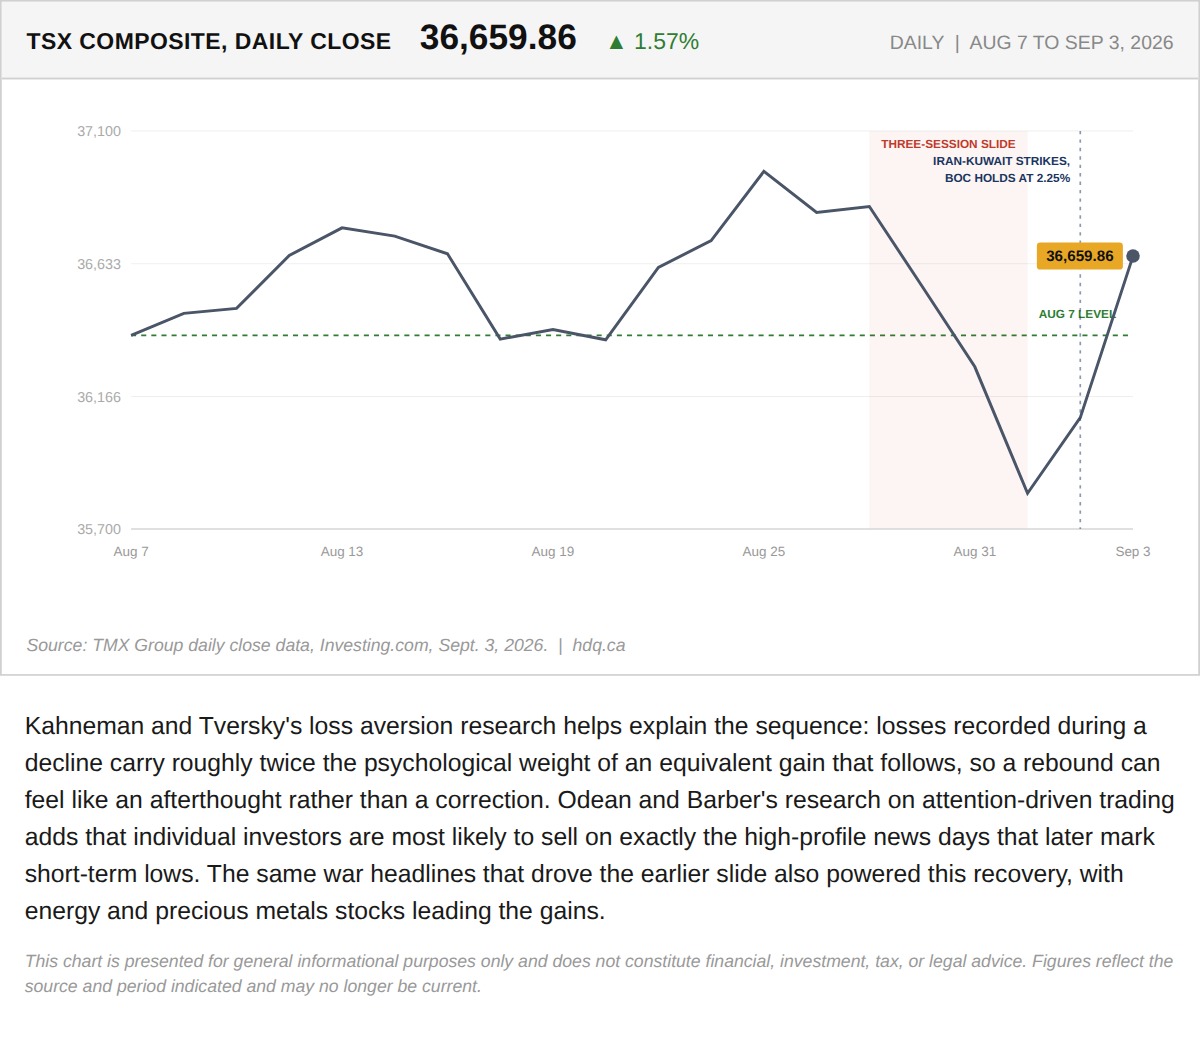
Kahneman and Tversky's loss aversion research helps explain the sequence: losses recorded during a decline carry roughly twice the…
Why the TSX's Two-Day Rebound Is the Most Dangerous Data Point on the Chart
September 4, 2026
View chart & download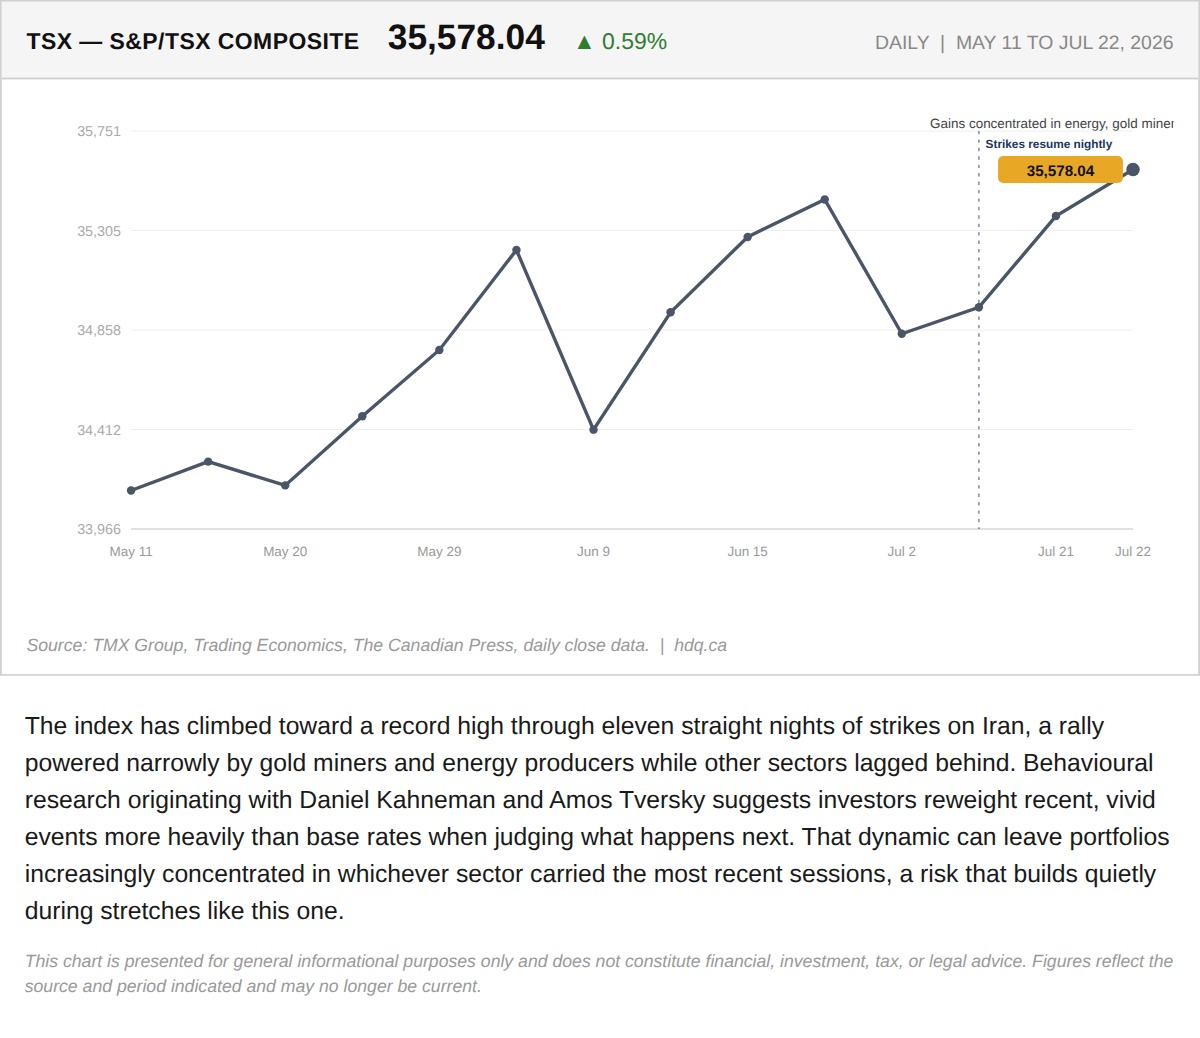
The index has climbed toward a record high through eleven straight nights of strikes on Iran, a rally powered narrowly by gold miners and…
The Recency Trap in a War-Driven Rally
July 23, 2026
View chart & download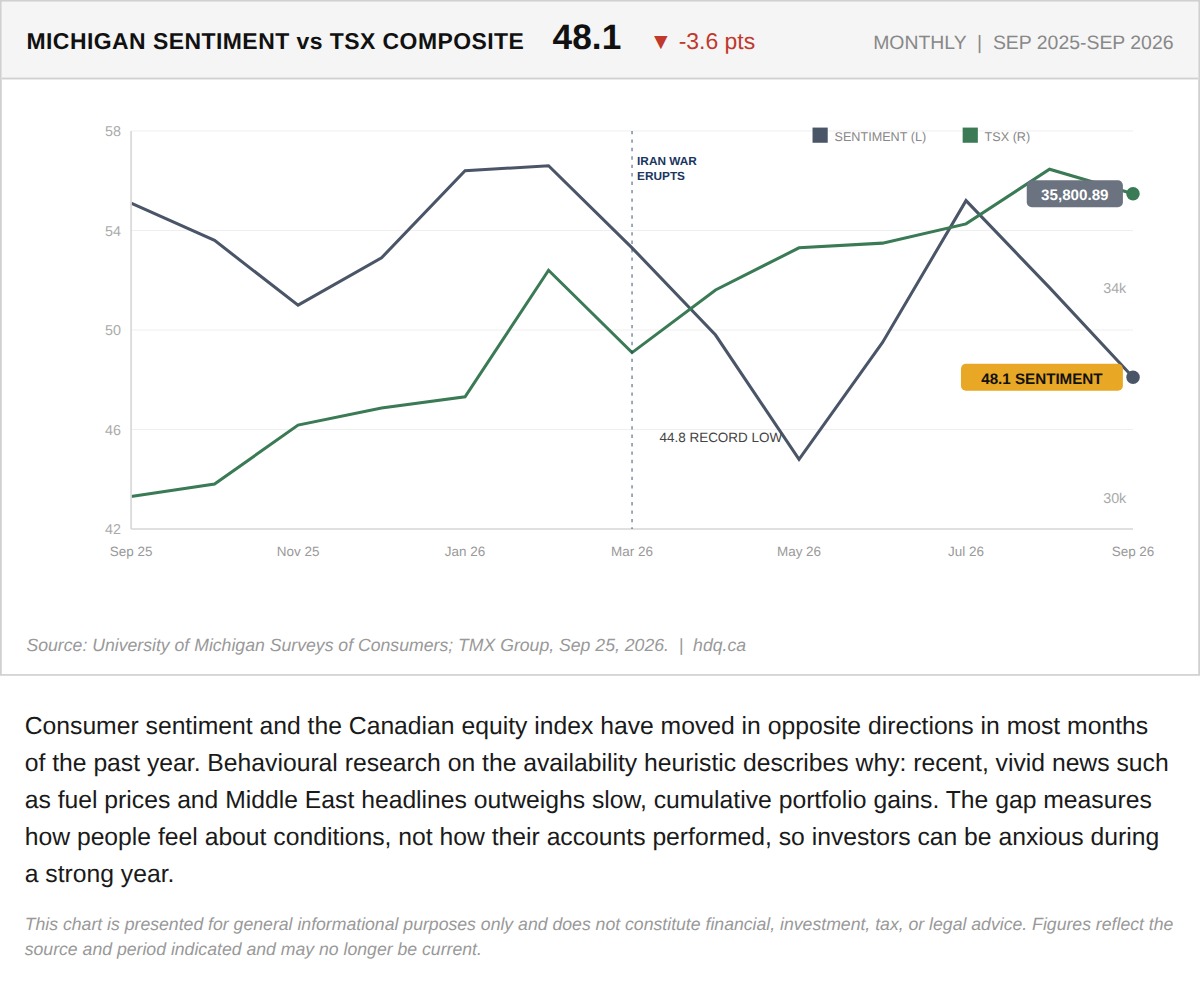
Consumer sentiment and the Canadian equity index have moved in opposite directions in most months of the past year.
Consumer Sentiment Falls While the TSX Rises
September 28, 2026
View chart & download