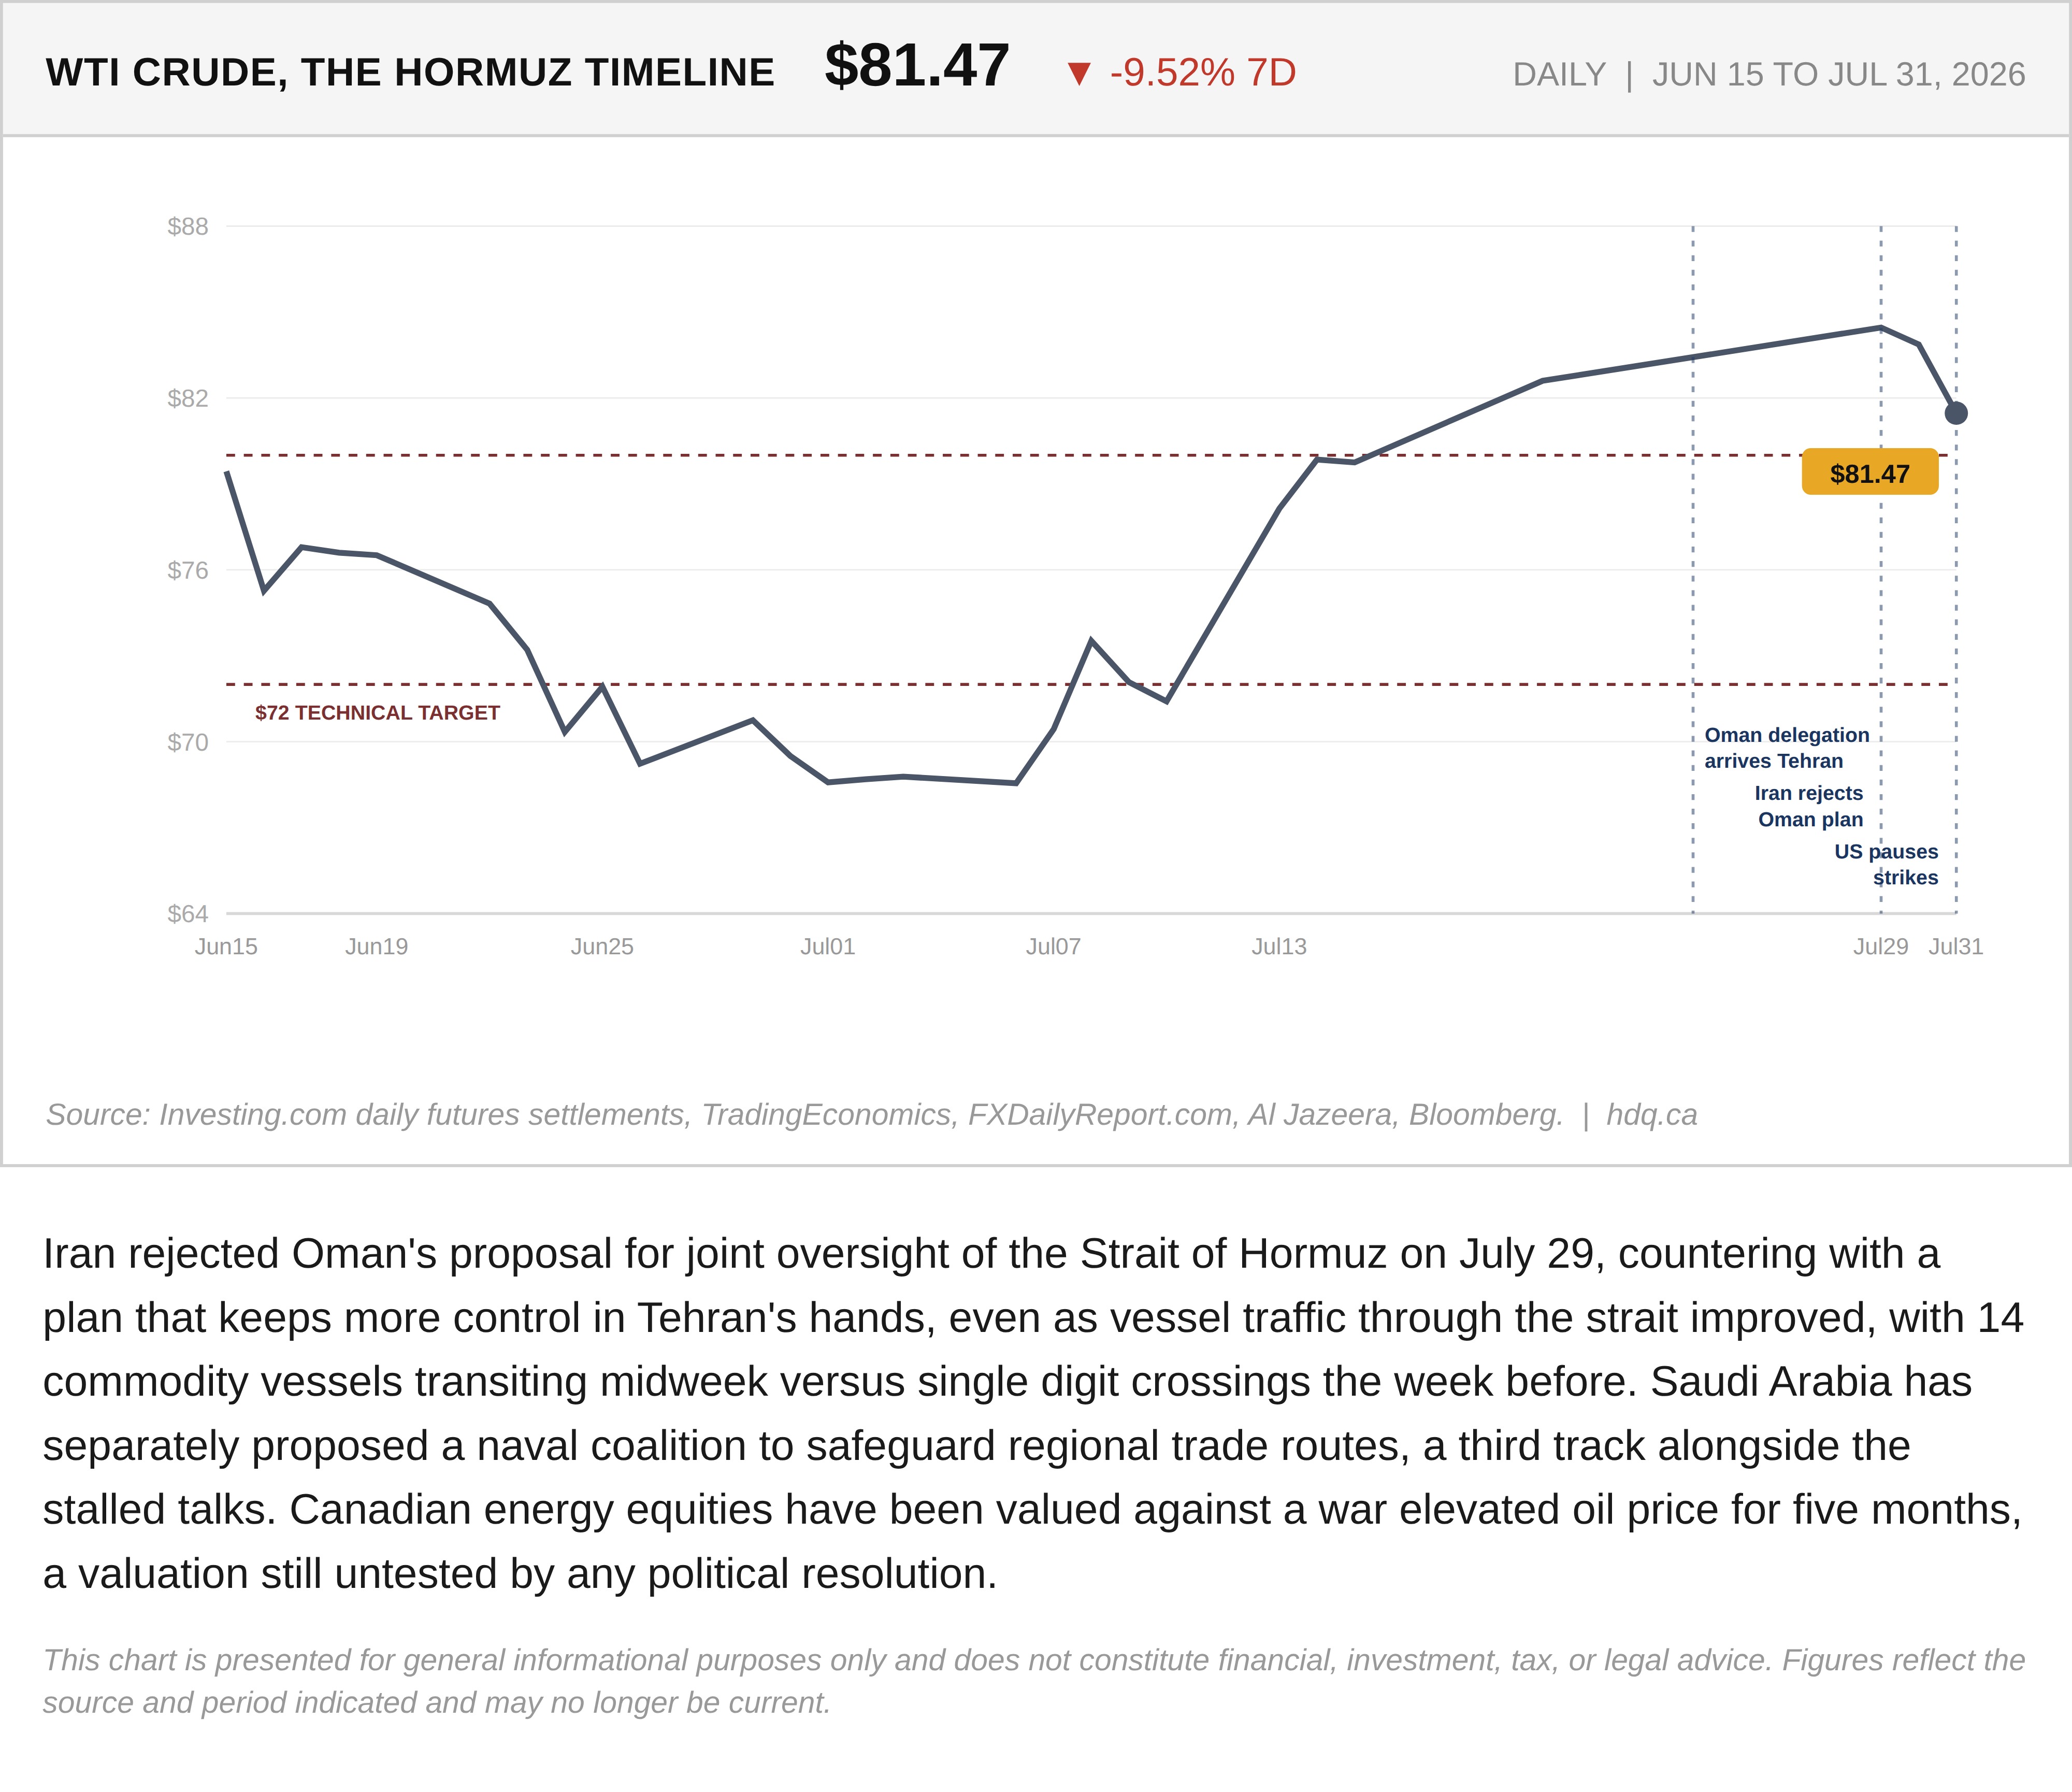
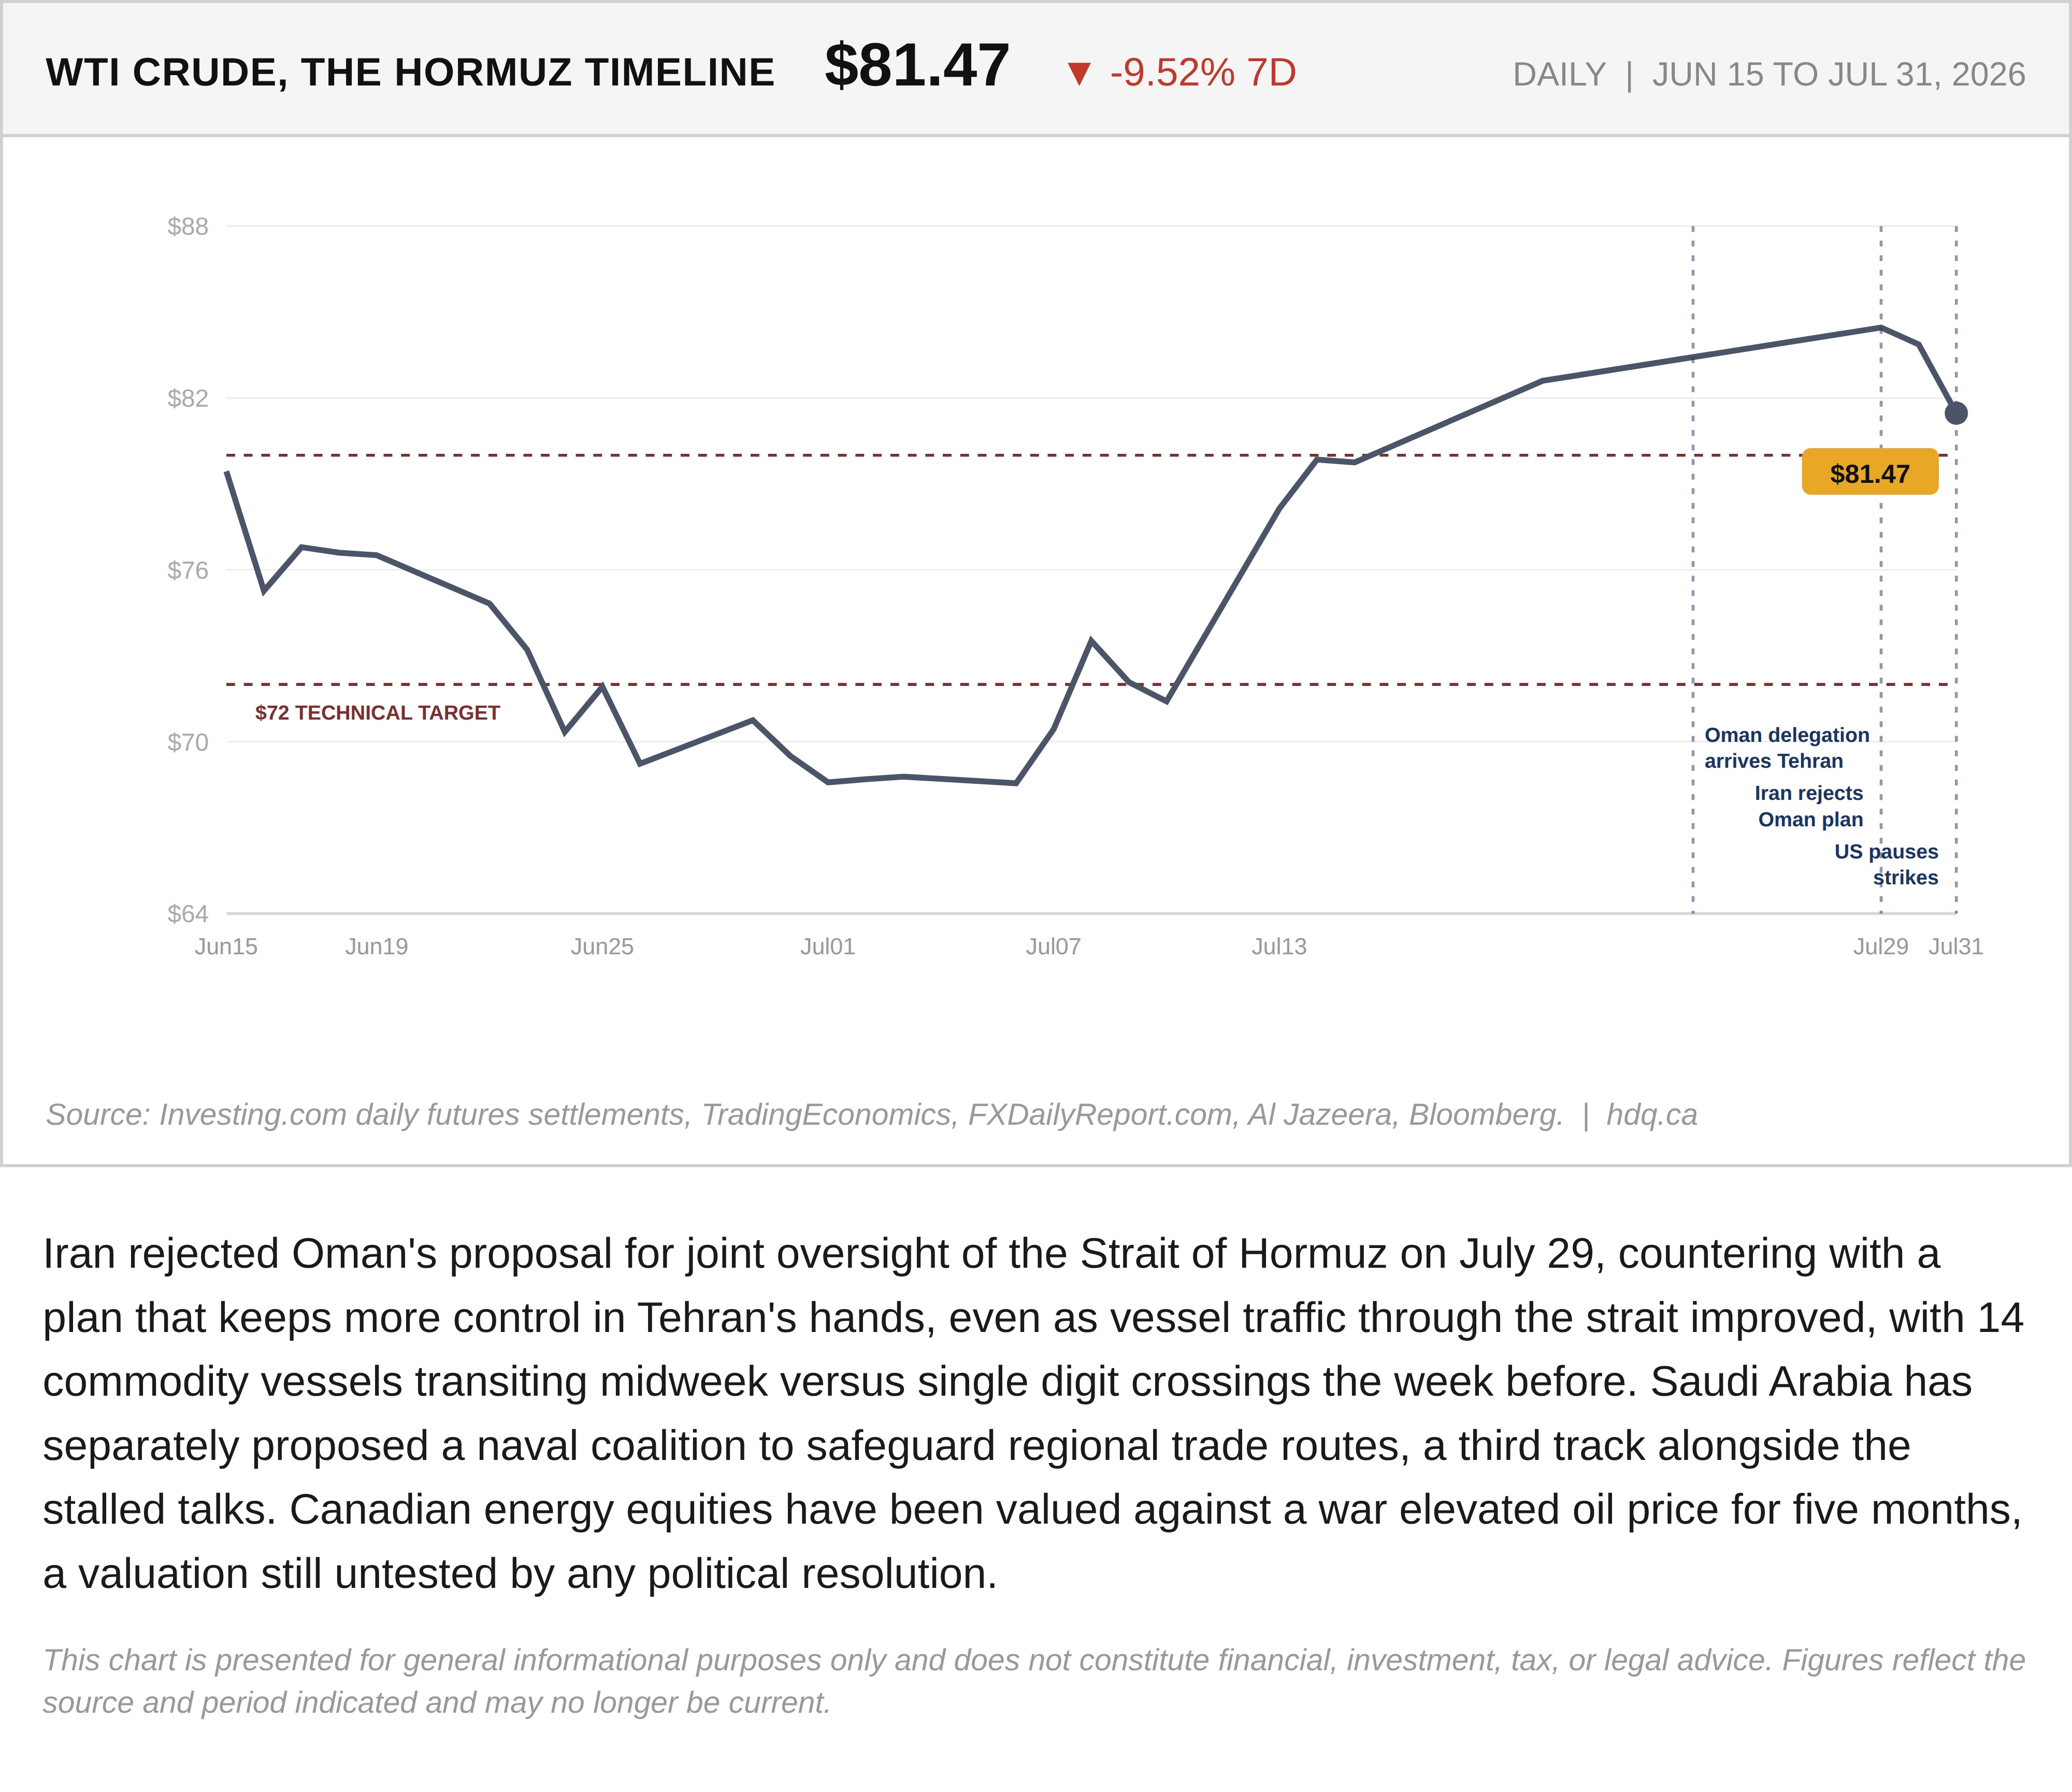
Iran rejected Oman's proposal for joint oversight of the Strait of Hormuz on July 29, countering with a plan that keeps more control in Tehran's hands, even as vessel traffic through the strait improved, with 14 commodity vessels transiting midweek versus single digit crossings the week before. Saudi Arabia has separately proposed a naval coalition to safeguard regional trade routes, a third track alongside the stalled talks. Canadian energy equities have been valued against a war elevated oil price for five months, a valuation still untested by any political resolution.
This chart is presented for general informational purposes only and does not constitute financial, investment, tax, or legal advice. Figures reflect the source and period indicated and may no longer be current.
Related charts
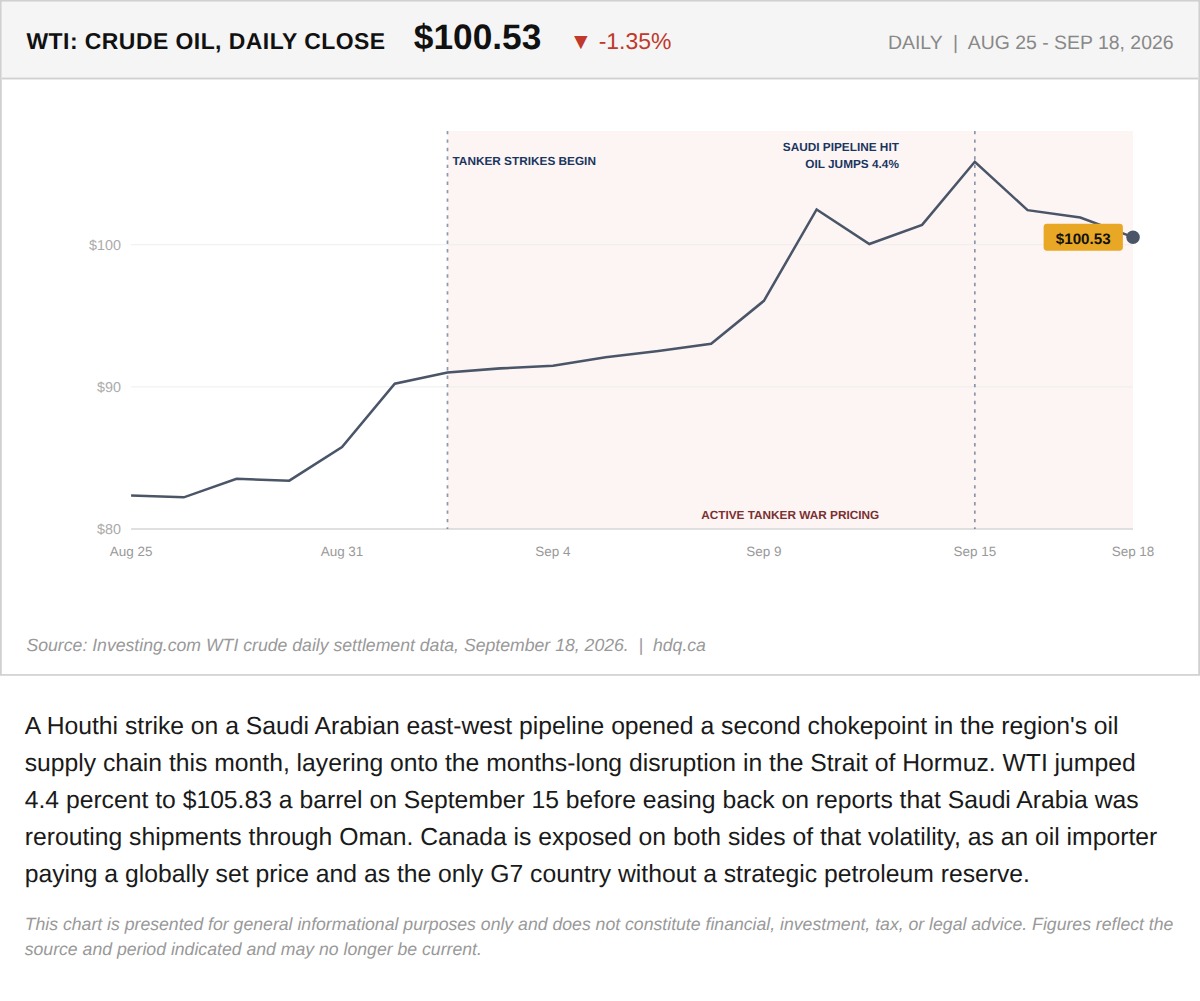
A Houthi strike on a Saudi Arabian east-west pipeline opened a second chokepoint in the region's oil supply chain this month, layering onto…
The Strait of Hormuz Story Just Got a Second Chokepoint, and Canada Has Exposure on Both Sides
September 18, 2026
View chart & download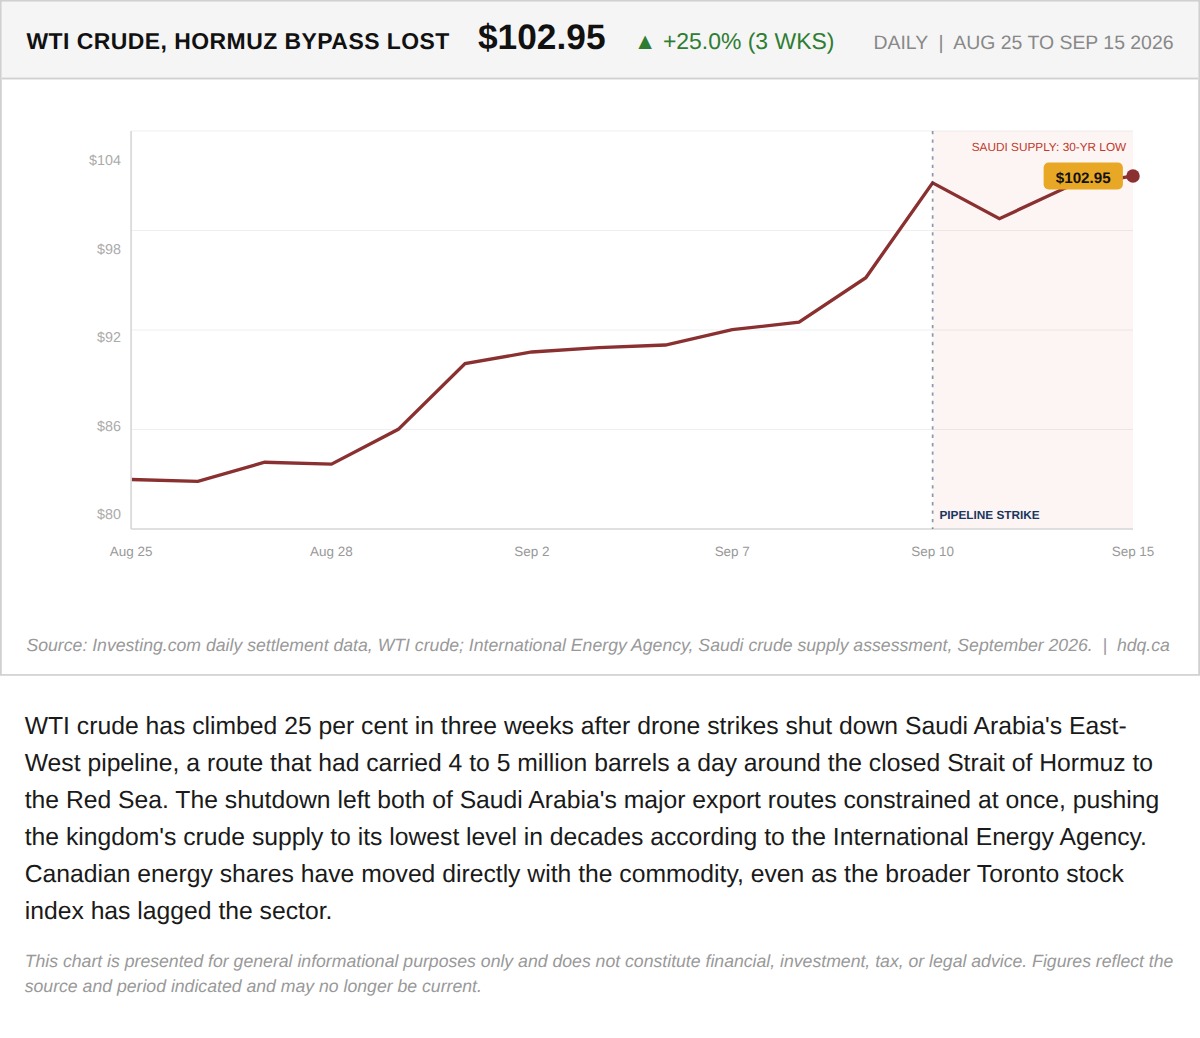
WTI crude has climbed 25 per cent in three weeks after drone strikes shut down Saudi Arabia's East-West pipeline, a route that had carried…
Iran Closed the Strait of Hormuz. This Week, Militias Closed the Detour Around It.
September 15, 2026
View chart & download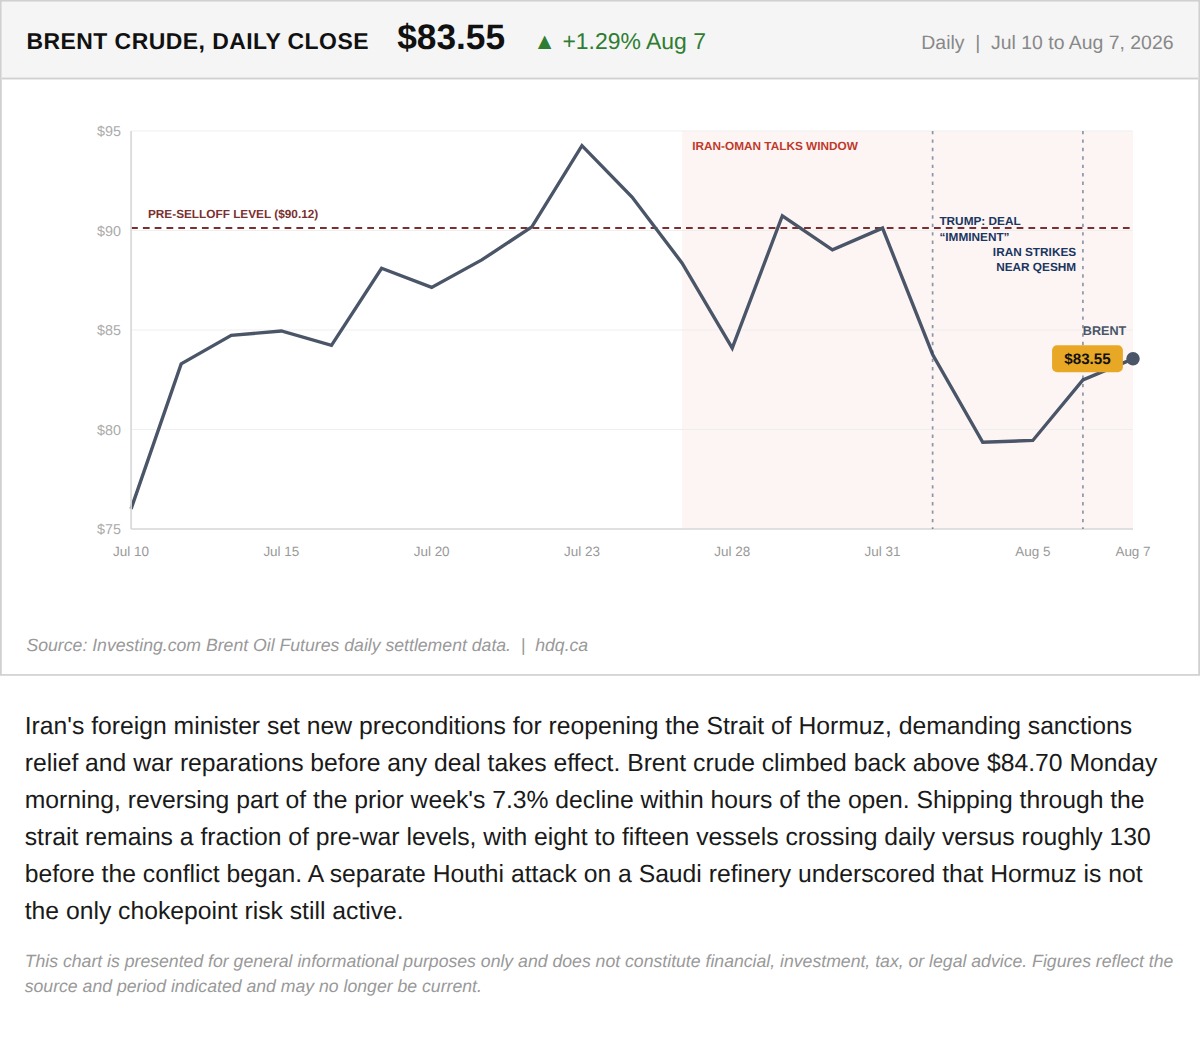
Iran's foreign minister set new preconditions for reopening the Strait of Hormuz, demanding sanctions relief and war reparations before any deal takes effect.
Iran Just Told the Market What the June MOU Actually Requires. The Market Priced Something Else.
August 10, 2026
View chart & download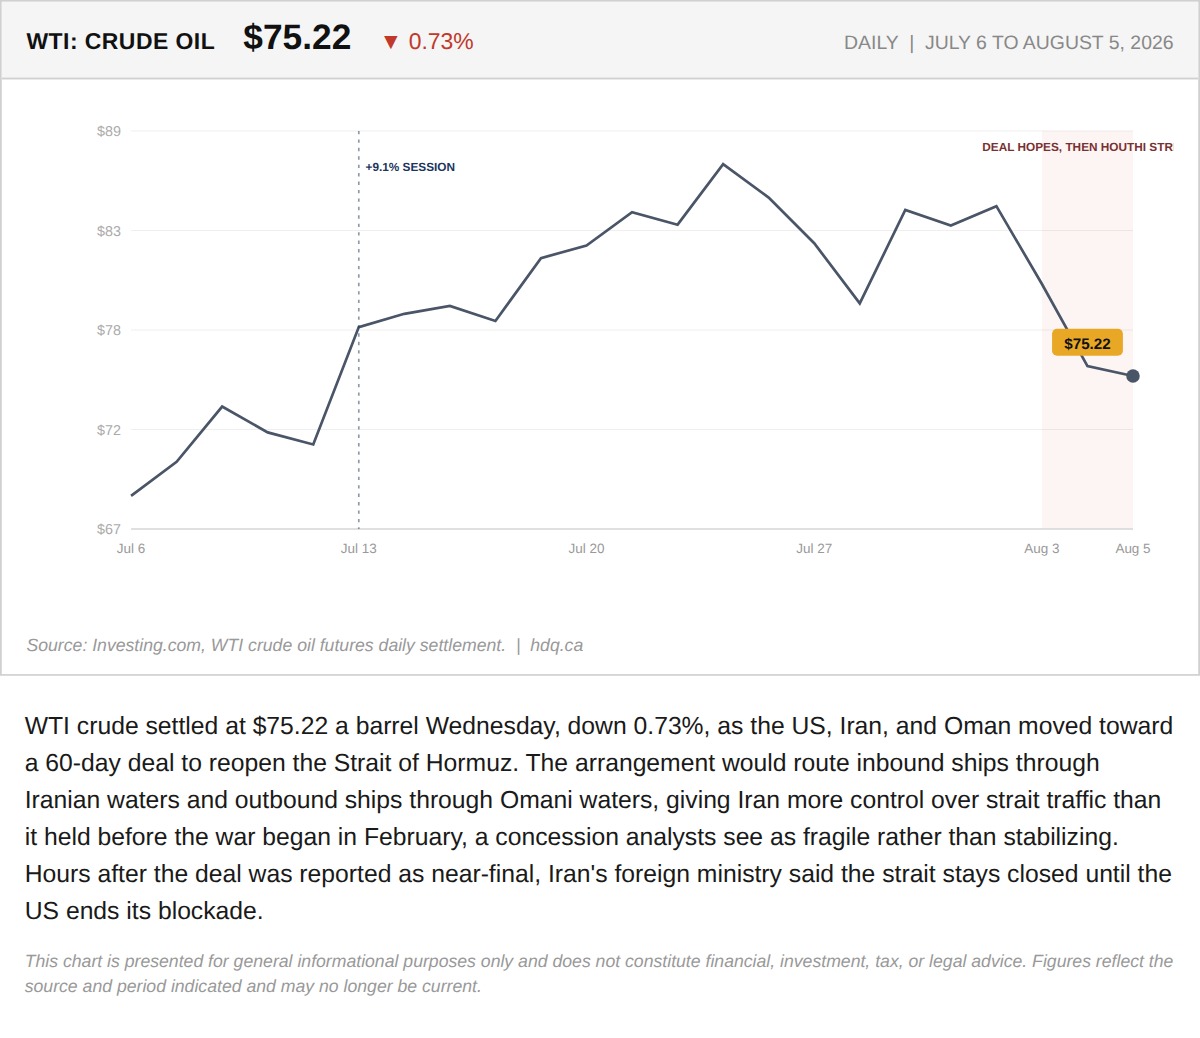
WTI crude settled at $75.22 a barrel Wednesday, down 0.73%, as the US, Iran, and Oman moved toward a 60-day deal to reopen the Strait of Hormuz.
WTI Eases Below $76 as a Fragile Hormuz Reopening Deal Nears
August 5, 2026
View chart & download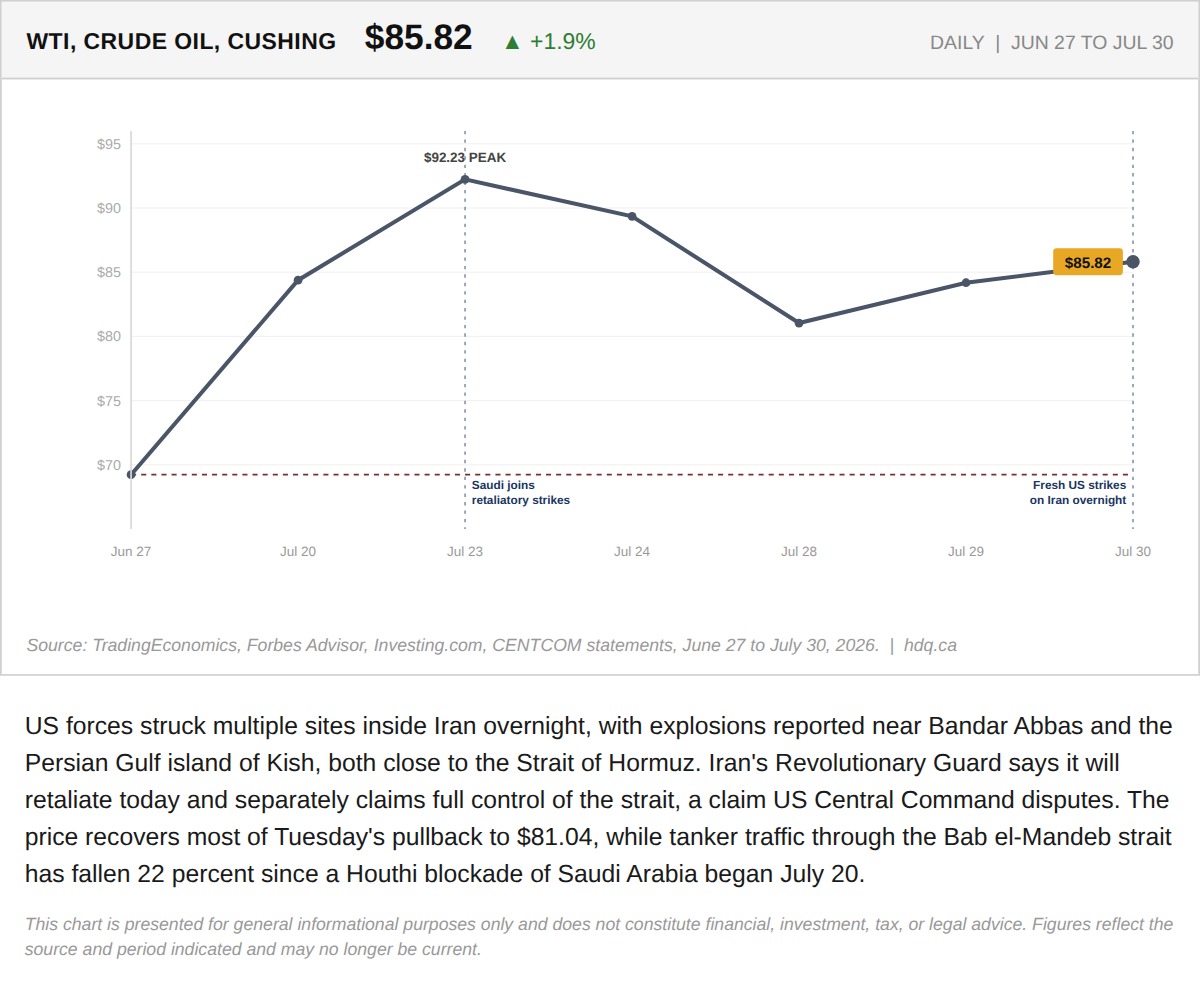
US forces struck multiple sites inside Iran overnight, with explosions reported near Bandar Abbas and the Persian Gulf island of Kish, both close to the Strait of Hormuz.
The US Struck Iran Overnight. Tehran Says It Will Punish the Aggressor Today.
July 30, 2026
View chart & download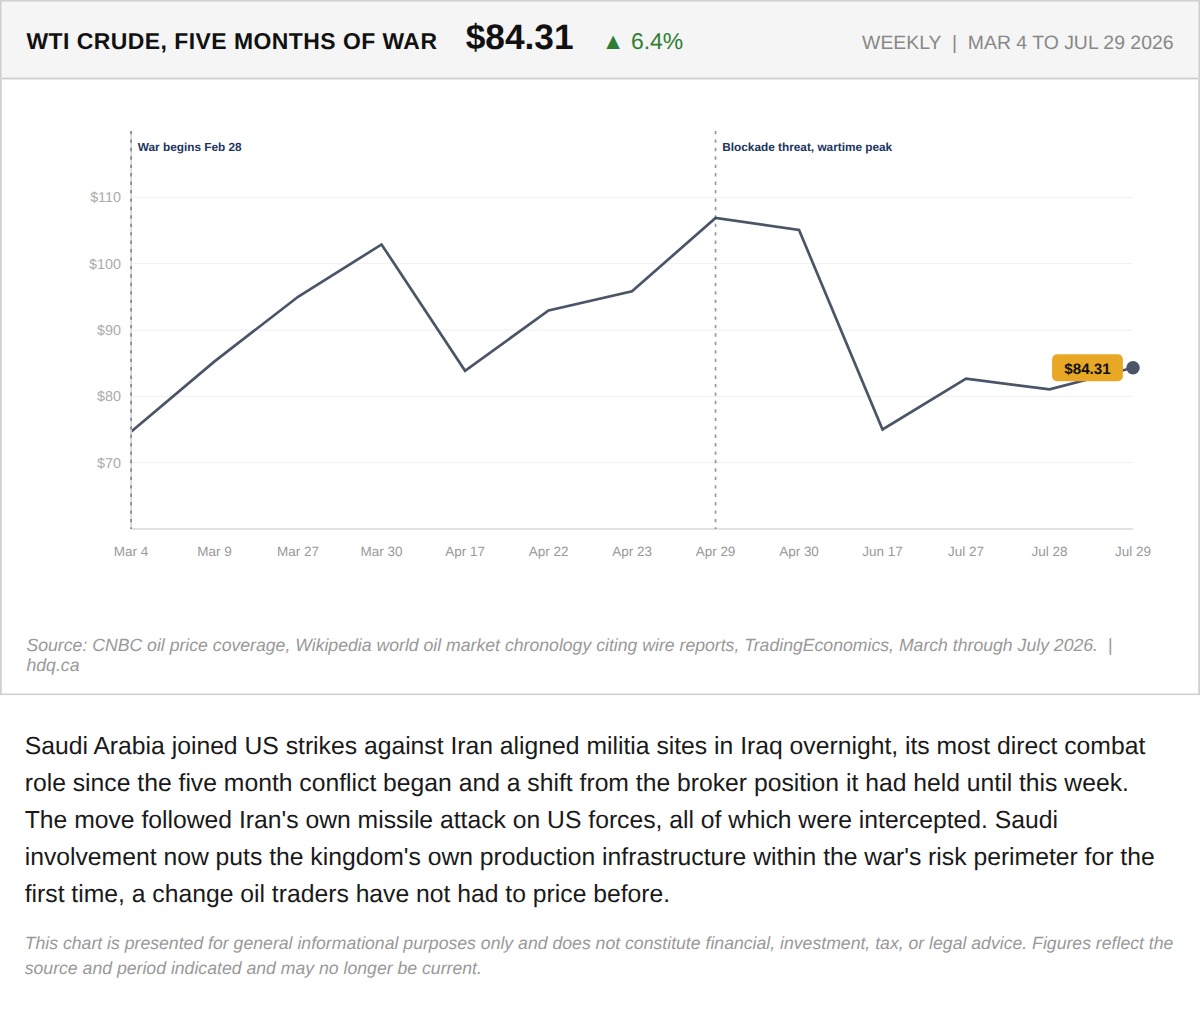
Saudi Arabia joined US strikes against Iran aligned militia sites in Iraq overnight, its most direct combat role since the five month…
Iran's Missiles Were Intercepted. Saudi Arabia Joining the Strikes Was Not Supposed to Happen.
July 29, 2026
View chart & download