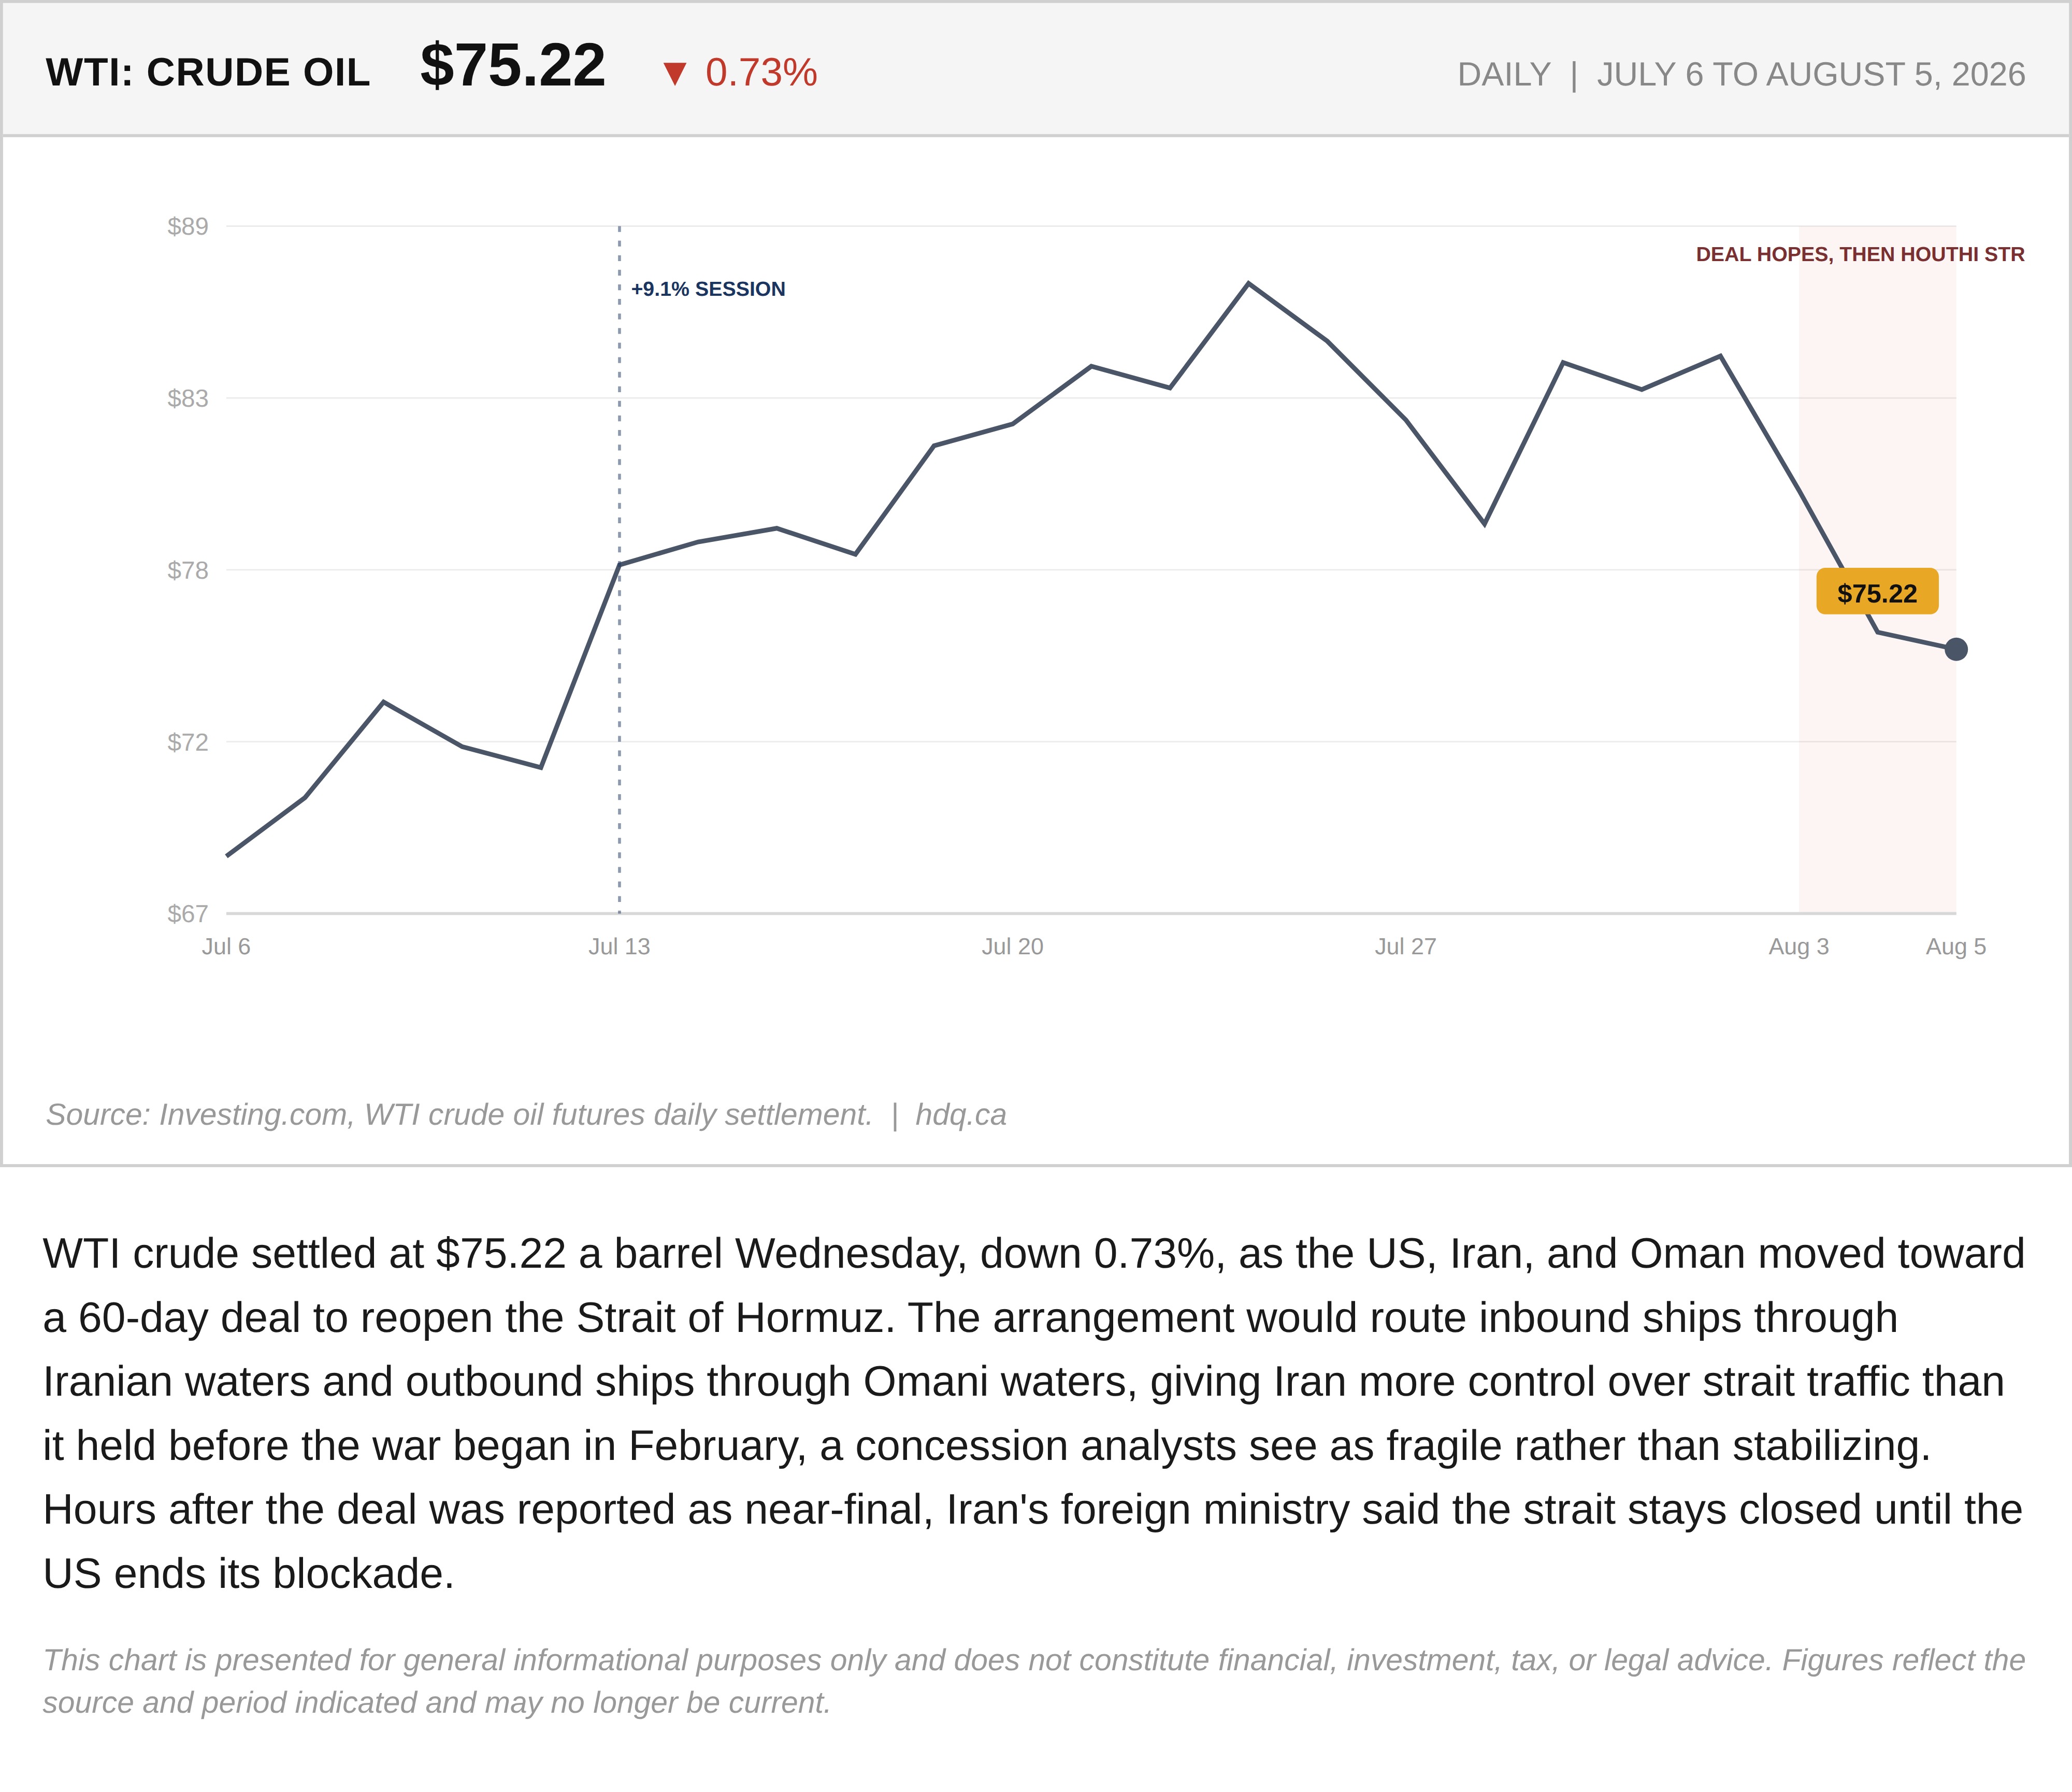
WTI crude settled at $75.22 a barrel Wednesday, down 0.73%, as the US, Iran, and Oman moved toward a 60-day deal to reopen the Strait of Hormuz. The arrangement would route inbound ships through Iranian waters and outbound ships through Omani waters, giving Iran more control over strait traffic than it held before the war began in February, a concession analysts see as fragile rather than stabilizing. Hours after the deal was reported as near-final, Iran's foreign ministry said the strait stays closed until the US ends its blockade.
This chart is presented for general informational purposes only and does not constitute financial, investment, tax, or legal advice. Figures reflect the source and period indicated and may no longer be current.
Related charts
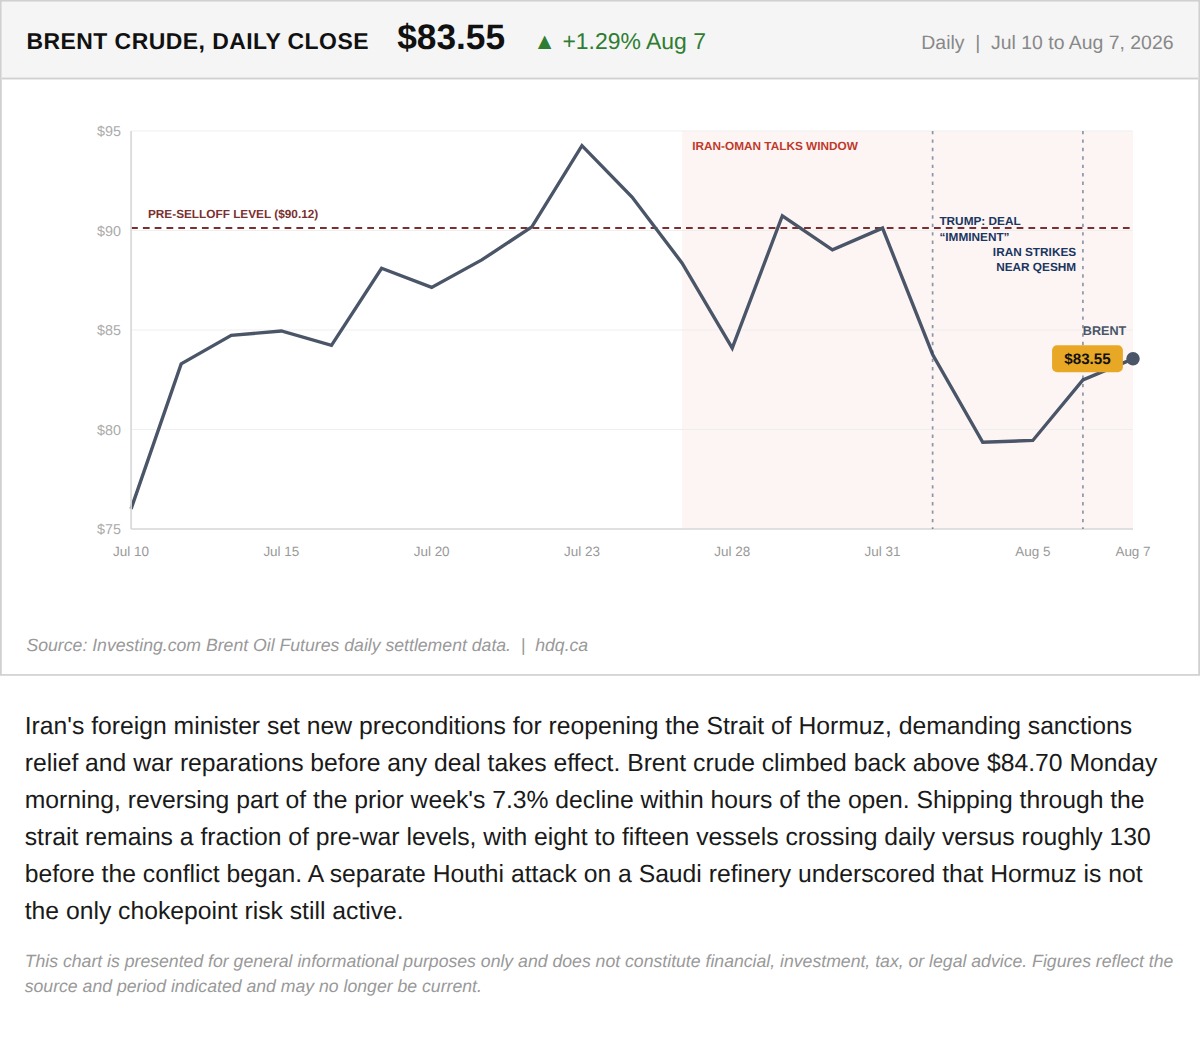
Iran's foreign minister set new preconditions for reopening the Strait of Hormuz, demanding sanctions relief and war reparations before any deal takes effect.
Iran Just Told the Market What the June MOU Actually Requires. The Market Priced Something Else.
August 10, 2026
View chart & download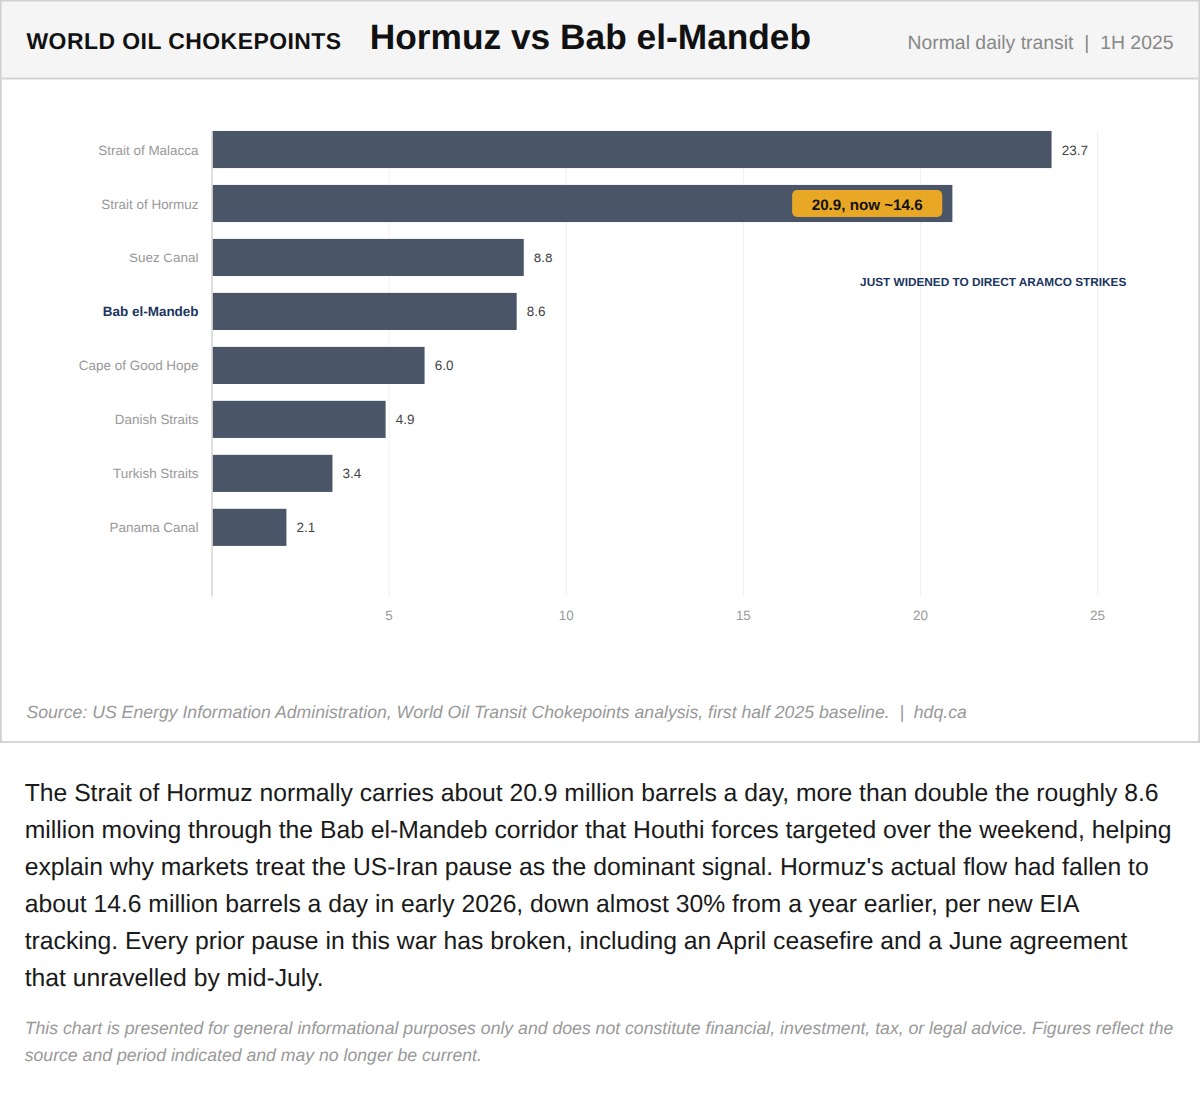
The Strait of Hormuz normally carries about 20.9 million barrels a day, more than double the roughly 8.6 million moving through the Bab…
World Oil Chokepoints: Hormuz vs. Bab el-Mandeb
July 27, 2026
View chart & download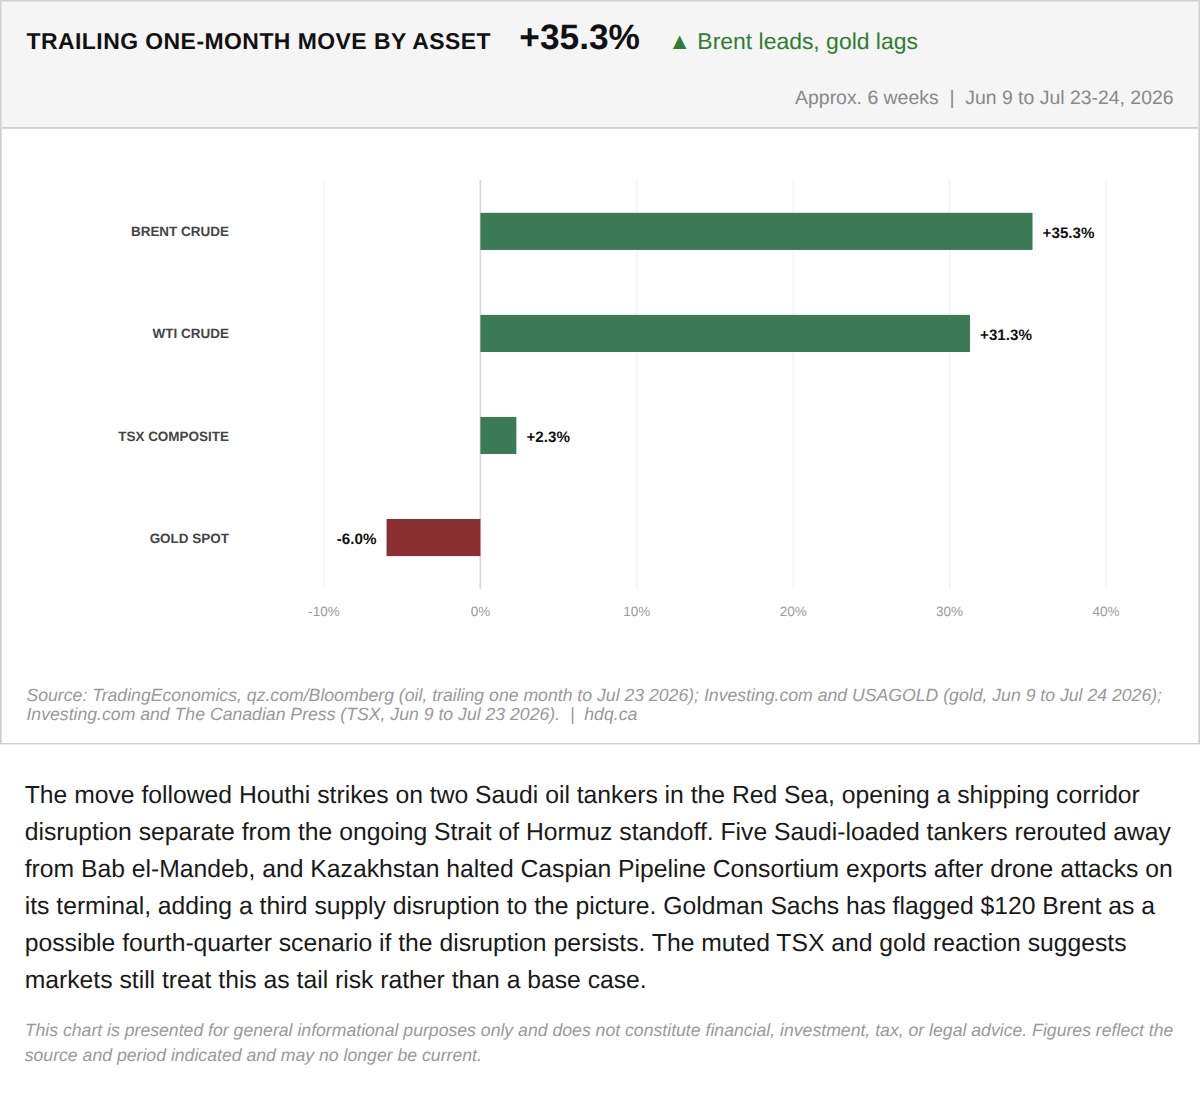
The move followed Houthi strikes on two Saudi oil tankers in the Red Sea, opening a shipping corridor disruption separate from the ongoing Strait of Hormuz standoff.
The Houthis Just Opened a Second Chokepoint. Markets Are Not Pricing It Yet.
July 24, 2026
View chart & download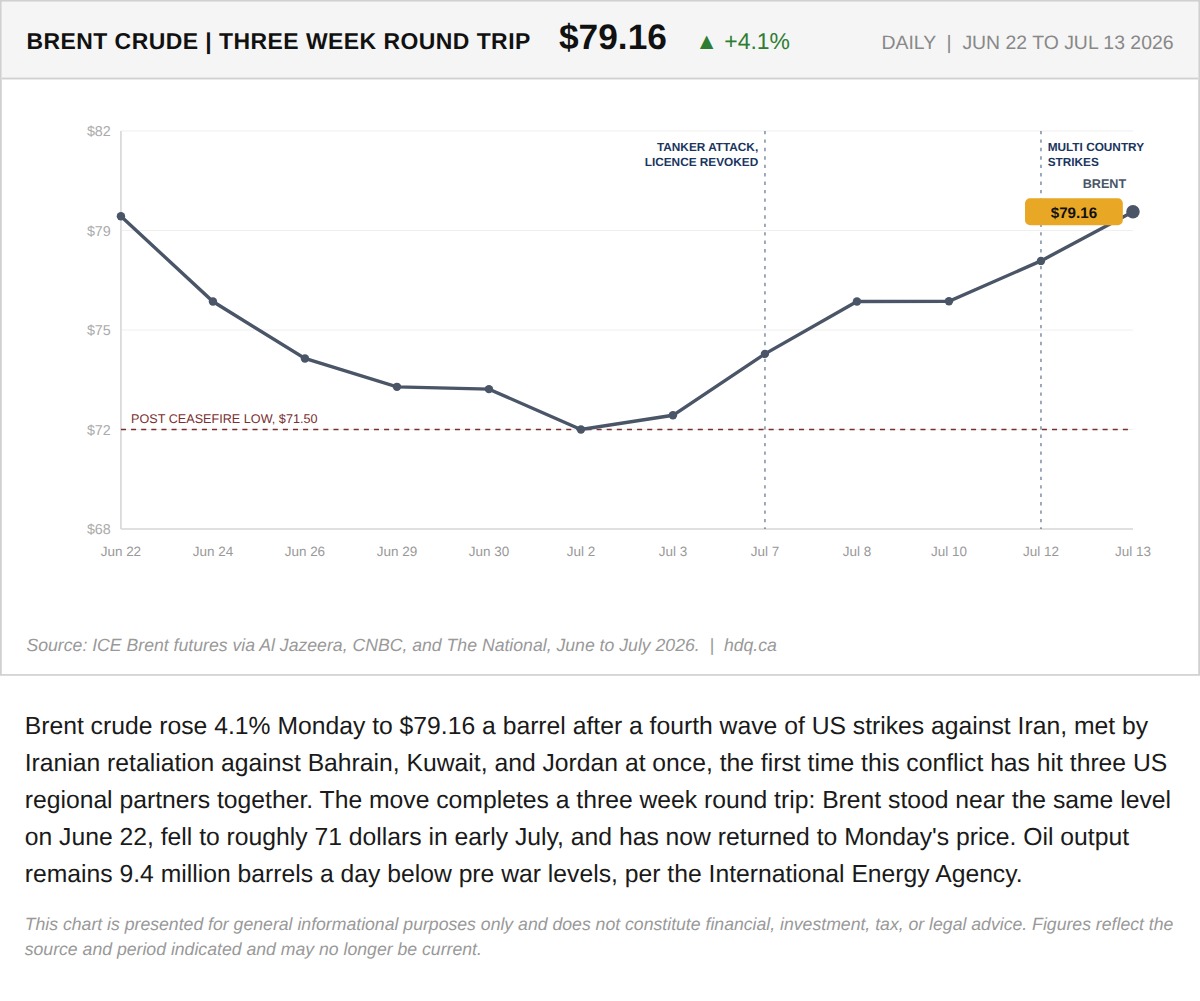
Brent crude rose 4.1% Monday to $79.16 a barrel after a fourth wave of US strikes against Iran, met by Iranian retaliation against Bahrain,…
July 13, 2026
View chart & download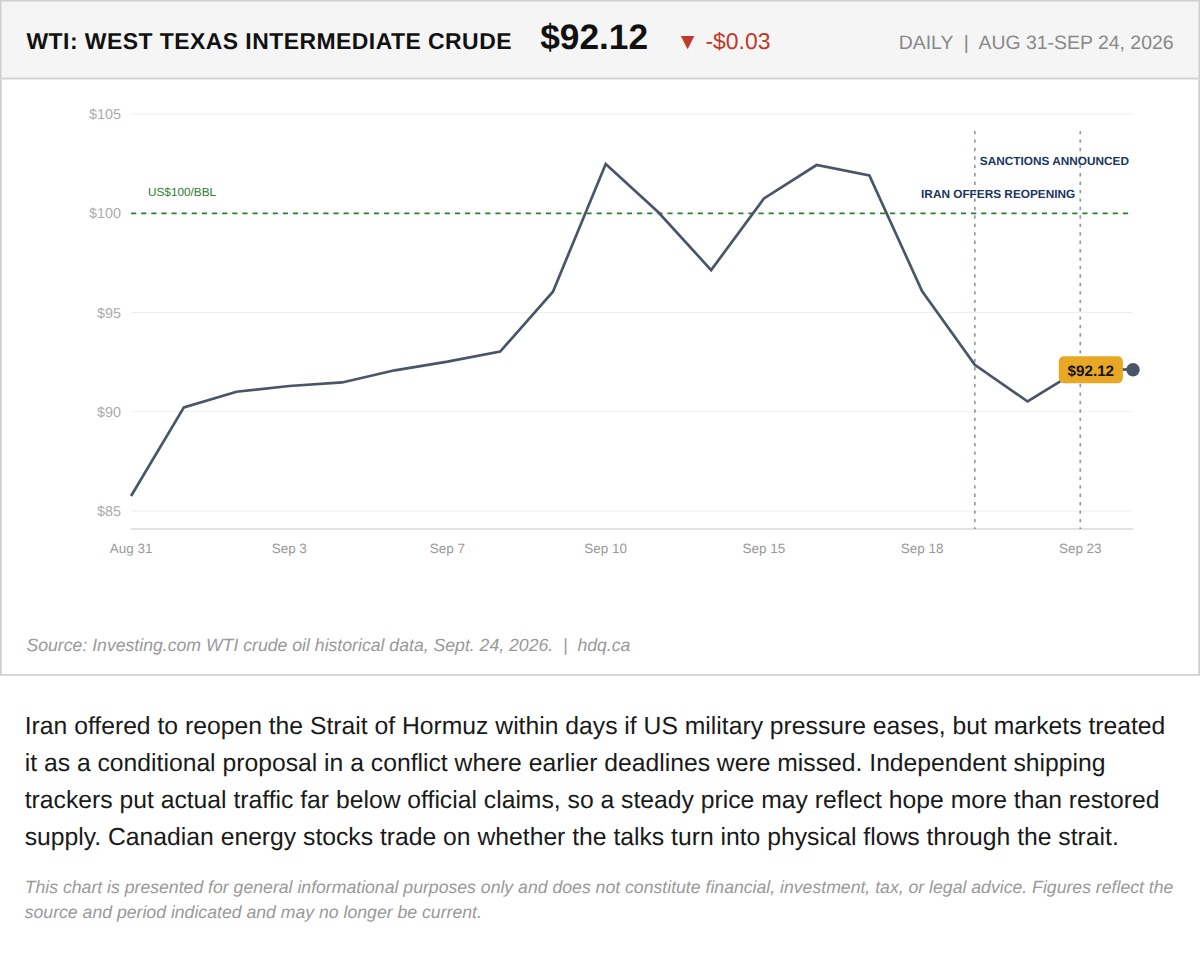
Iran offered to reopen the Strait of Hormuz within days if US military pressure eases, but markets treated it as a conditional proposal in…
WTI Crude Holds Near $92 on Hormuz Reopening Offer
September 24, 2026
View chart & download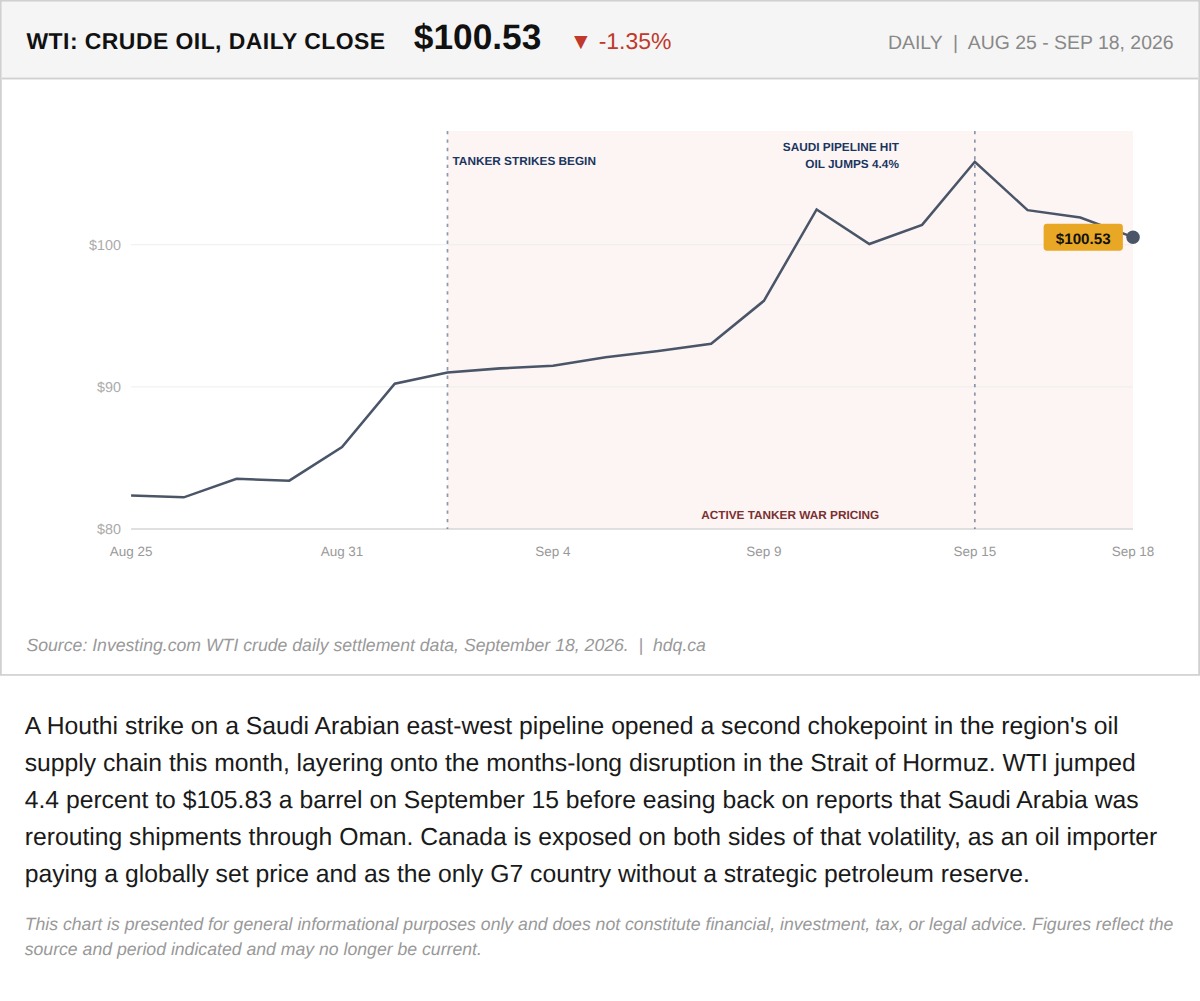
A Houthi strike on a Saudi Arabian east-west pipeline opened a second chokepoint in the region's oil supply chain this month, layering onto…
The Strait of Hormuz Story Just Got a Second Chokepoint, and Canada Has Exposure on Both Sides
September 18, 2026
View chart & download