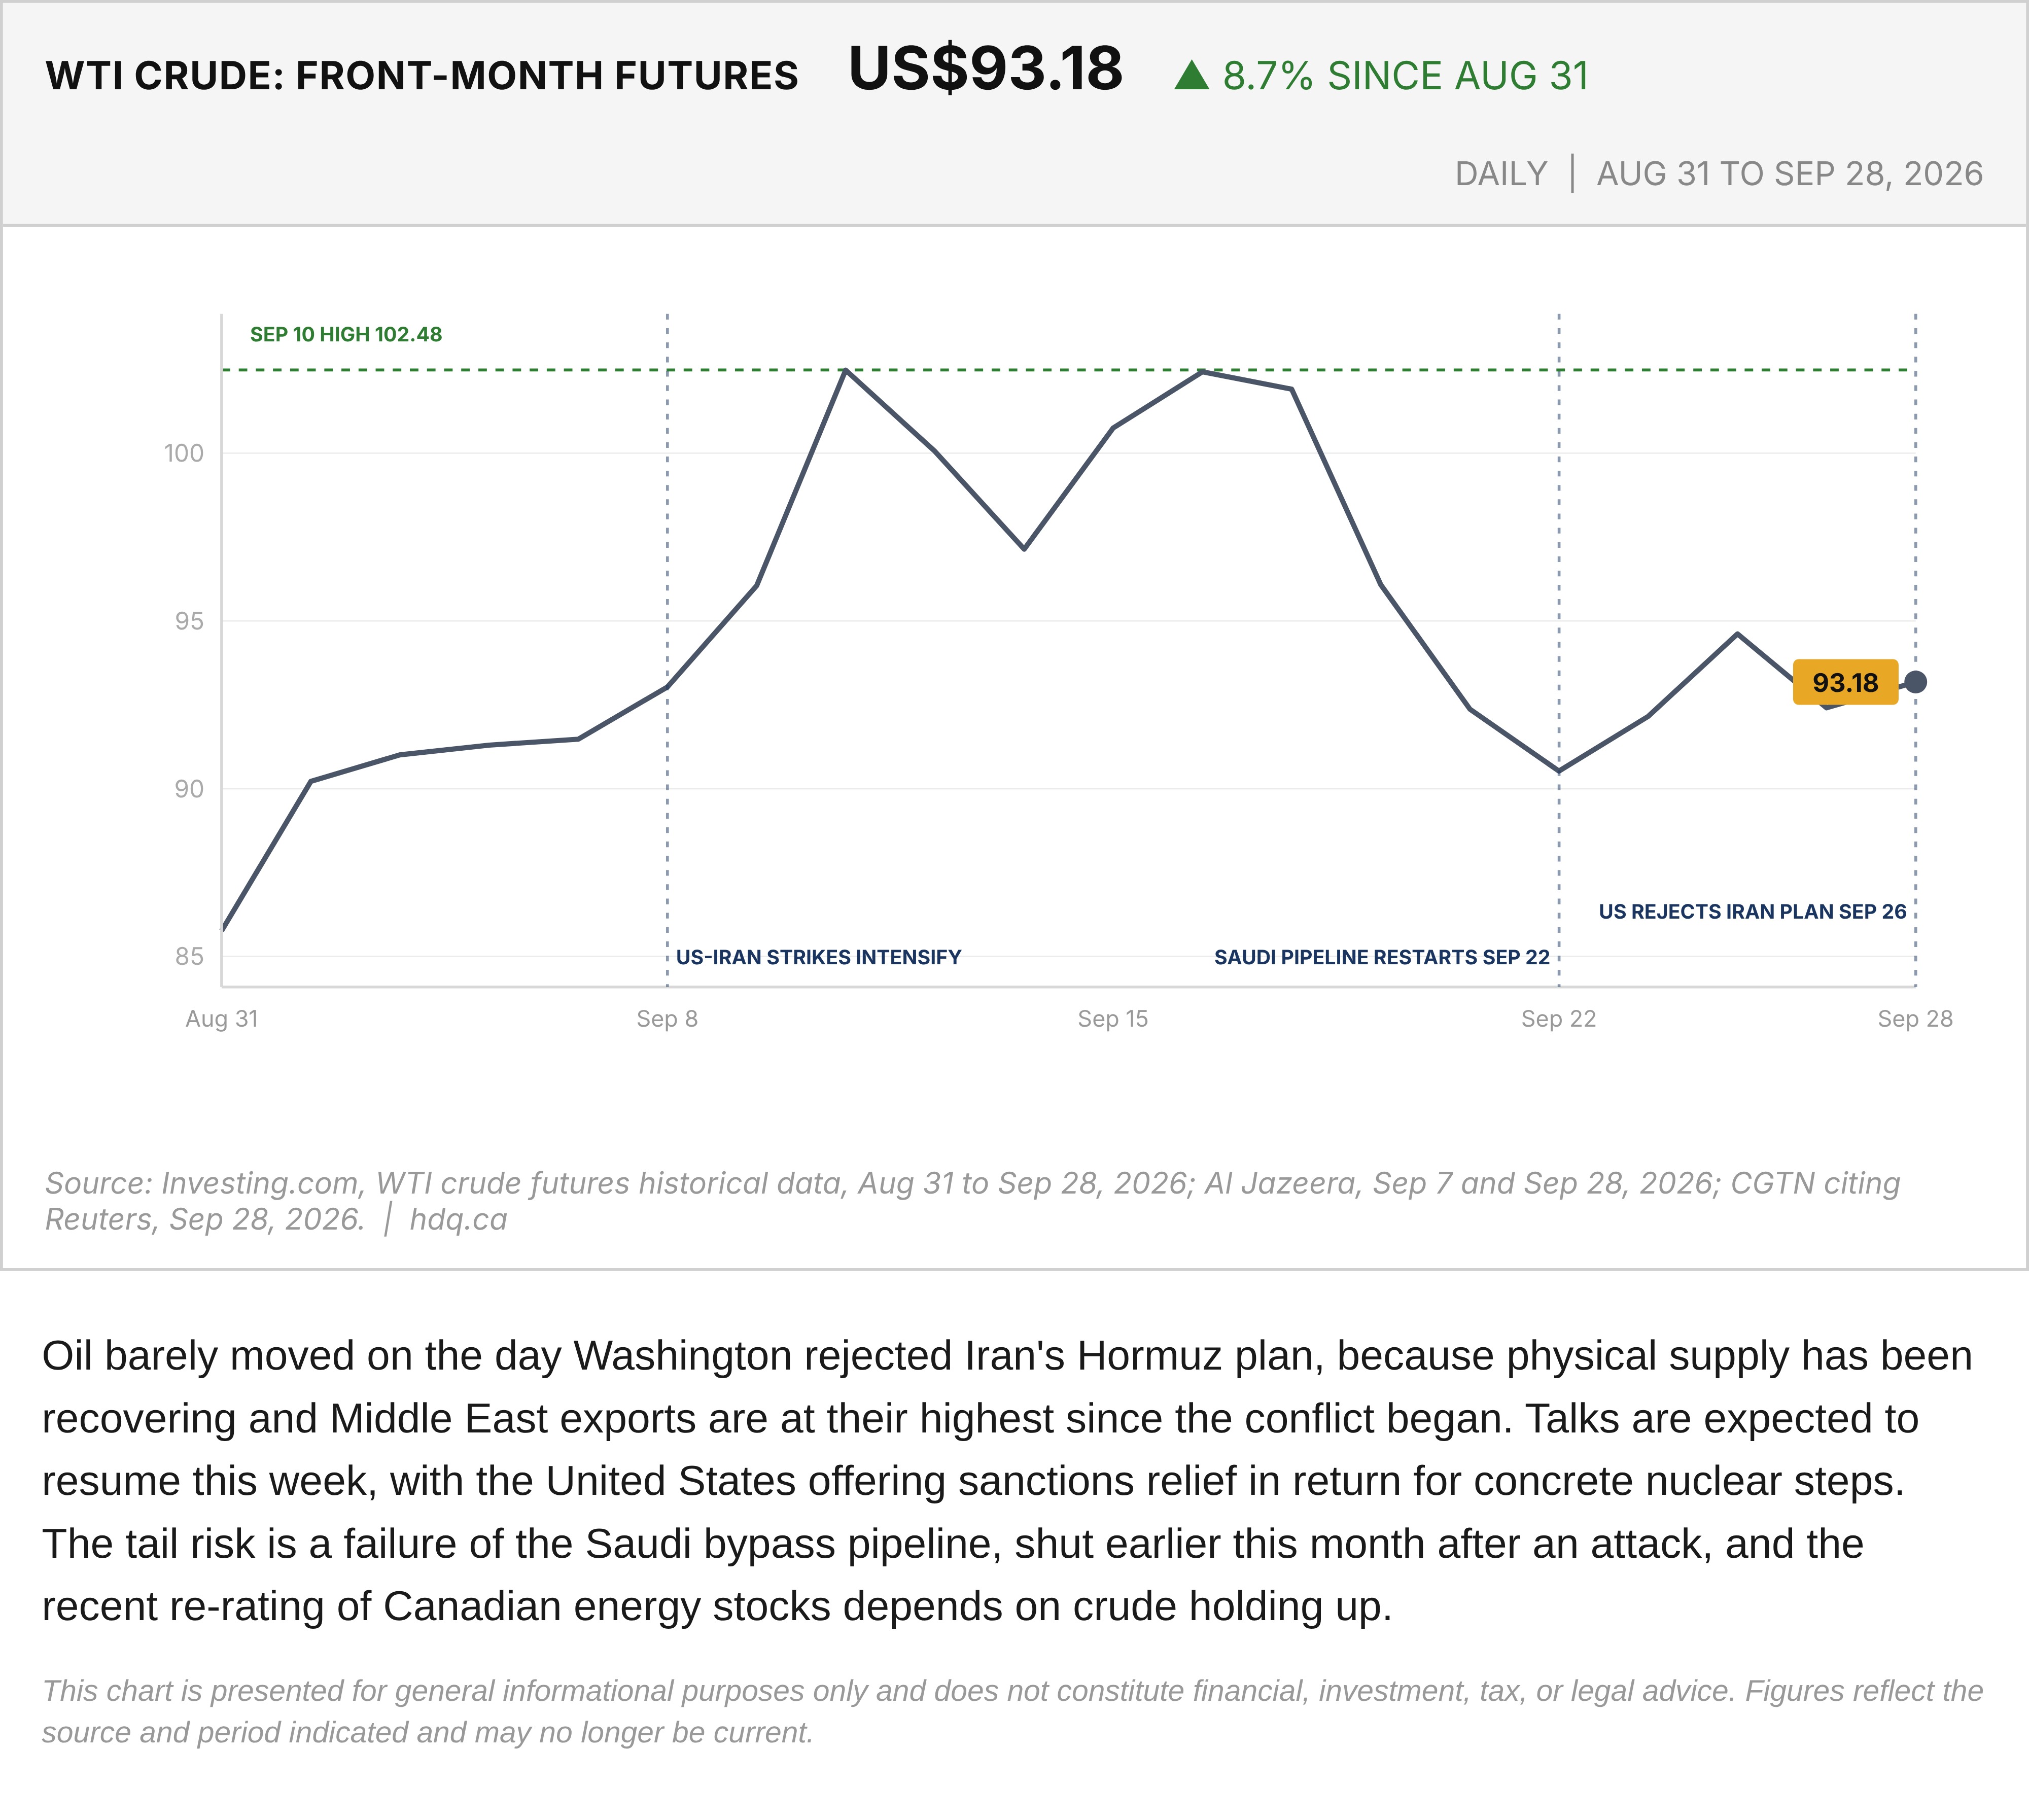
Oil barely moved on the day Washington rejected Iran's Hormuz plan, because physical supply has been recovering and Middle East exports are at their highest since the conflict began. Talks are expected to resume this week, with the United States offering sanctions relief in return for concrete nuclear steps. The tail risk is a failure of the Saudi bypass pipeline, shut earlier this month after an attack, and the recent re-rating of Canadian energy stocks depends on crude holding up.
This chart is presented for general informational purposes only and does not constitute financial, investment, tax, or legal advice. Figures reflect the source and period indicated and may no longer be current.
Related charts
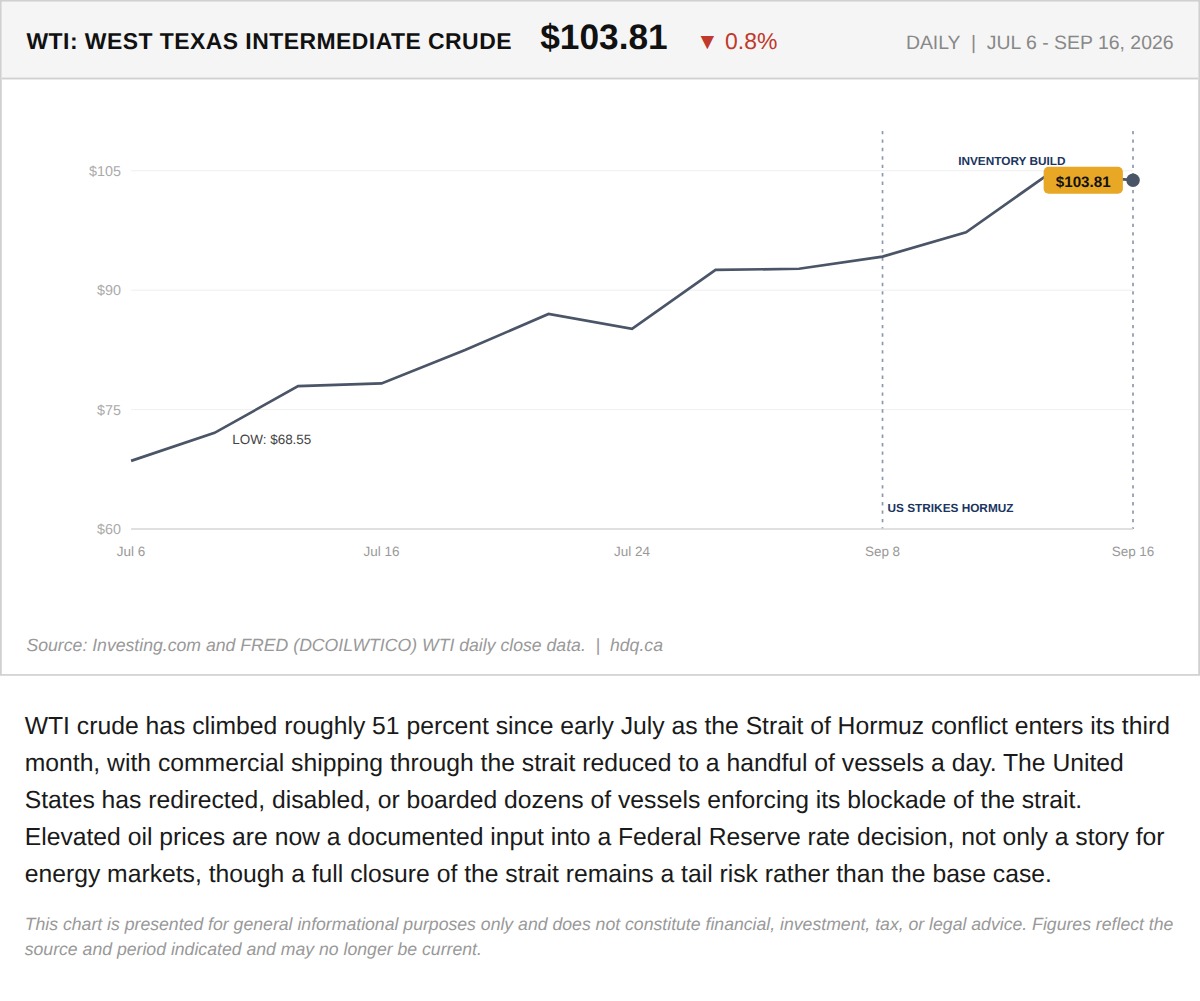
WTI crude has climbed roughly 51 percent since early July as the Strait of Hormuz conflict enters its third month, with commercial shipping…
Why a War in the Strait of Hormuz Is Steering a Federal Reserve Decision
September 16, 2026
View chart & download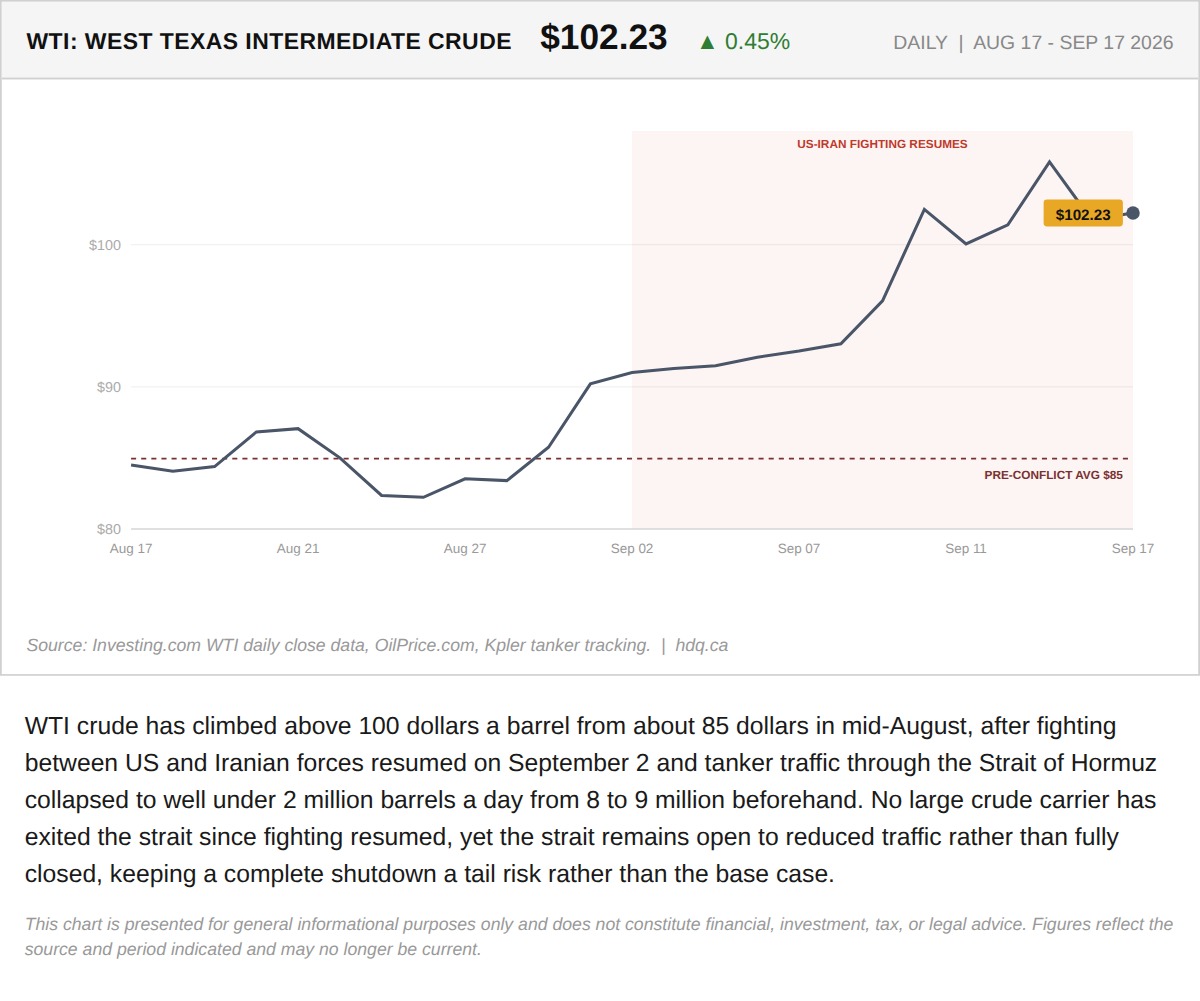
WTI crude has climbed above 100 dollars a barrel from about 85 dollars in mid-August, after fighting between US and Iranian forces resumed…
Why Oil Crossed 100 Dollars Without a Full Strait of Hormuz Closure
September 17, 2026
View chart & download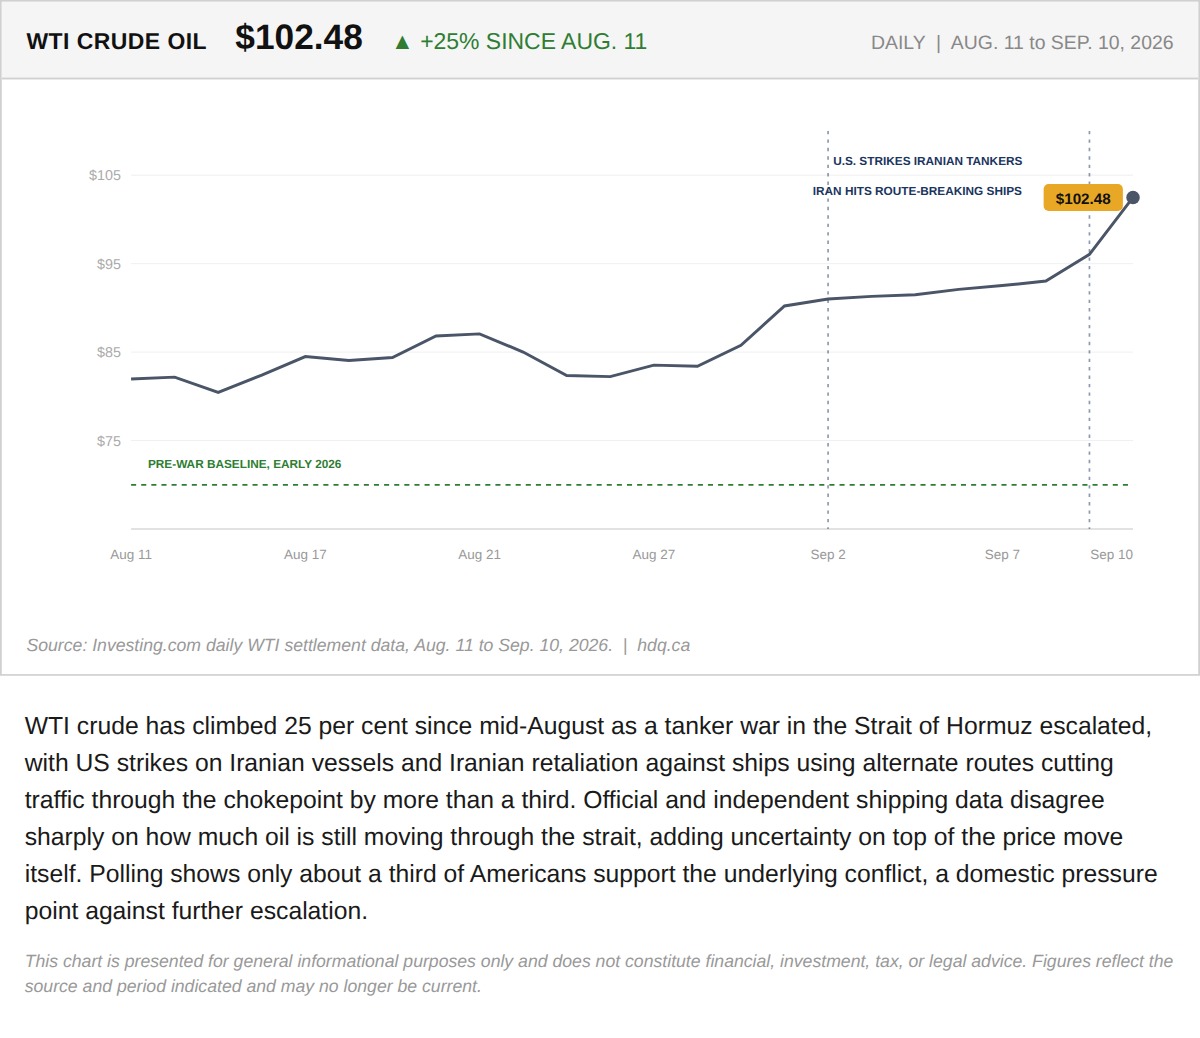
WTI crude has climbed 25 per cent since mid-August as a tanker war in the Strait of Hormuz escalated, with US strikes on Iranian vessels…
The Tanker War in the Strait of Hormuz Just Repriced Every Canadian Energy Position
September 11, 2026
View chart & download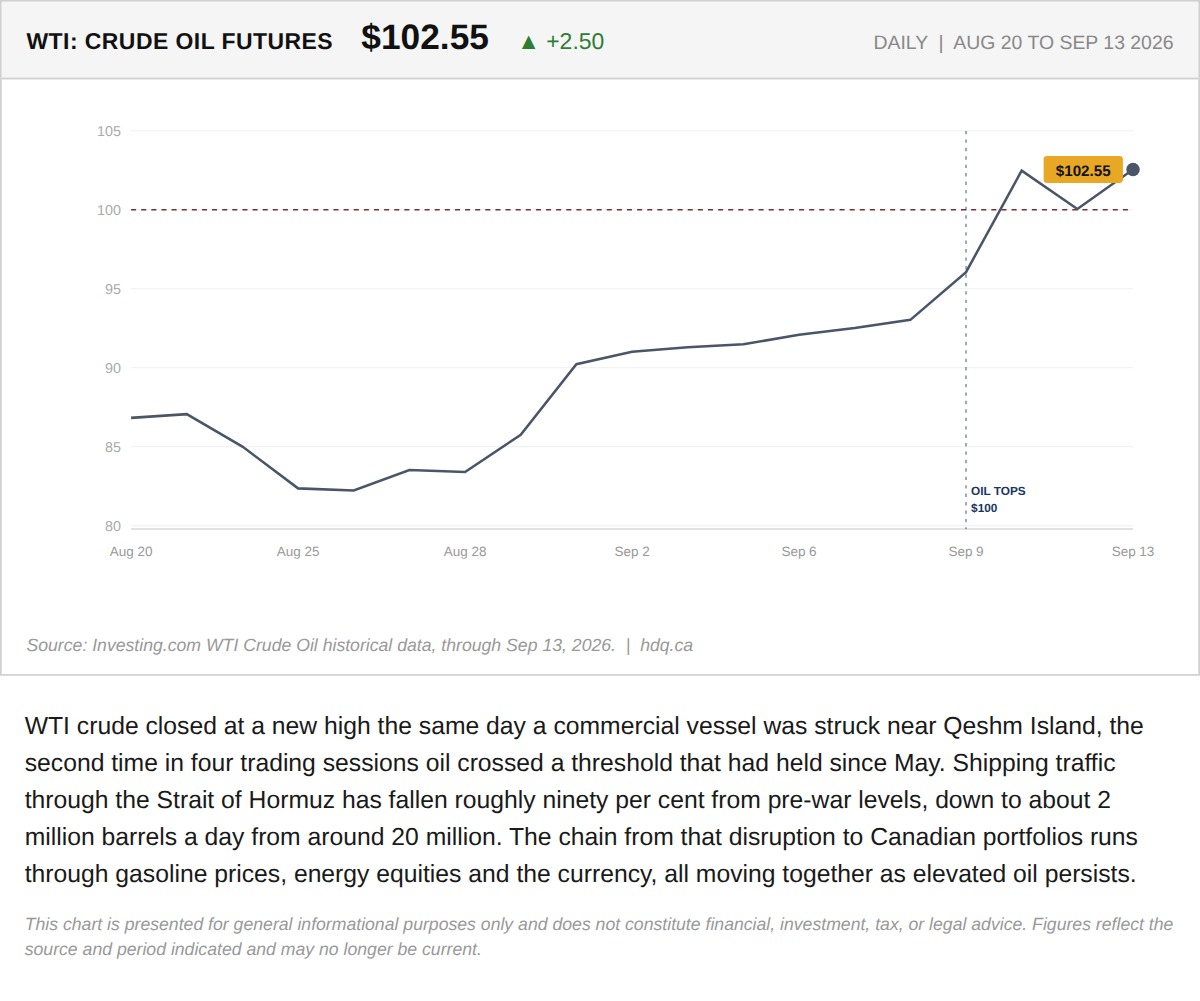
WTI crude closed at a new high the same day a commercial vessel was struck near Qeshm Island, the second time in four trading sessions oil…
A Tanker Strike Near Qeshm Island Confirms Oil Above $100 Is Not a Blip
September 14, 2026
View chart & download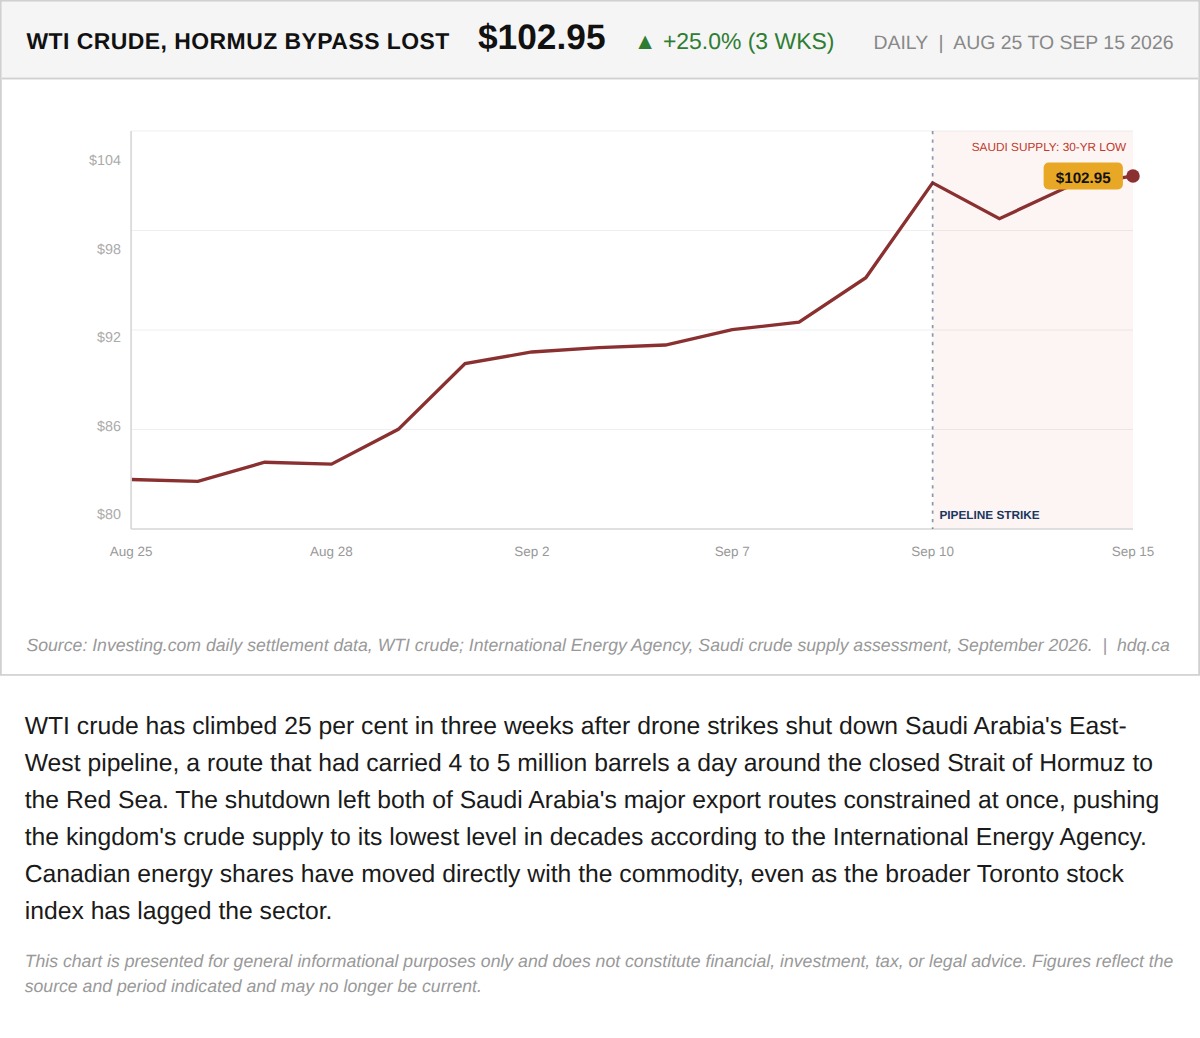
WTI crude has climbed 25 per cent in three weeks after drone strikes shut down Saudi Arabia's East-West pipeline, a route that had carried…
Iran Closed the Strait of Hormuz. This Week, Militias Closed the Detour Around It.
September 15, 2026
View chart & download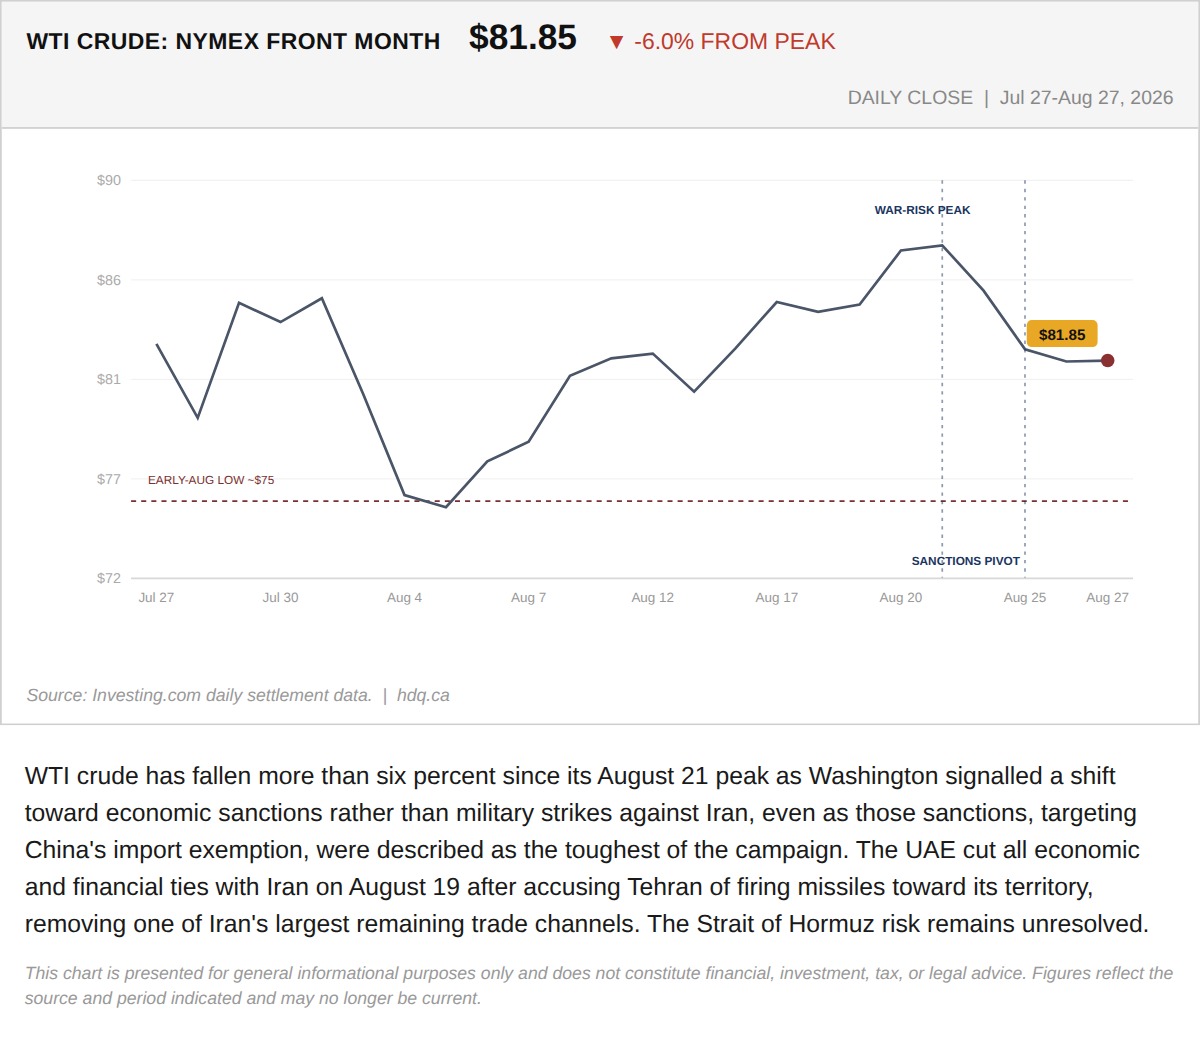
WTI crude has fallen more than six percent since its August 21 peak as Washington signalled a shift toward economic sanctions rather than…
Oil Fell 6% When Washington Chose Sanctions Over Strikes
August 27, 2026
View chart & download