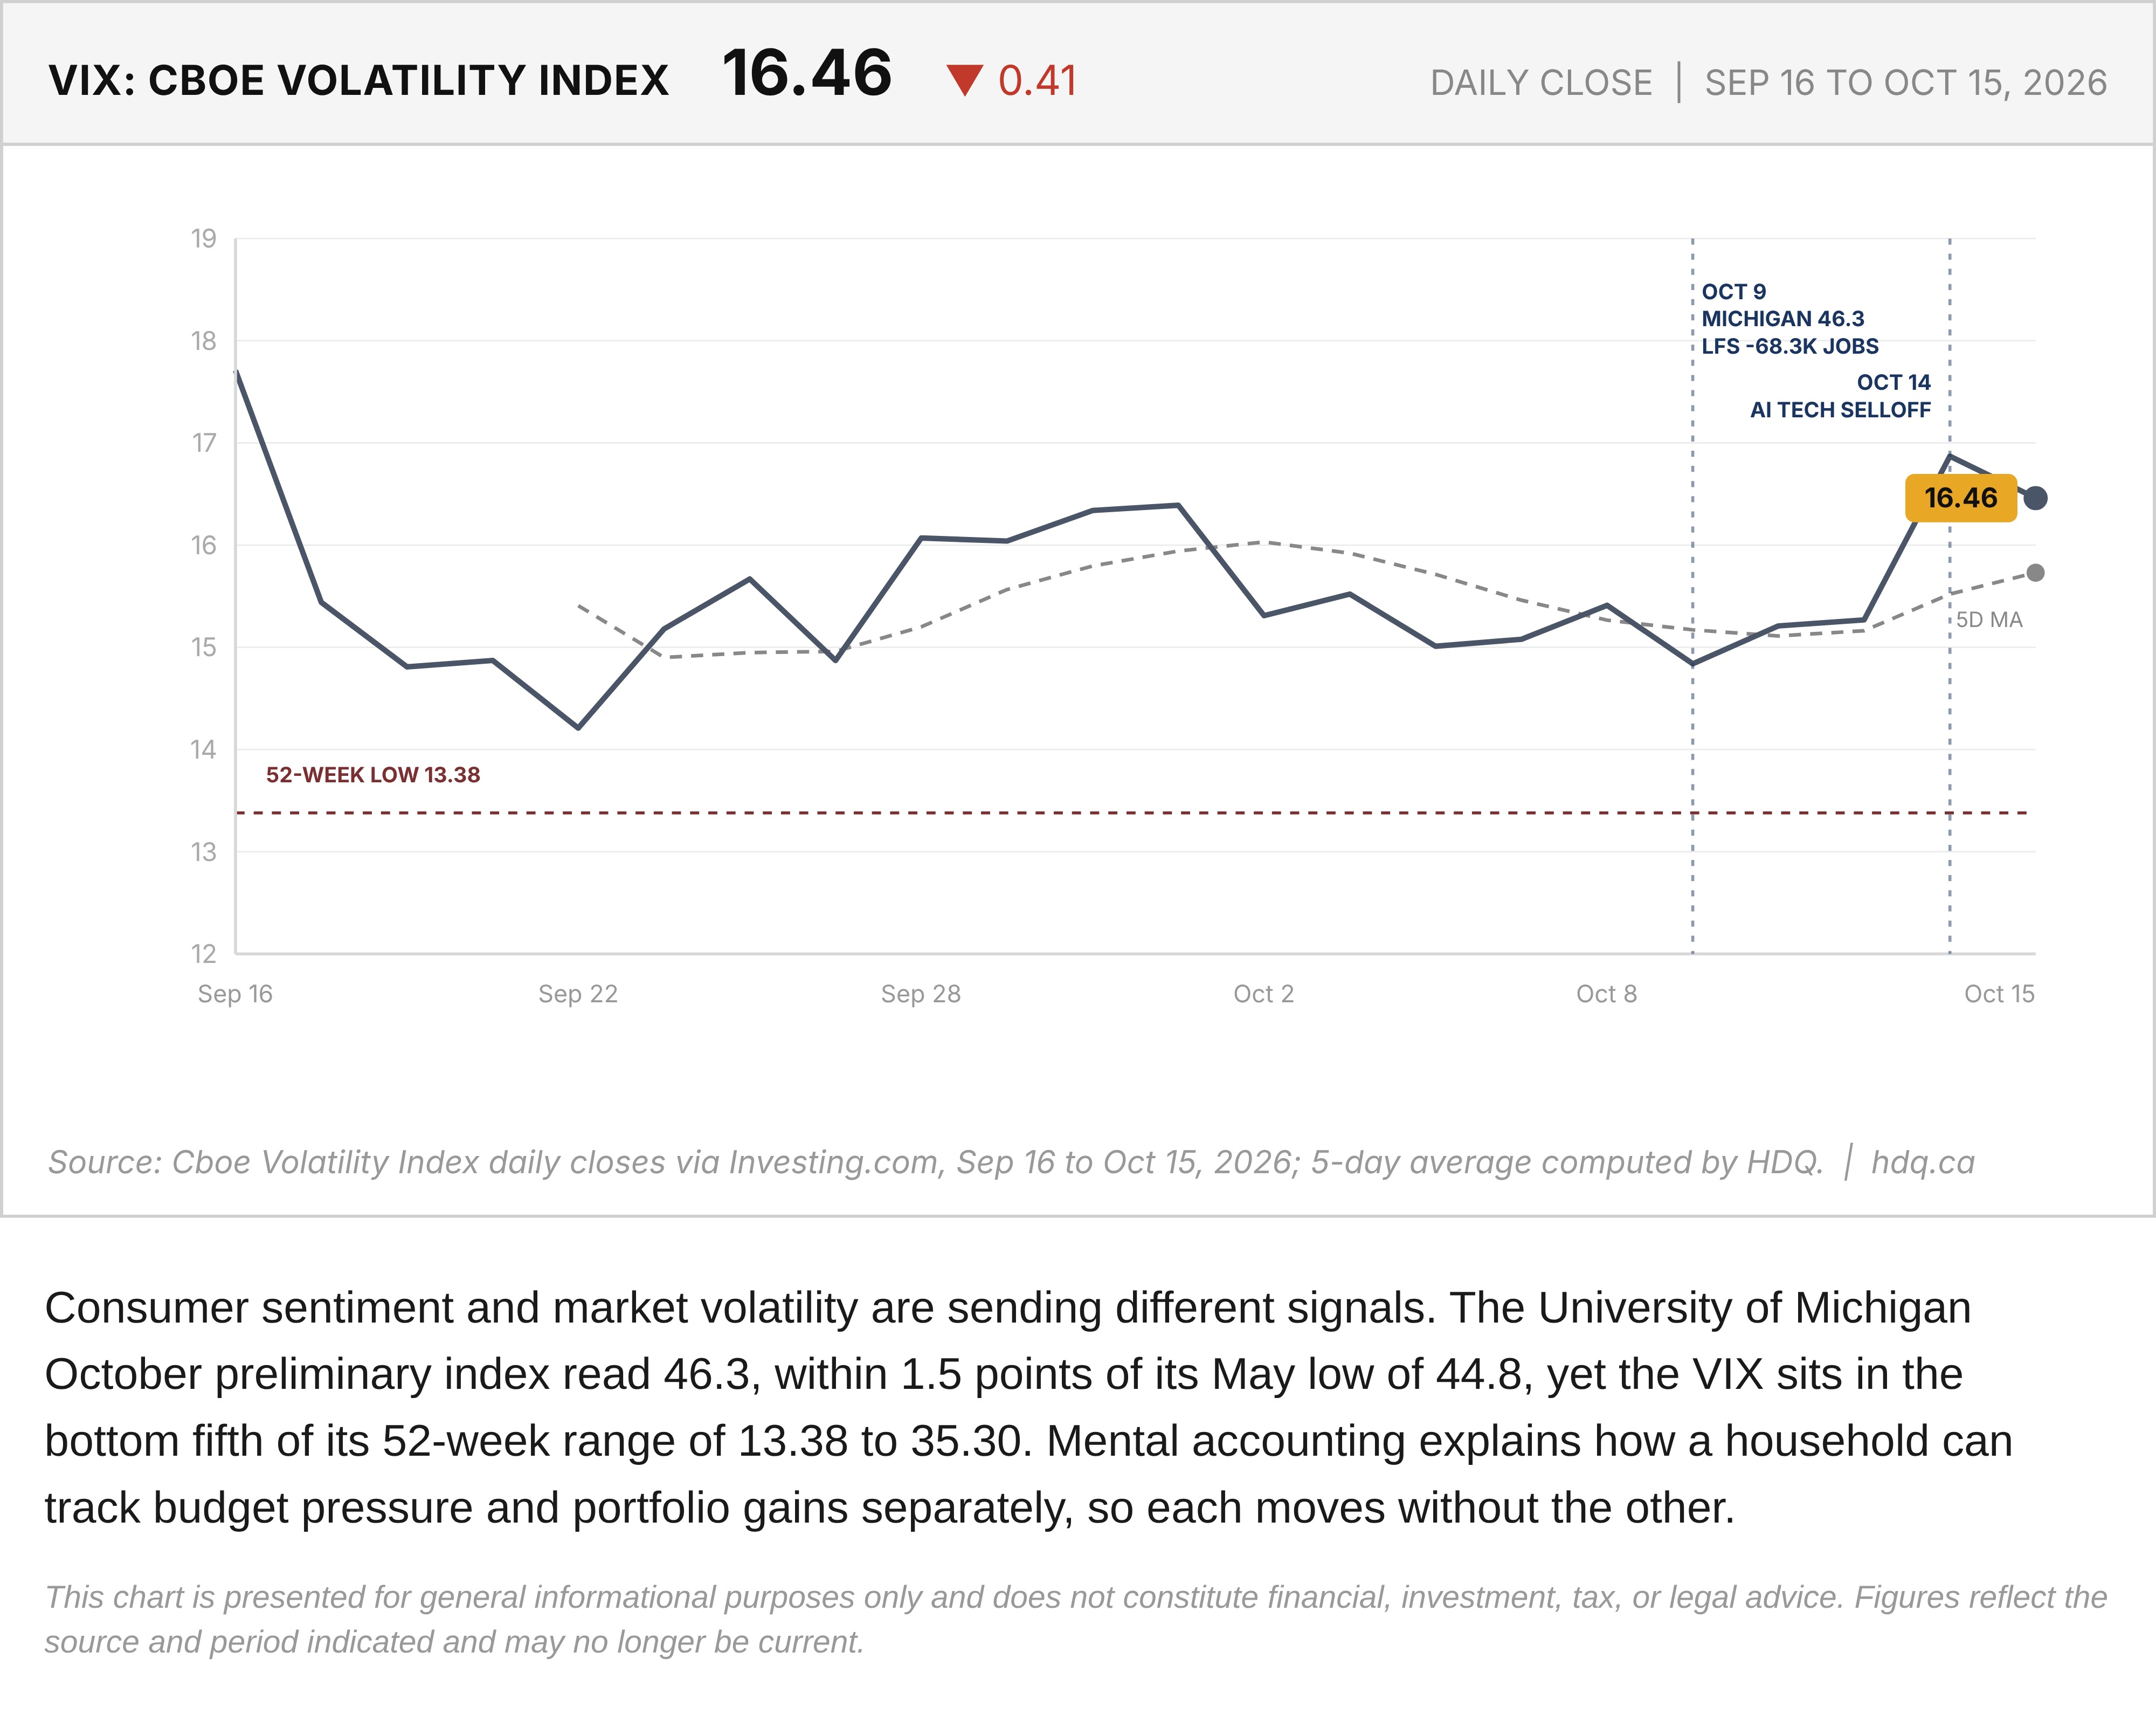
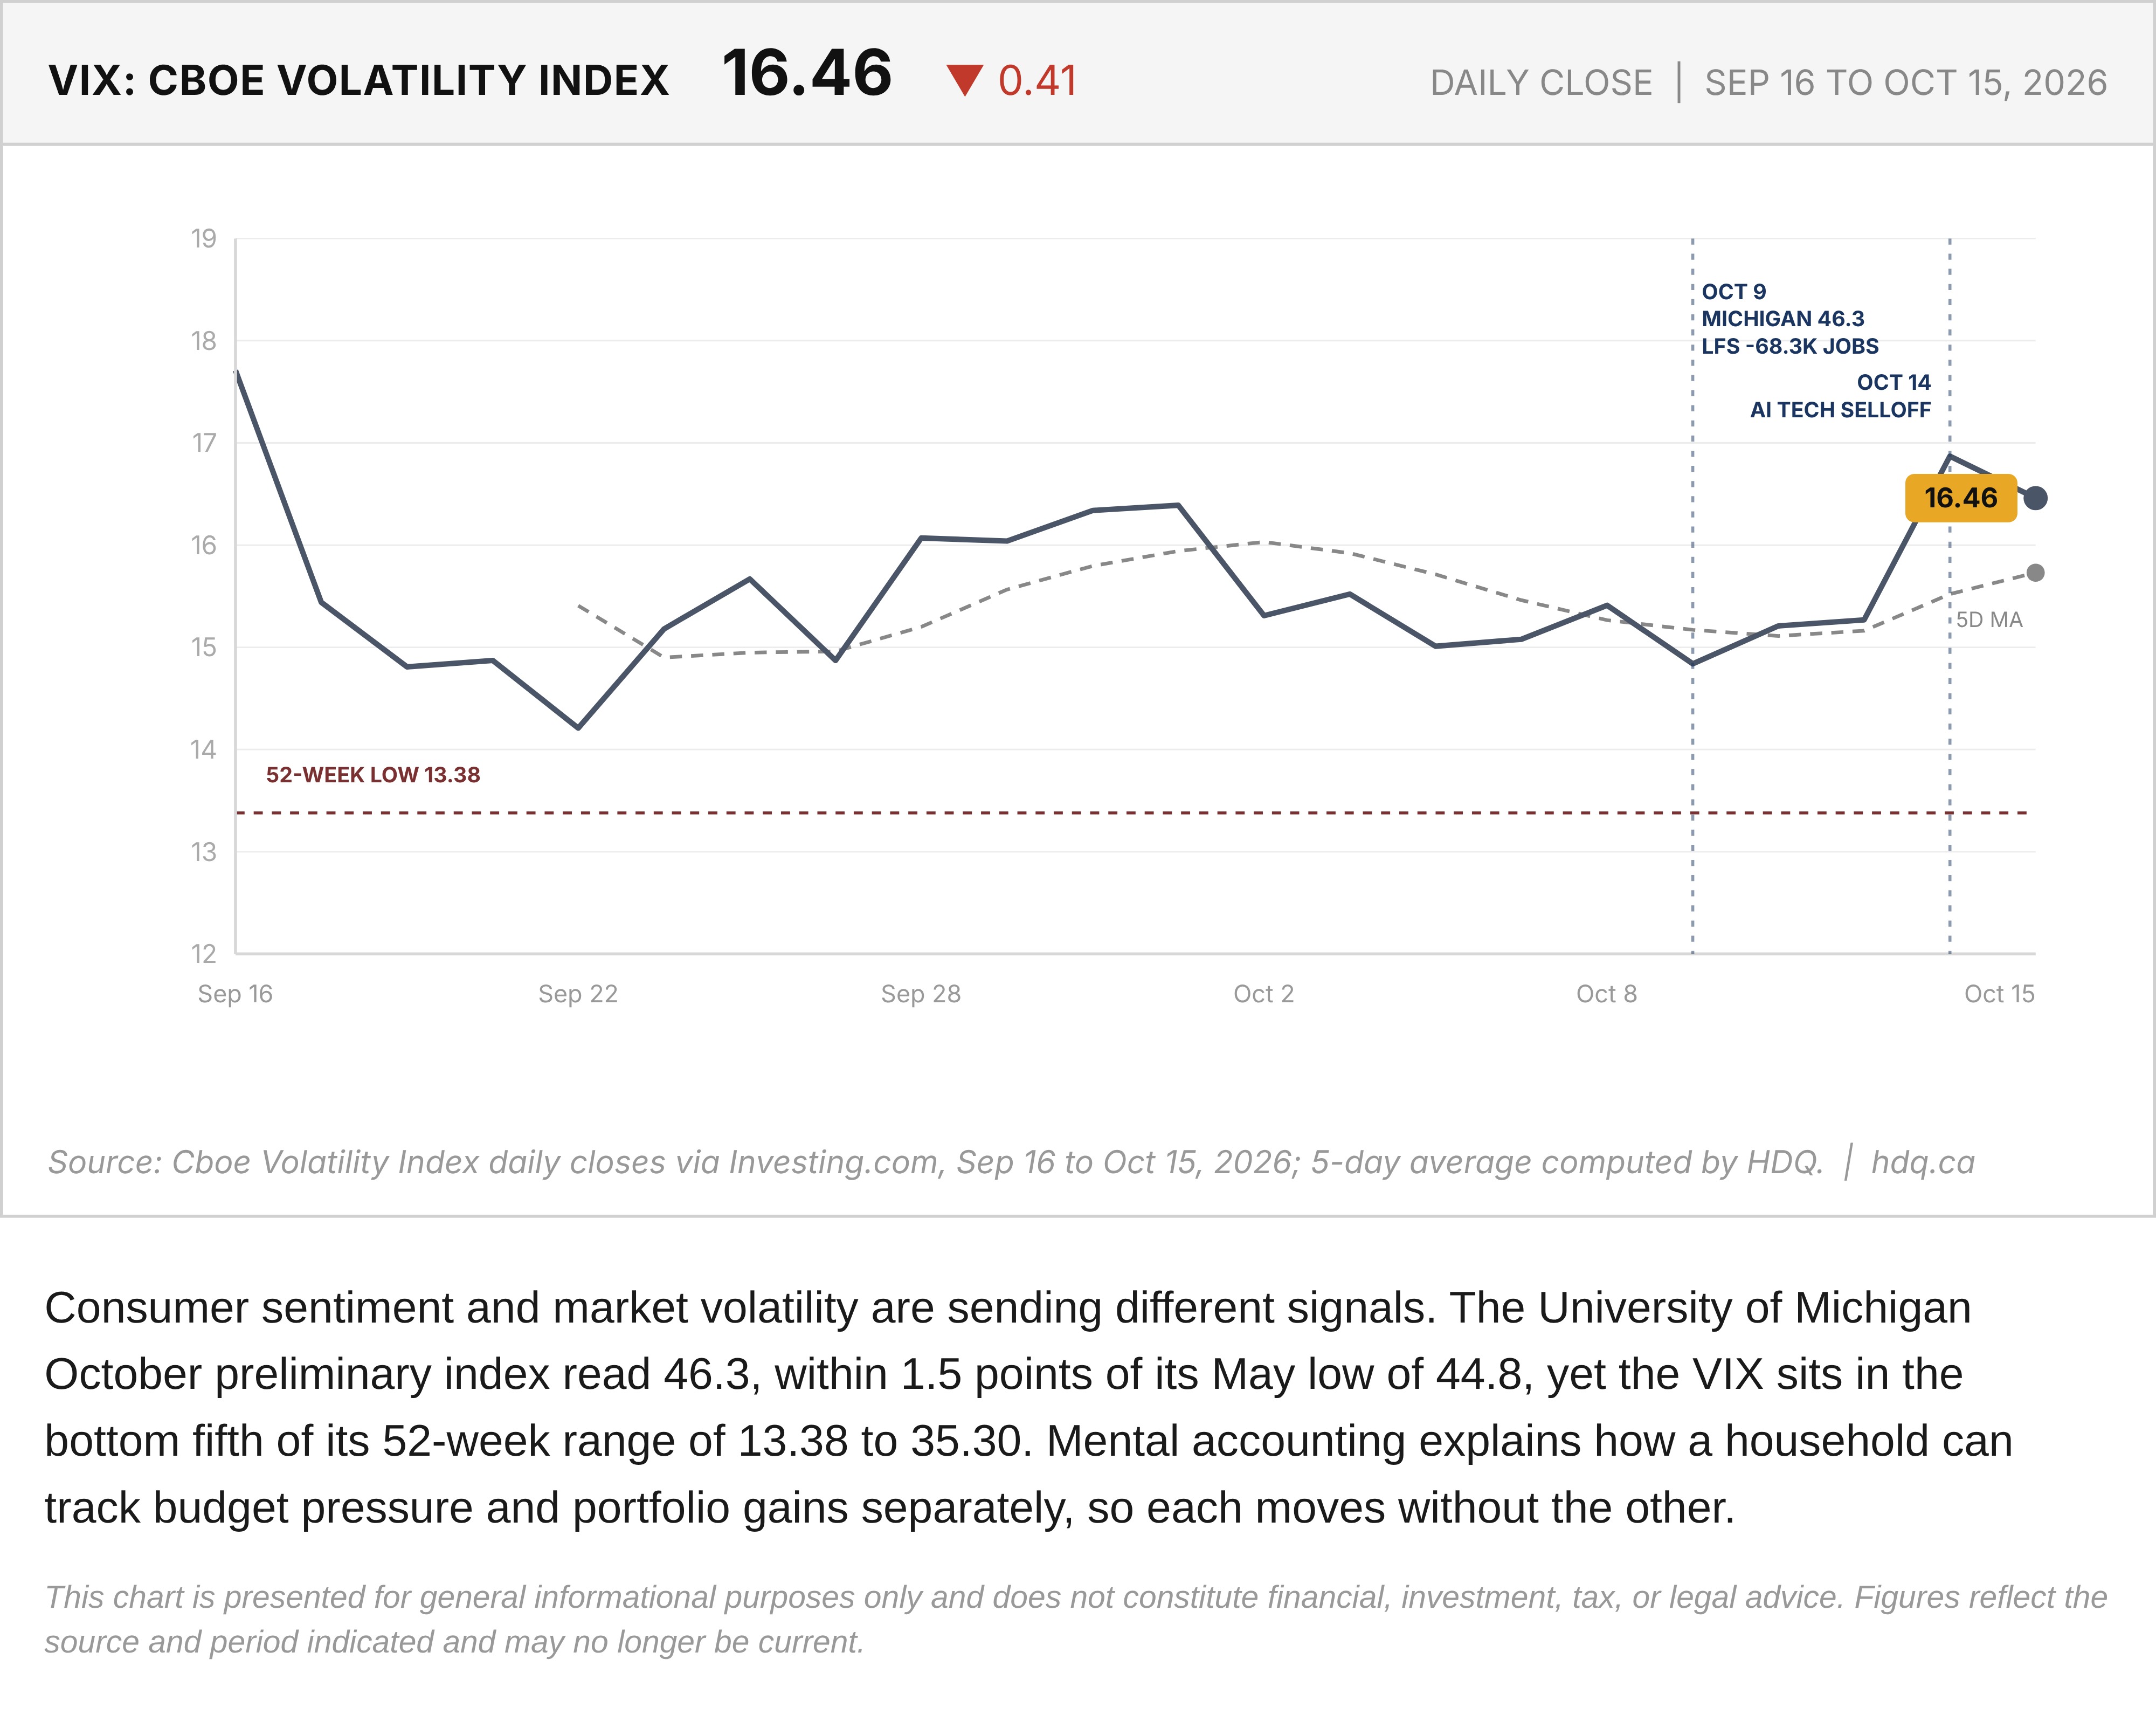
Consumer sentiment and market volatility are sending different signals. The University of Michigan October preliminary index read 46.3, within 1.5 points of its May low of 44.8, yet the VIX sits in the bottom fifth of its 52-week range of 13.38 to 35.30. Mental accounting explains how a household can track budget pressure and portfolio gains separately, so each moves without the other.
This chart is presented for general informational purposes only and does not constitute financial, investment, tax, or legal advice. Figures reflect the source and period indicated and may no longer be current.
Related charts
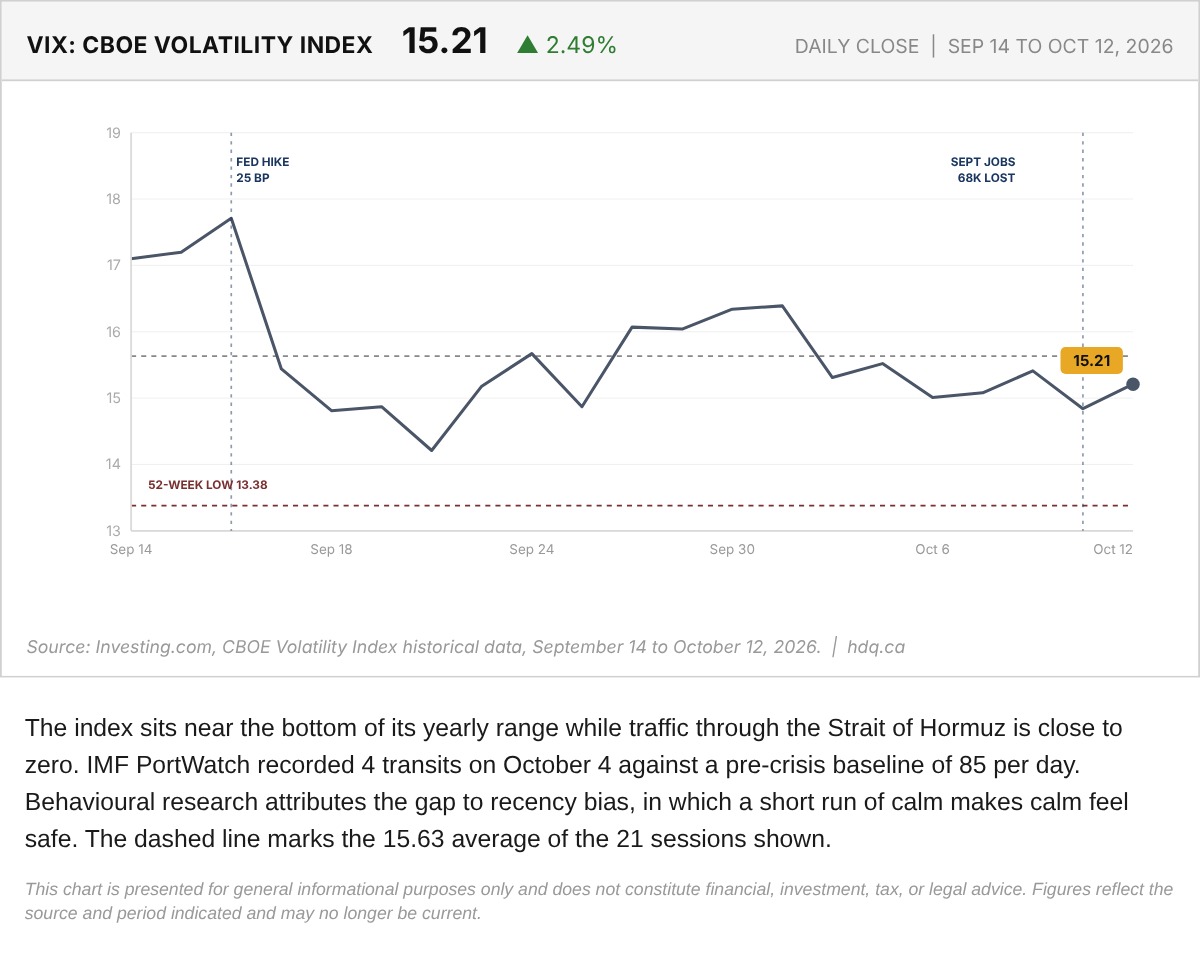
The index sits near the bottom of its yearly range while traffic through the Strait of Hormuz is close to zero.
VIX Volatility Index, September 14 to October 12, 2026
October 12, 2026
View chart & download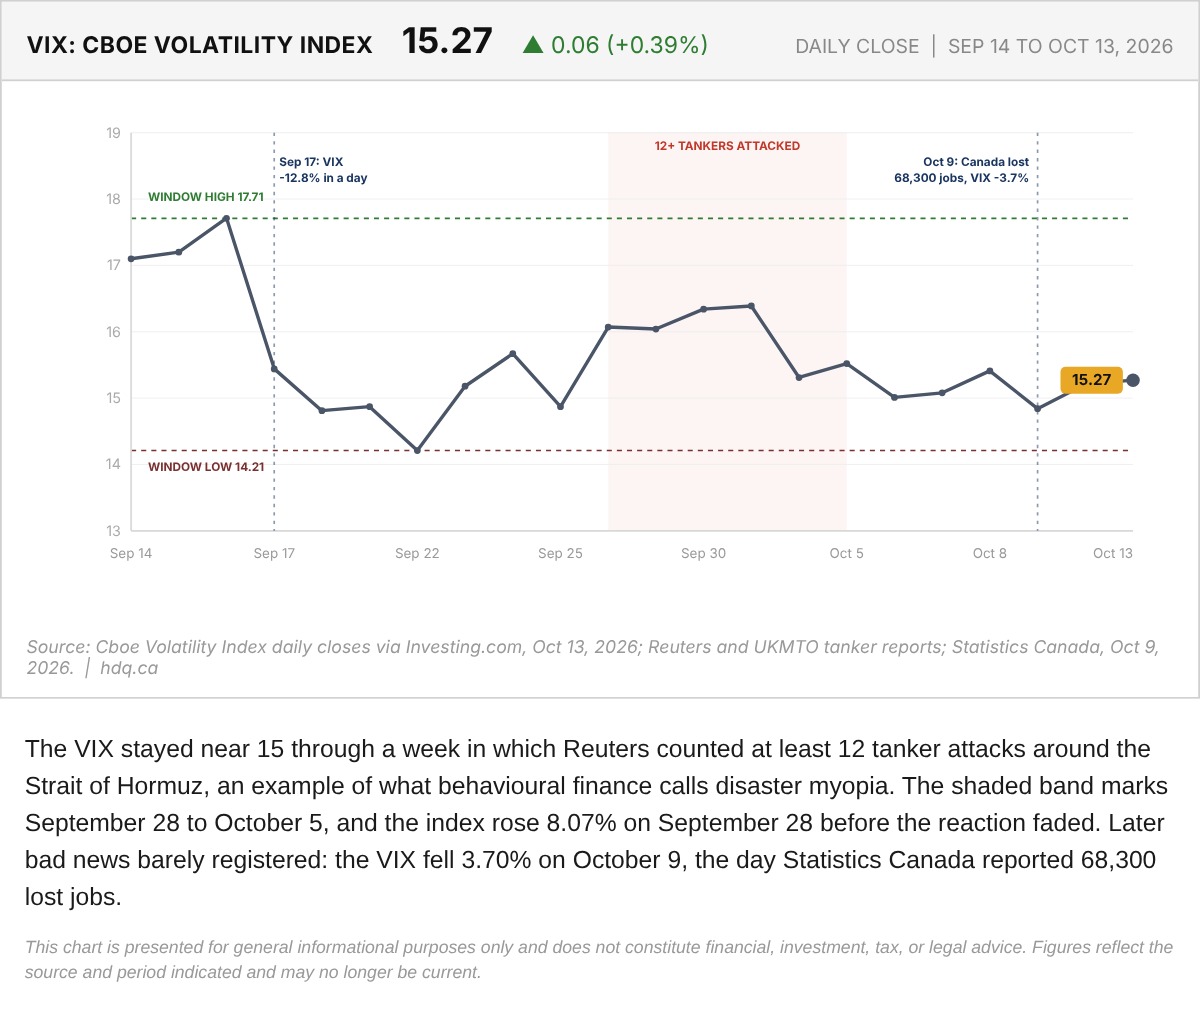
The VIX stayed near 15 through a week in which Reuters counted at least 12 tanker attacks around the Strait of Hormuz, an example of what behavioural finance calls disaster myopia.
VIX Volatility Index and the Hormuz Tanker Attack Window
October 13, 2026
View chart & download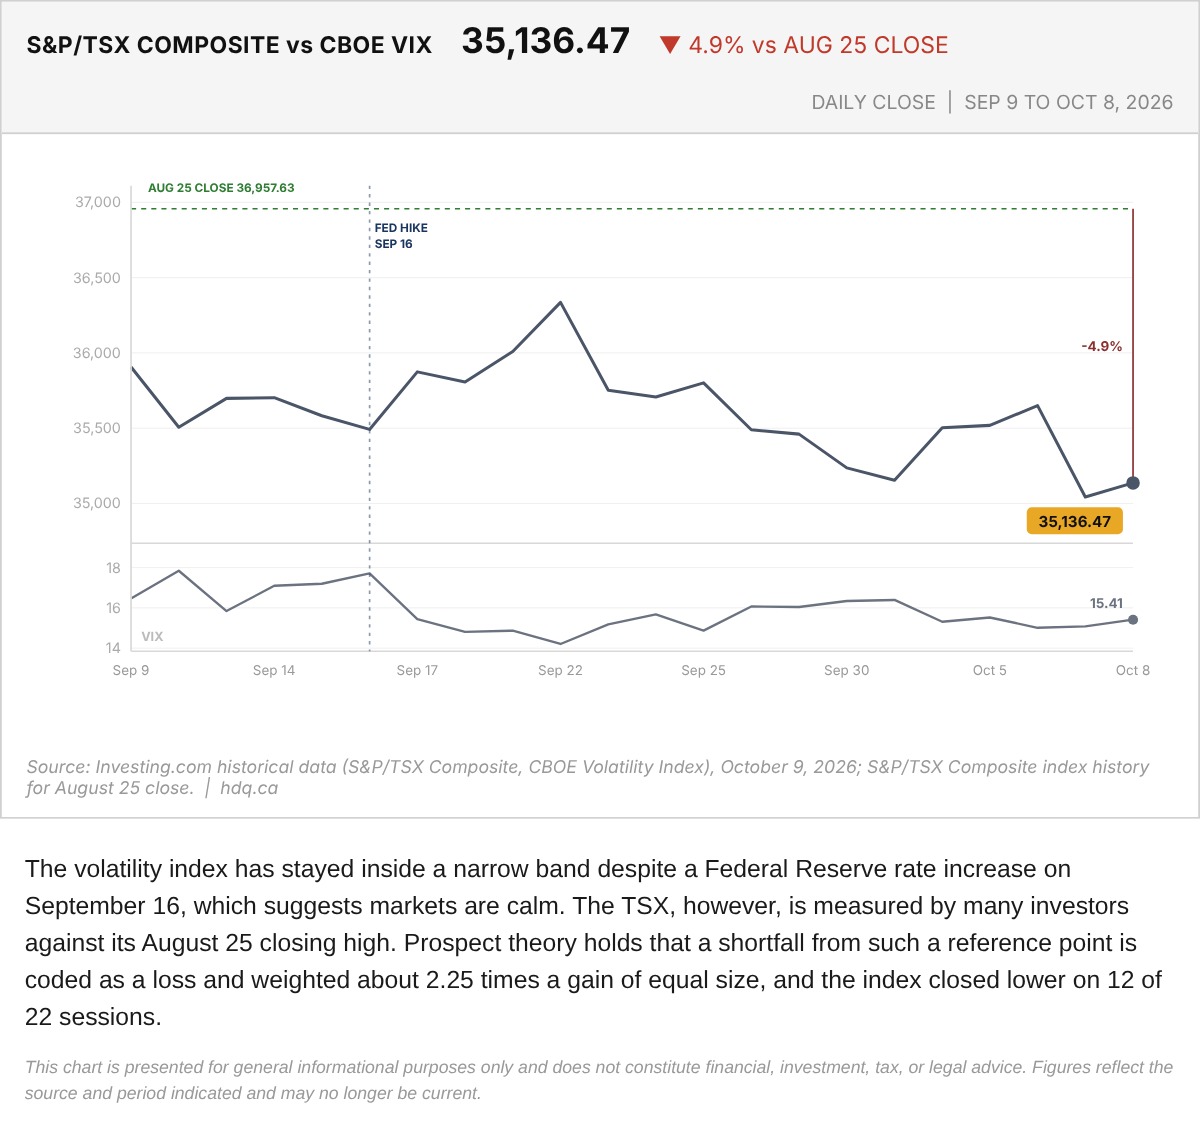
The volatility index has stayed inside a narrow band despite a Federal Reserve rate increase on September 16, which suggests markets are calm.
S&P/TSX Composite Against the Cboe VIX, September 9 to October 8
October 9, 2026
View chart & download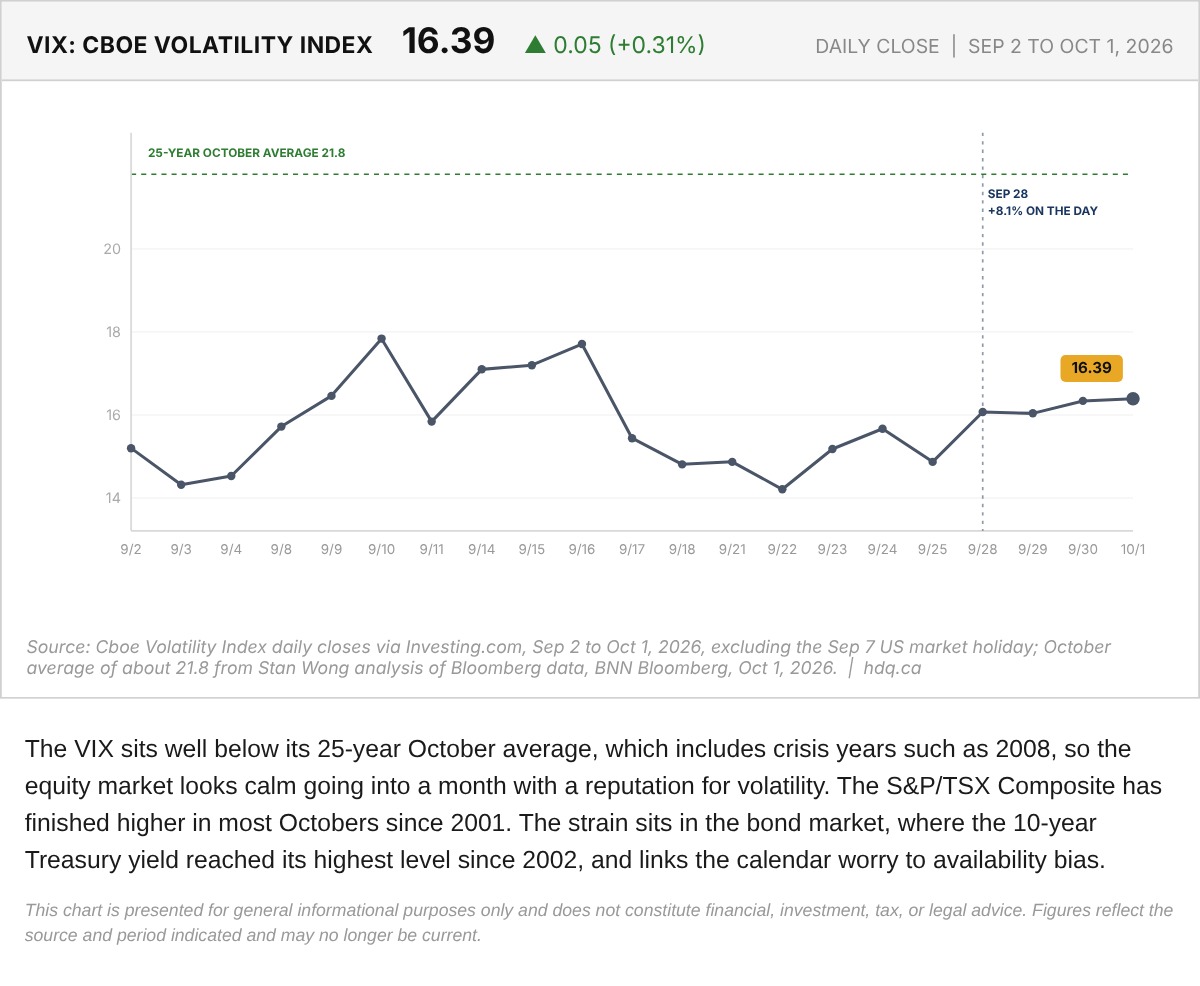
The VIX sits well below its 25-year October average, which includes crisis years such as 2008, so the equity market looks calm going into a month with a reputation for volatility.
Cboe Volatility Index (VIX) and the October Average, September 2 to October 1, 2026
October 2, 2026
View chart & download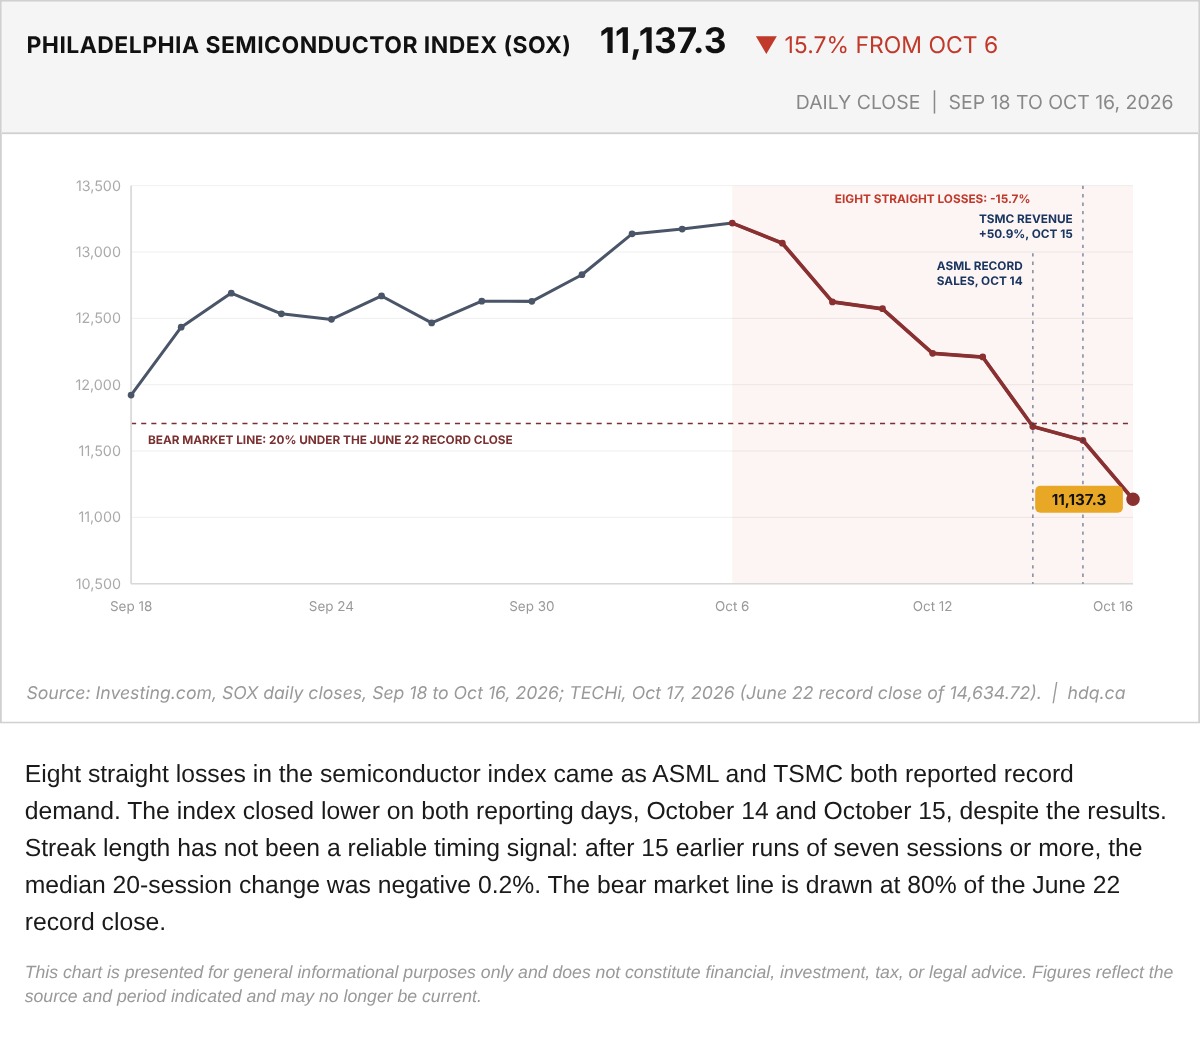
Eight straight losses in the semiconductor index came as ASML and TSMC both reported record demand.
Philadelphia Semiconductor Index, September 18 to October 16, 2026
October 16, 2026
View chart & download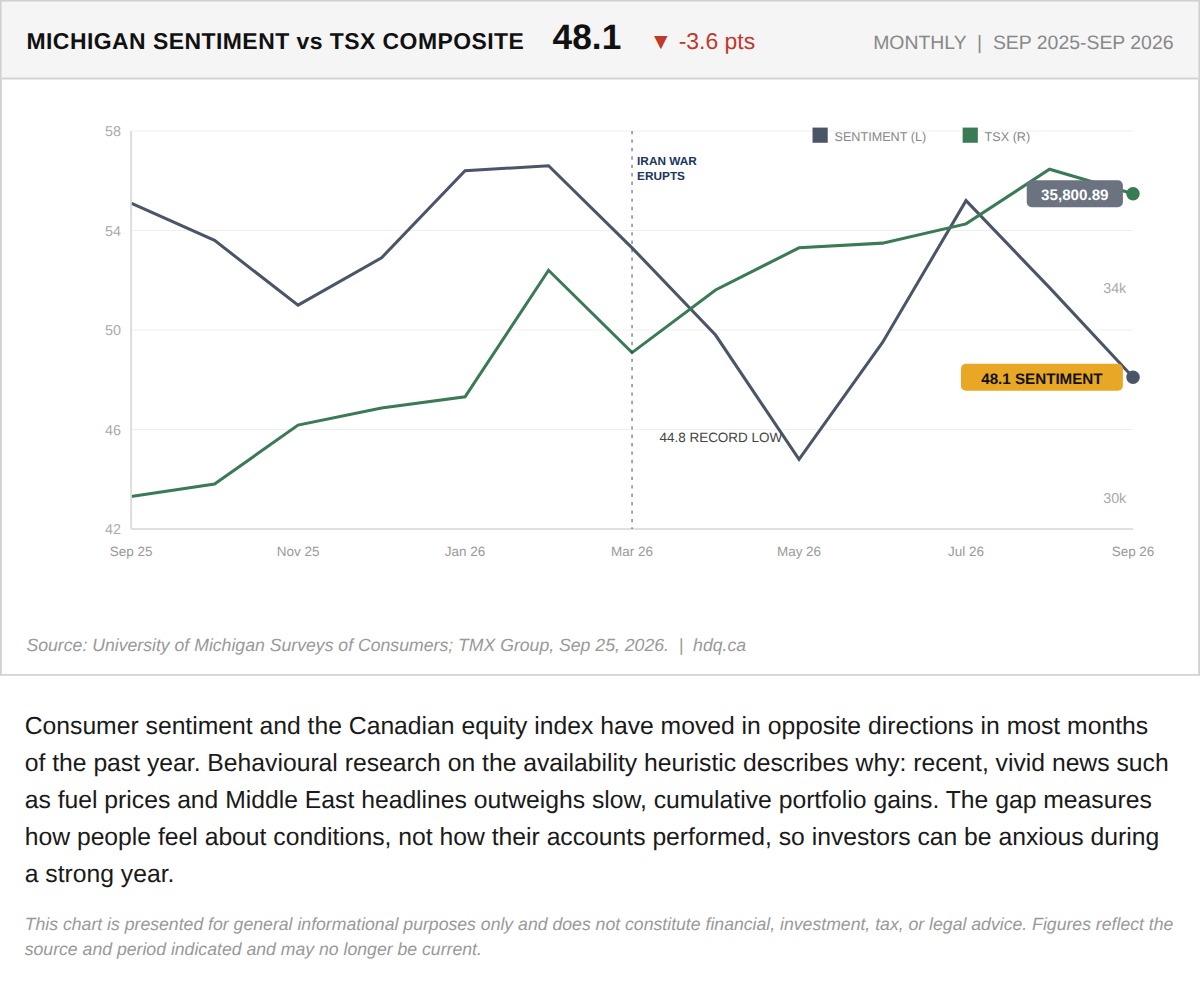
Consumer sentiment and the Canadian equity index have moved in opposite directions in most months of the past year.
Consumer Sentiment Falls While the TSX Rises
September 28, 2026
View chart & download