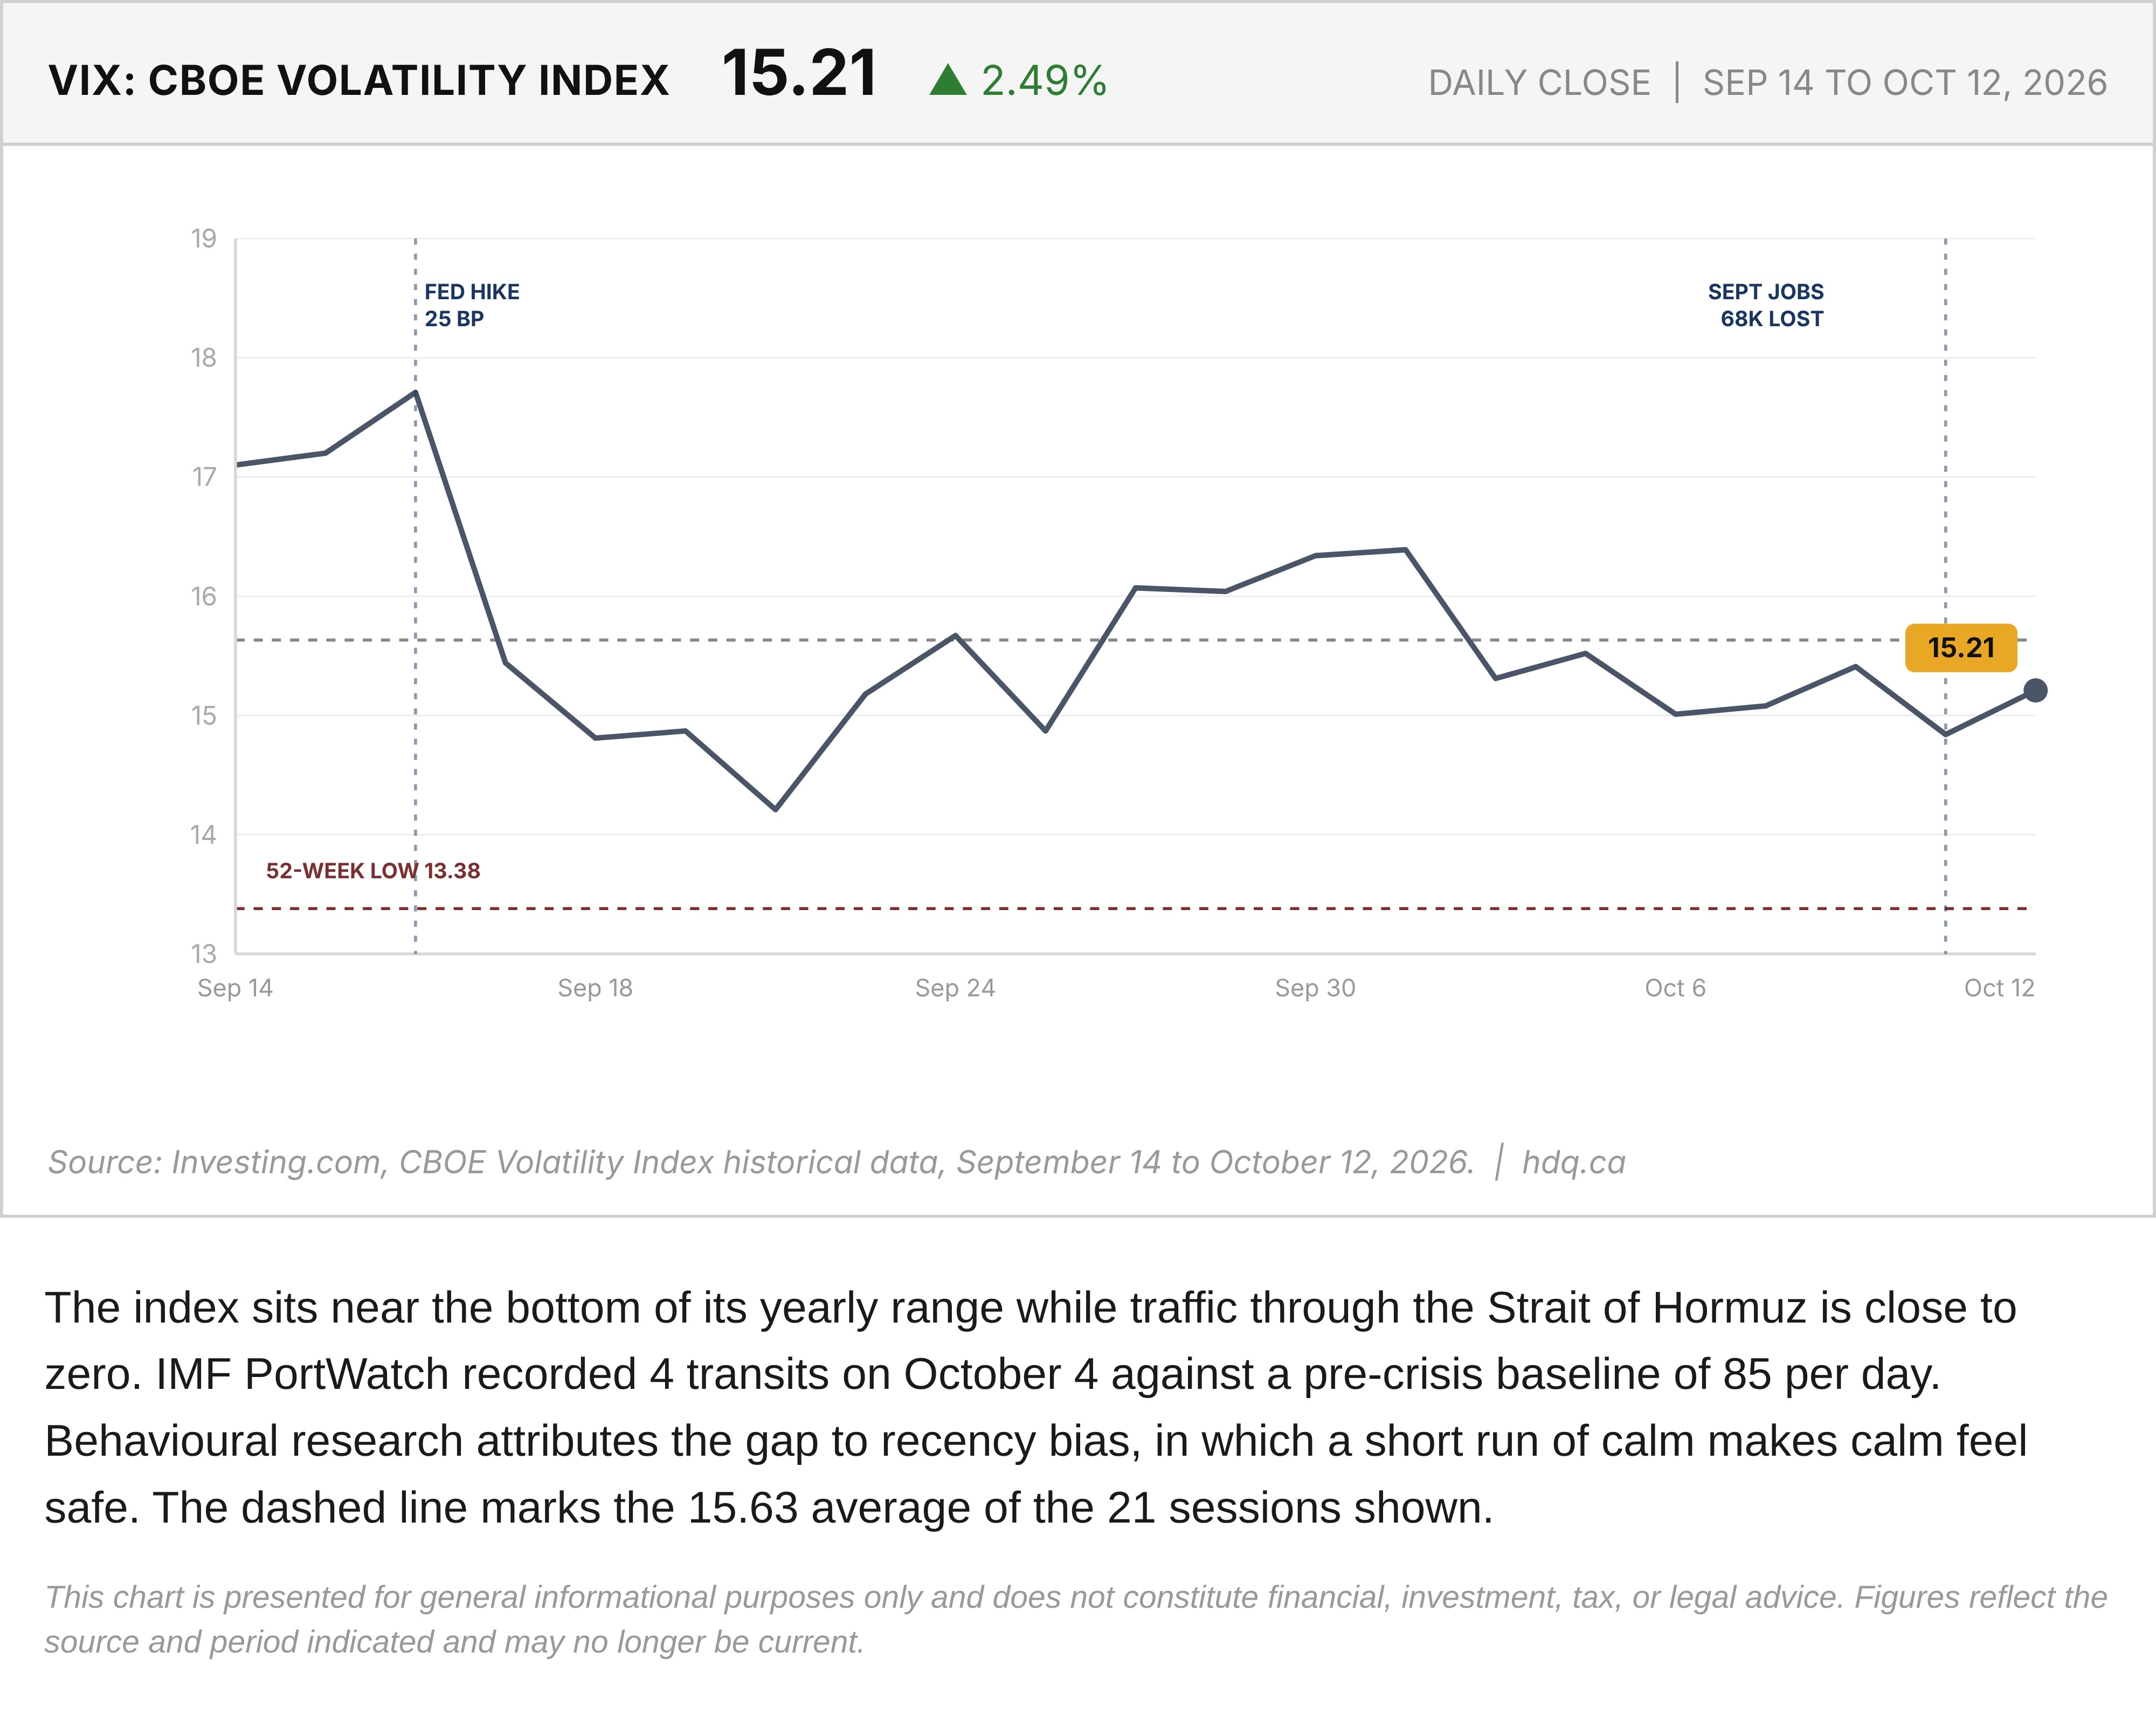
The index sits near the bottom of its yearly range while traffic through the Strait of Hormuz is close to zero. IMF PortWatch recorded 4 transits on October 4 against a pre-crisis baseline of 85 per day. Behavioural research attributes the gap to recency bias, in which a short run of calm makes calm feel safe. The dashed line marks the 15.63 average of the 21 sessions shown.
This chart is presented for general informational purposes only and does not constitute financial, investment, tax, or legal advice. Figures reflect the source and period indicated and may no longer be current.
Related charts
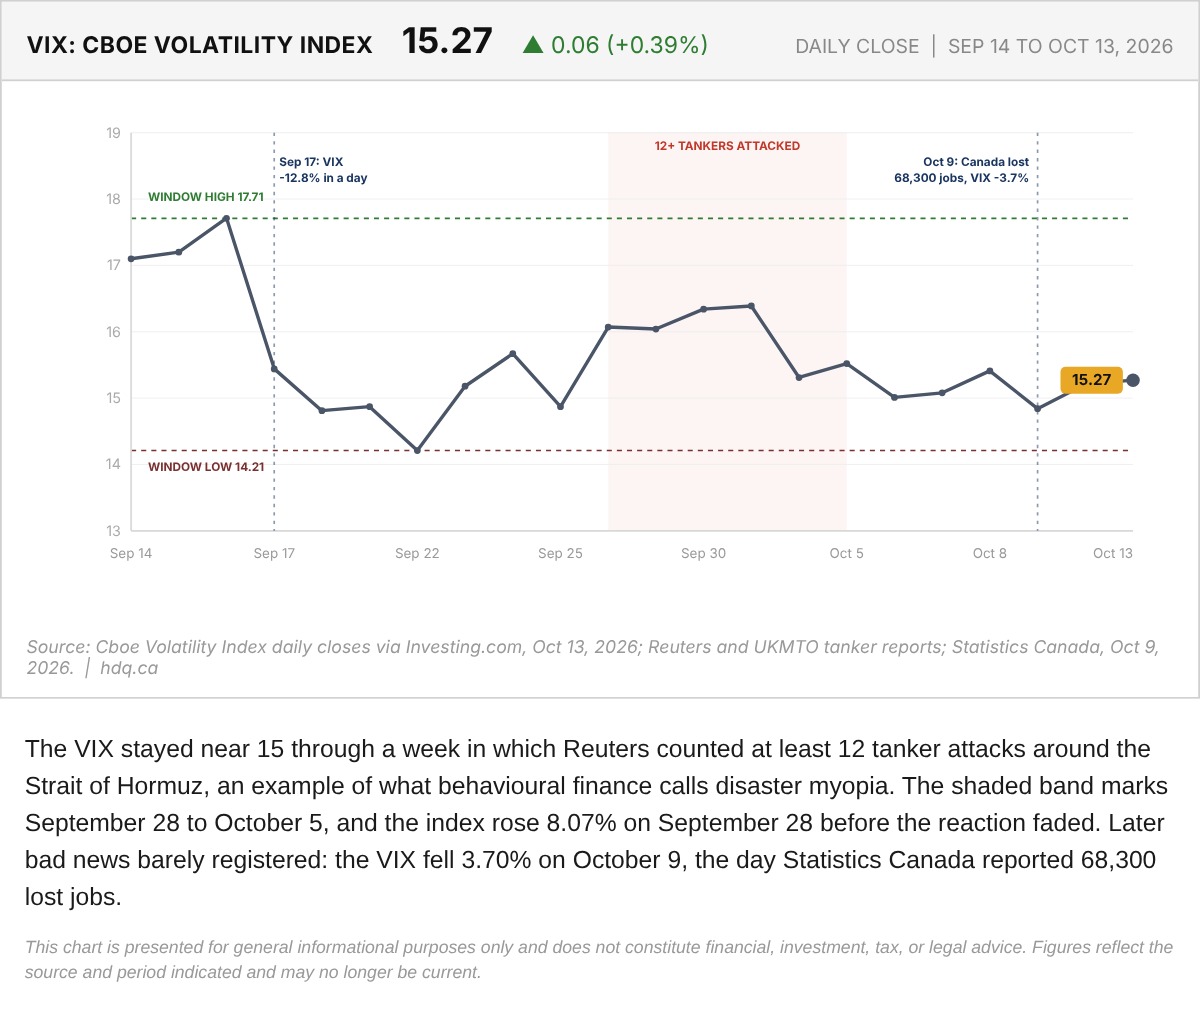
The VIX stayed near 15 through a week in which Reuters counted at least 12 tanker attacks around the Strait of Hormuz, an example of what behavioural finance calls disaster myopia.
VIX Volatility Index and the Hormuz Tanker Attack Window
October 13, 2026
View chart & download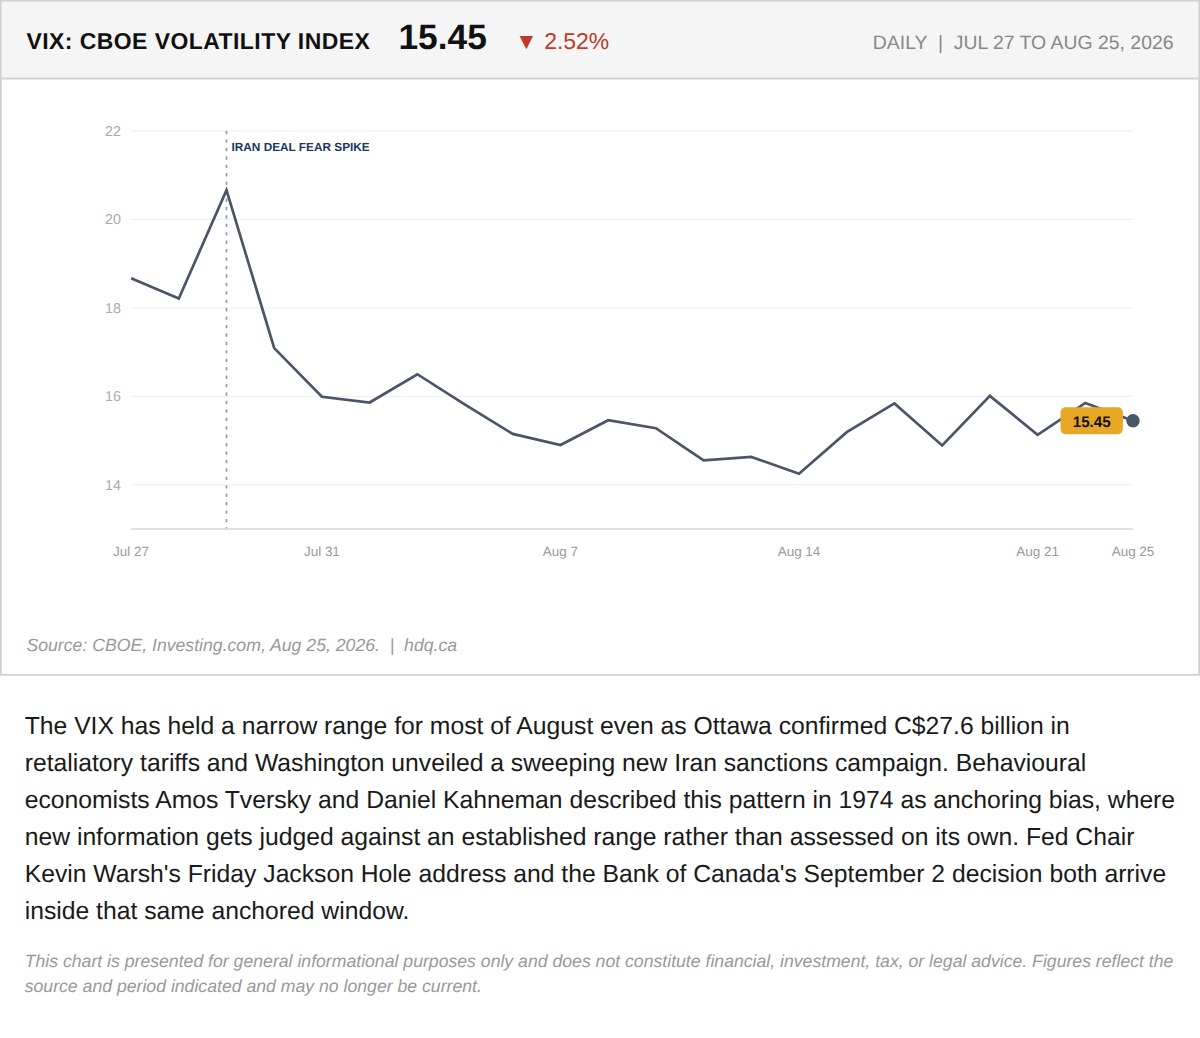
The VIX has held a narrow range for most of August even as Ottawa confirmed C$27.6 billion in retaliatory tariffs and Washington unveiled a sweeping new Iran sanctions campaign.
The VIX Has Not Moved in Three Weeks. That Is Not the Same as Markets Judging the Trade War Small.
August 26, 2026
View chart & download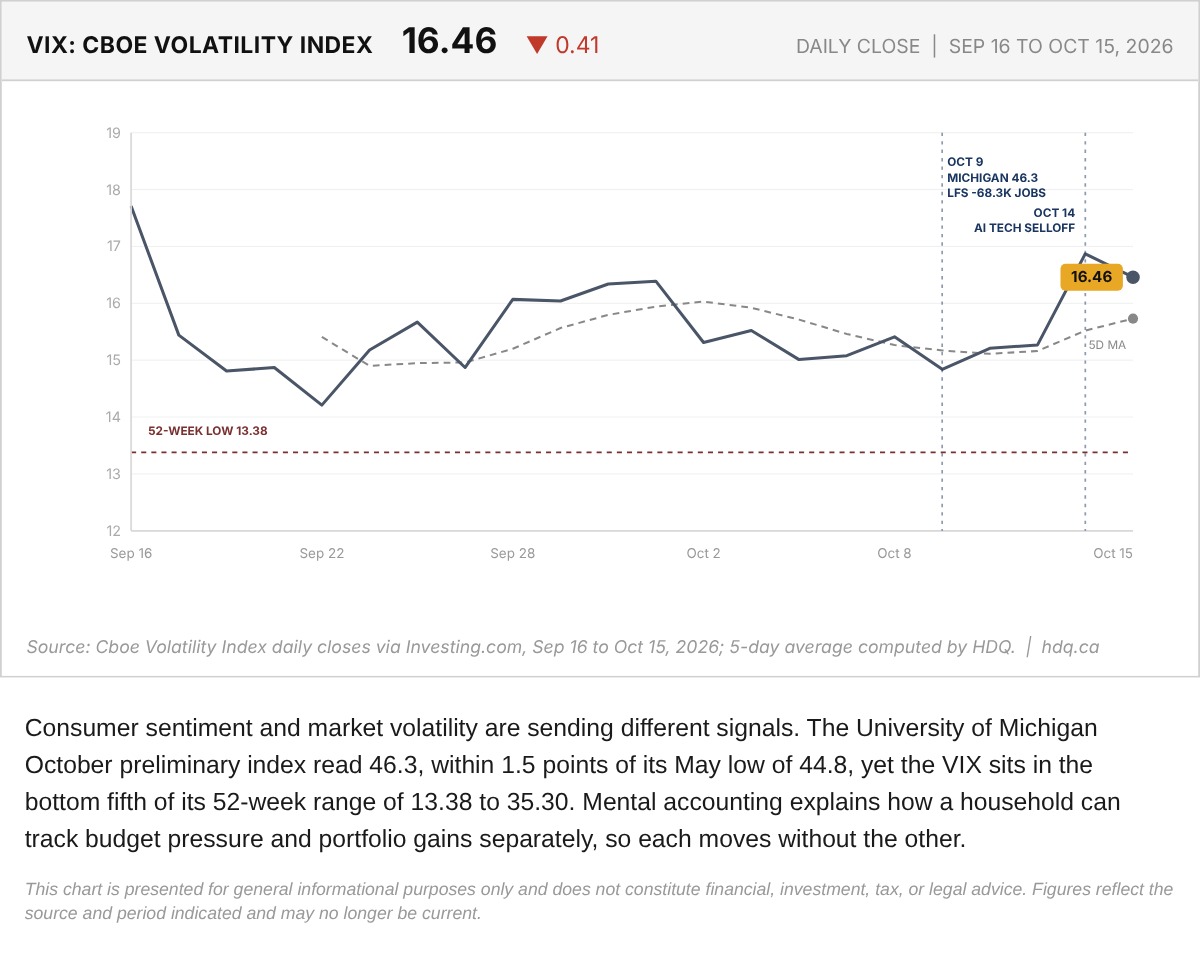
Consumer sentiment and market volatility are sending different signals.
VIX Volatility Index, September 16 to October 15, 2026
October 15, 2026
View chart & download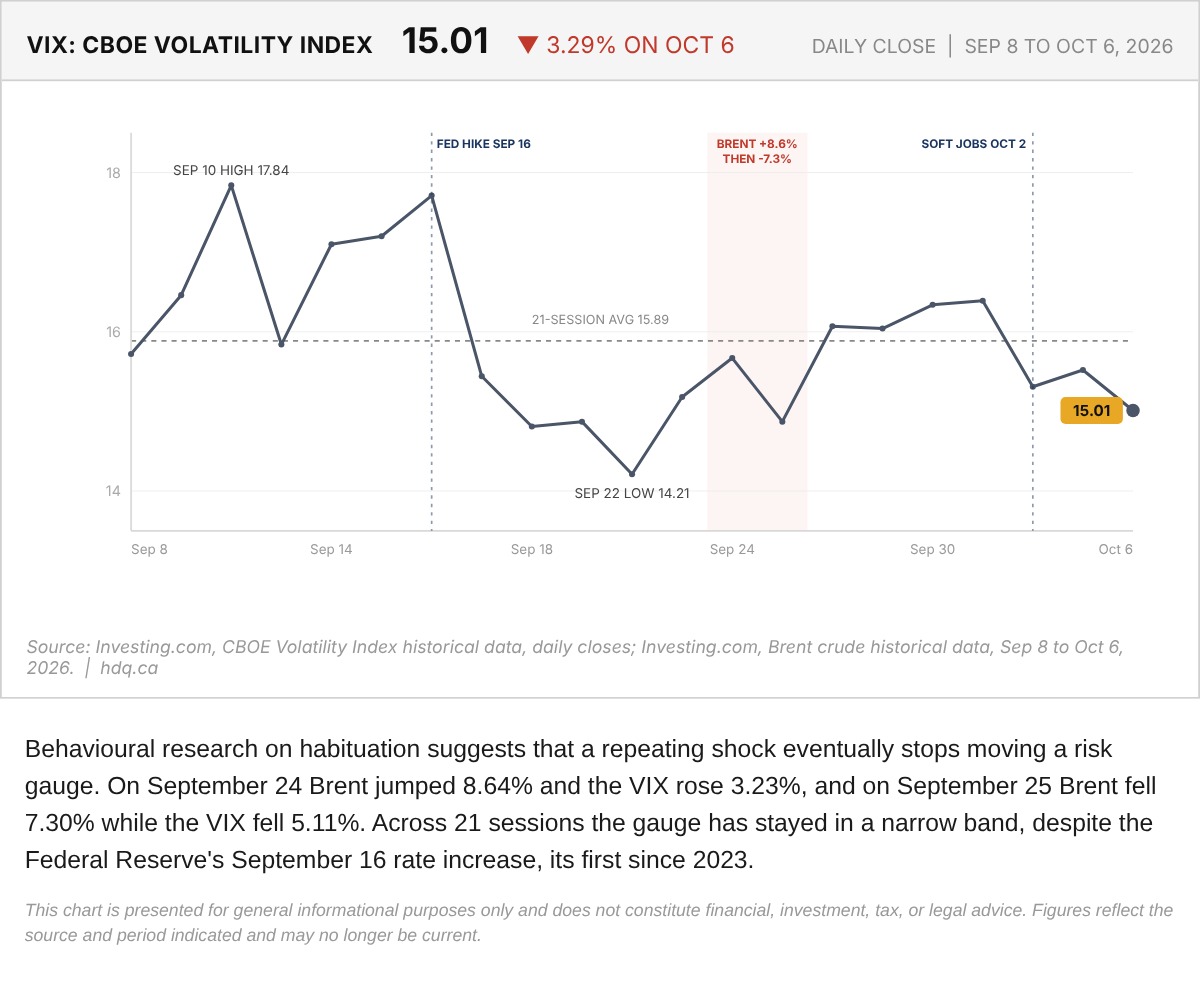
Behavioural research on habituation suggests that a repeating shock eventually stops moving a risk gauge.
VIX Daily Close and Habituation to Oil Shocks, September 8 to October 6
October 7, 2026
View chart & download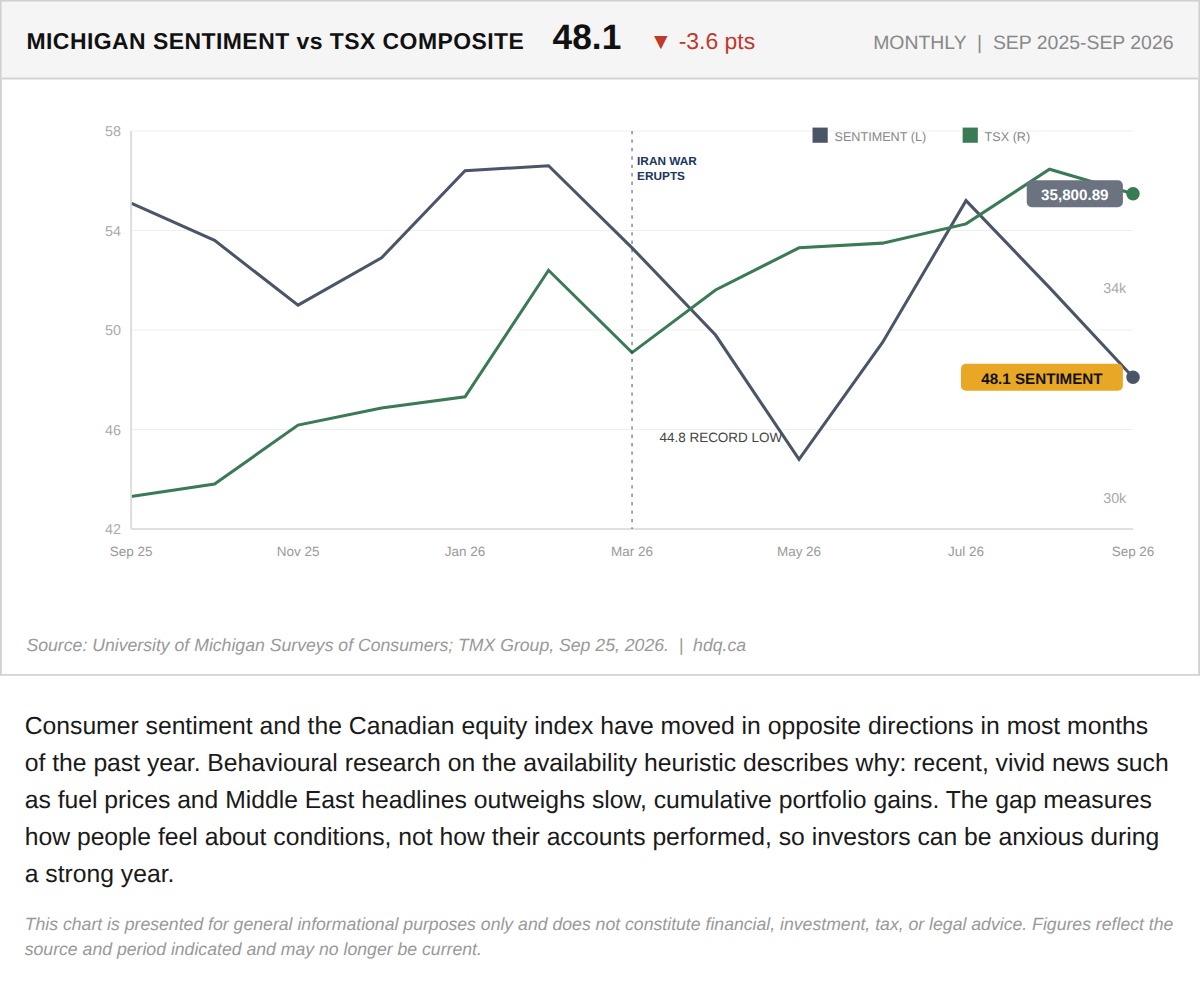
Consumer sentiment and the Canadian equity index have moved in opposite directions in most months of the past year.
Consumer Sentiment Falls While the TSX Rises
September 28, 2026
View chart & download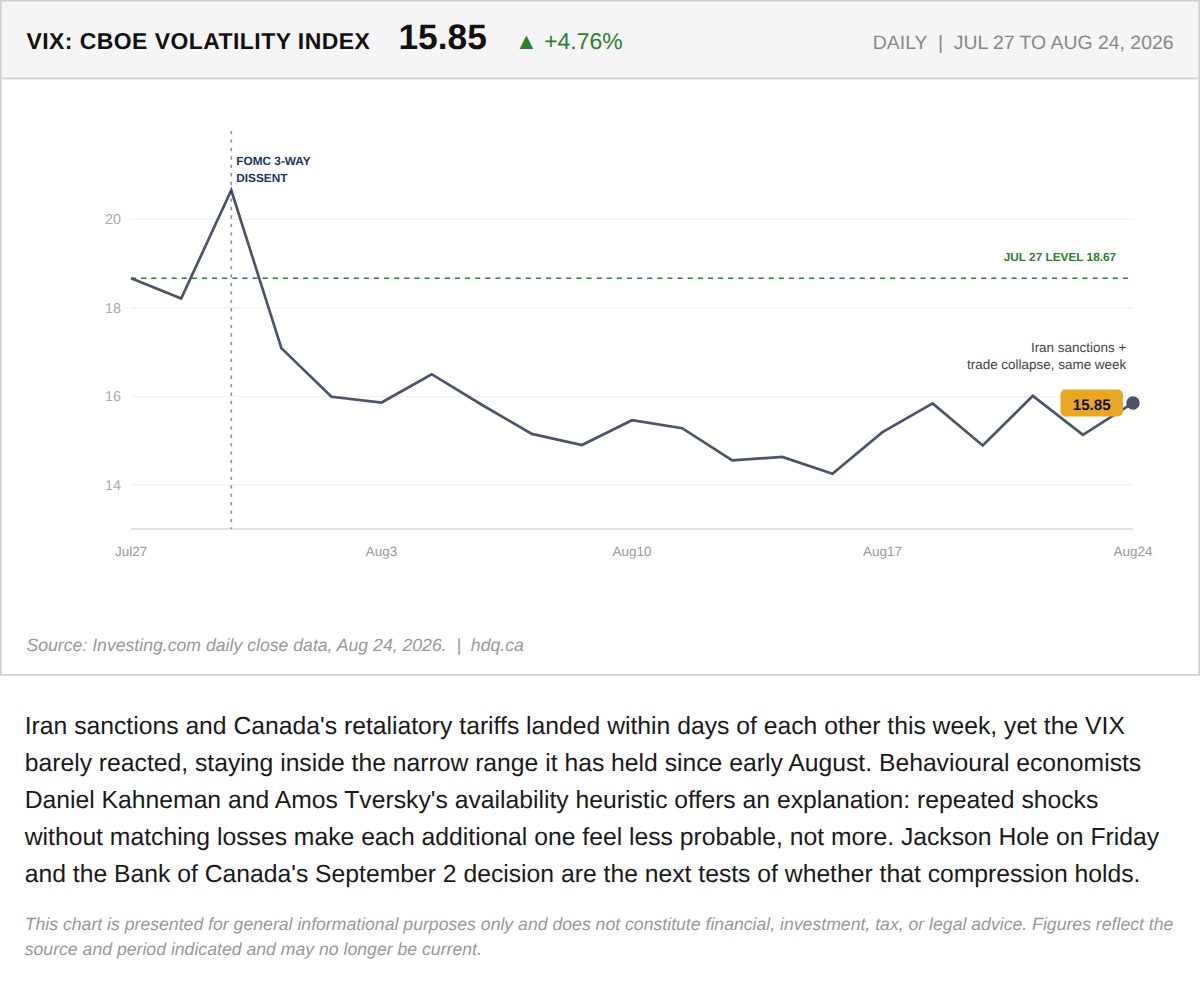
Iran sanctions and Canada's retaliatory tariffs landed within days of each other this week, yet the VIX barely reacted, staying inside the…
Two Shocks Landed the Same Week and the VIX Shrugged
August 25, 2026
View chart & download