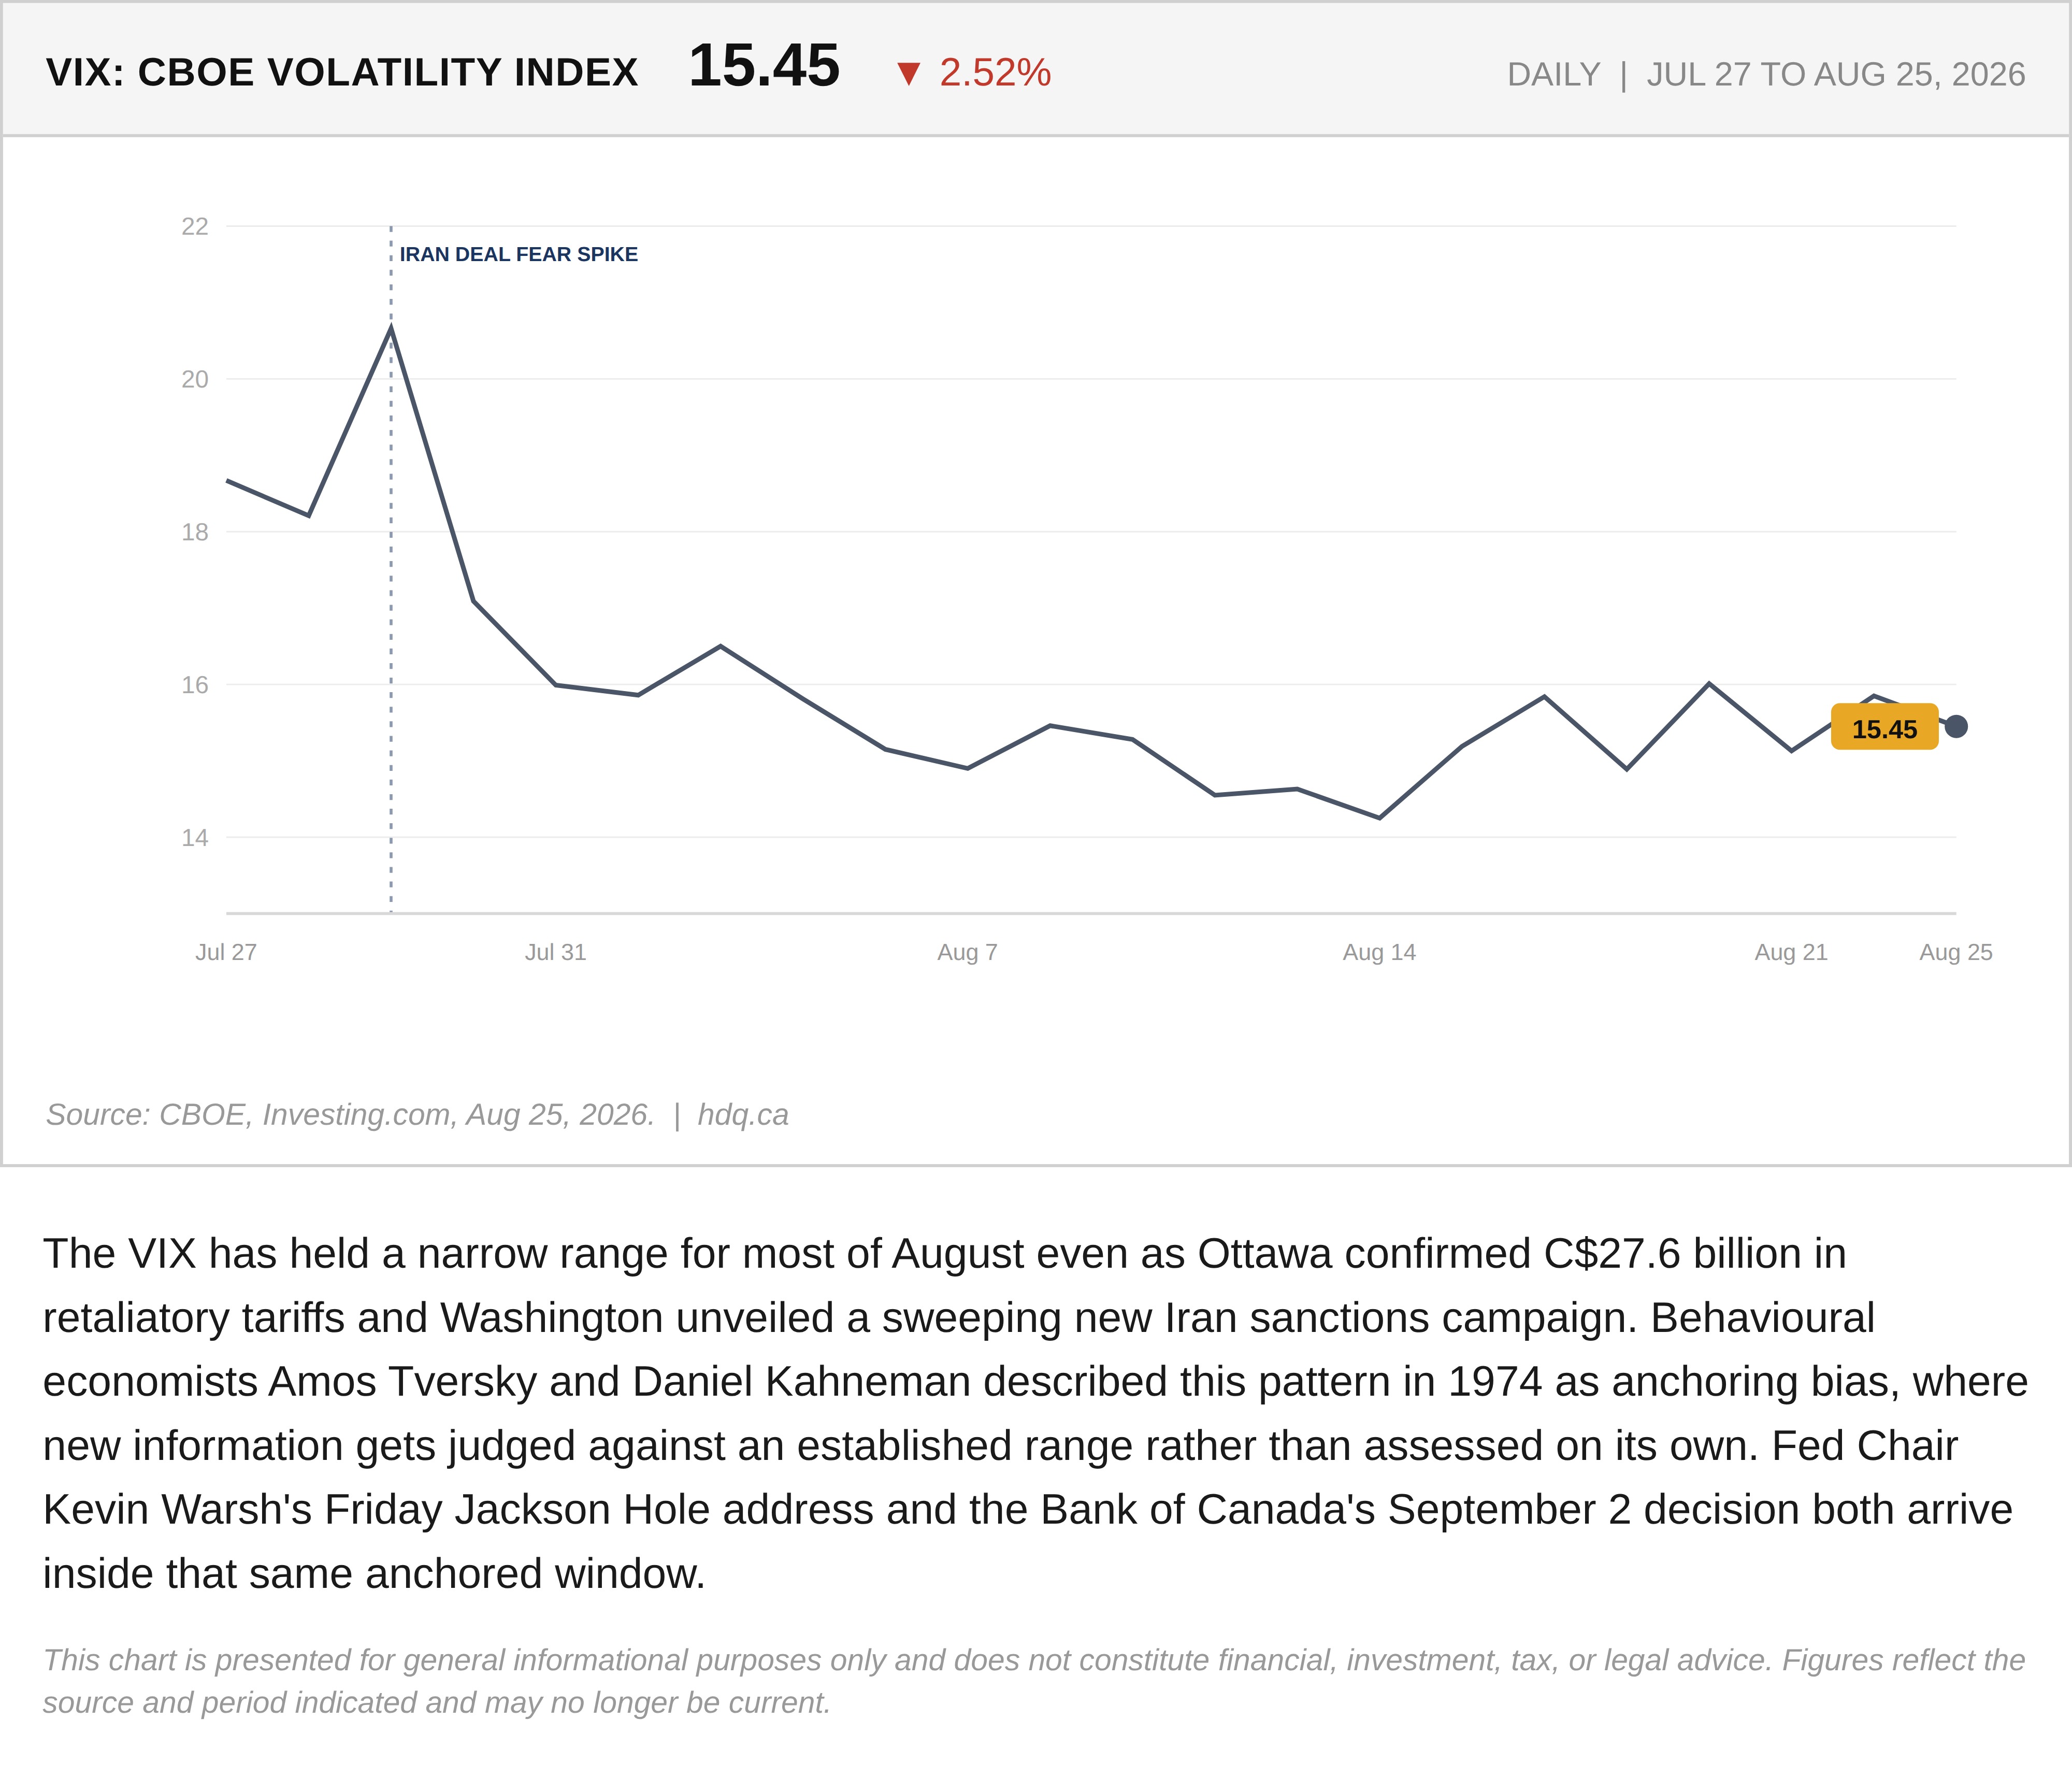
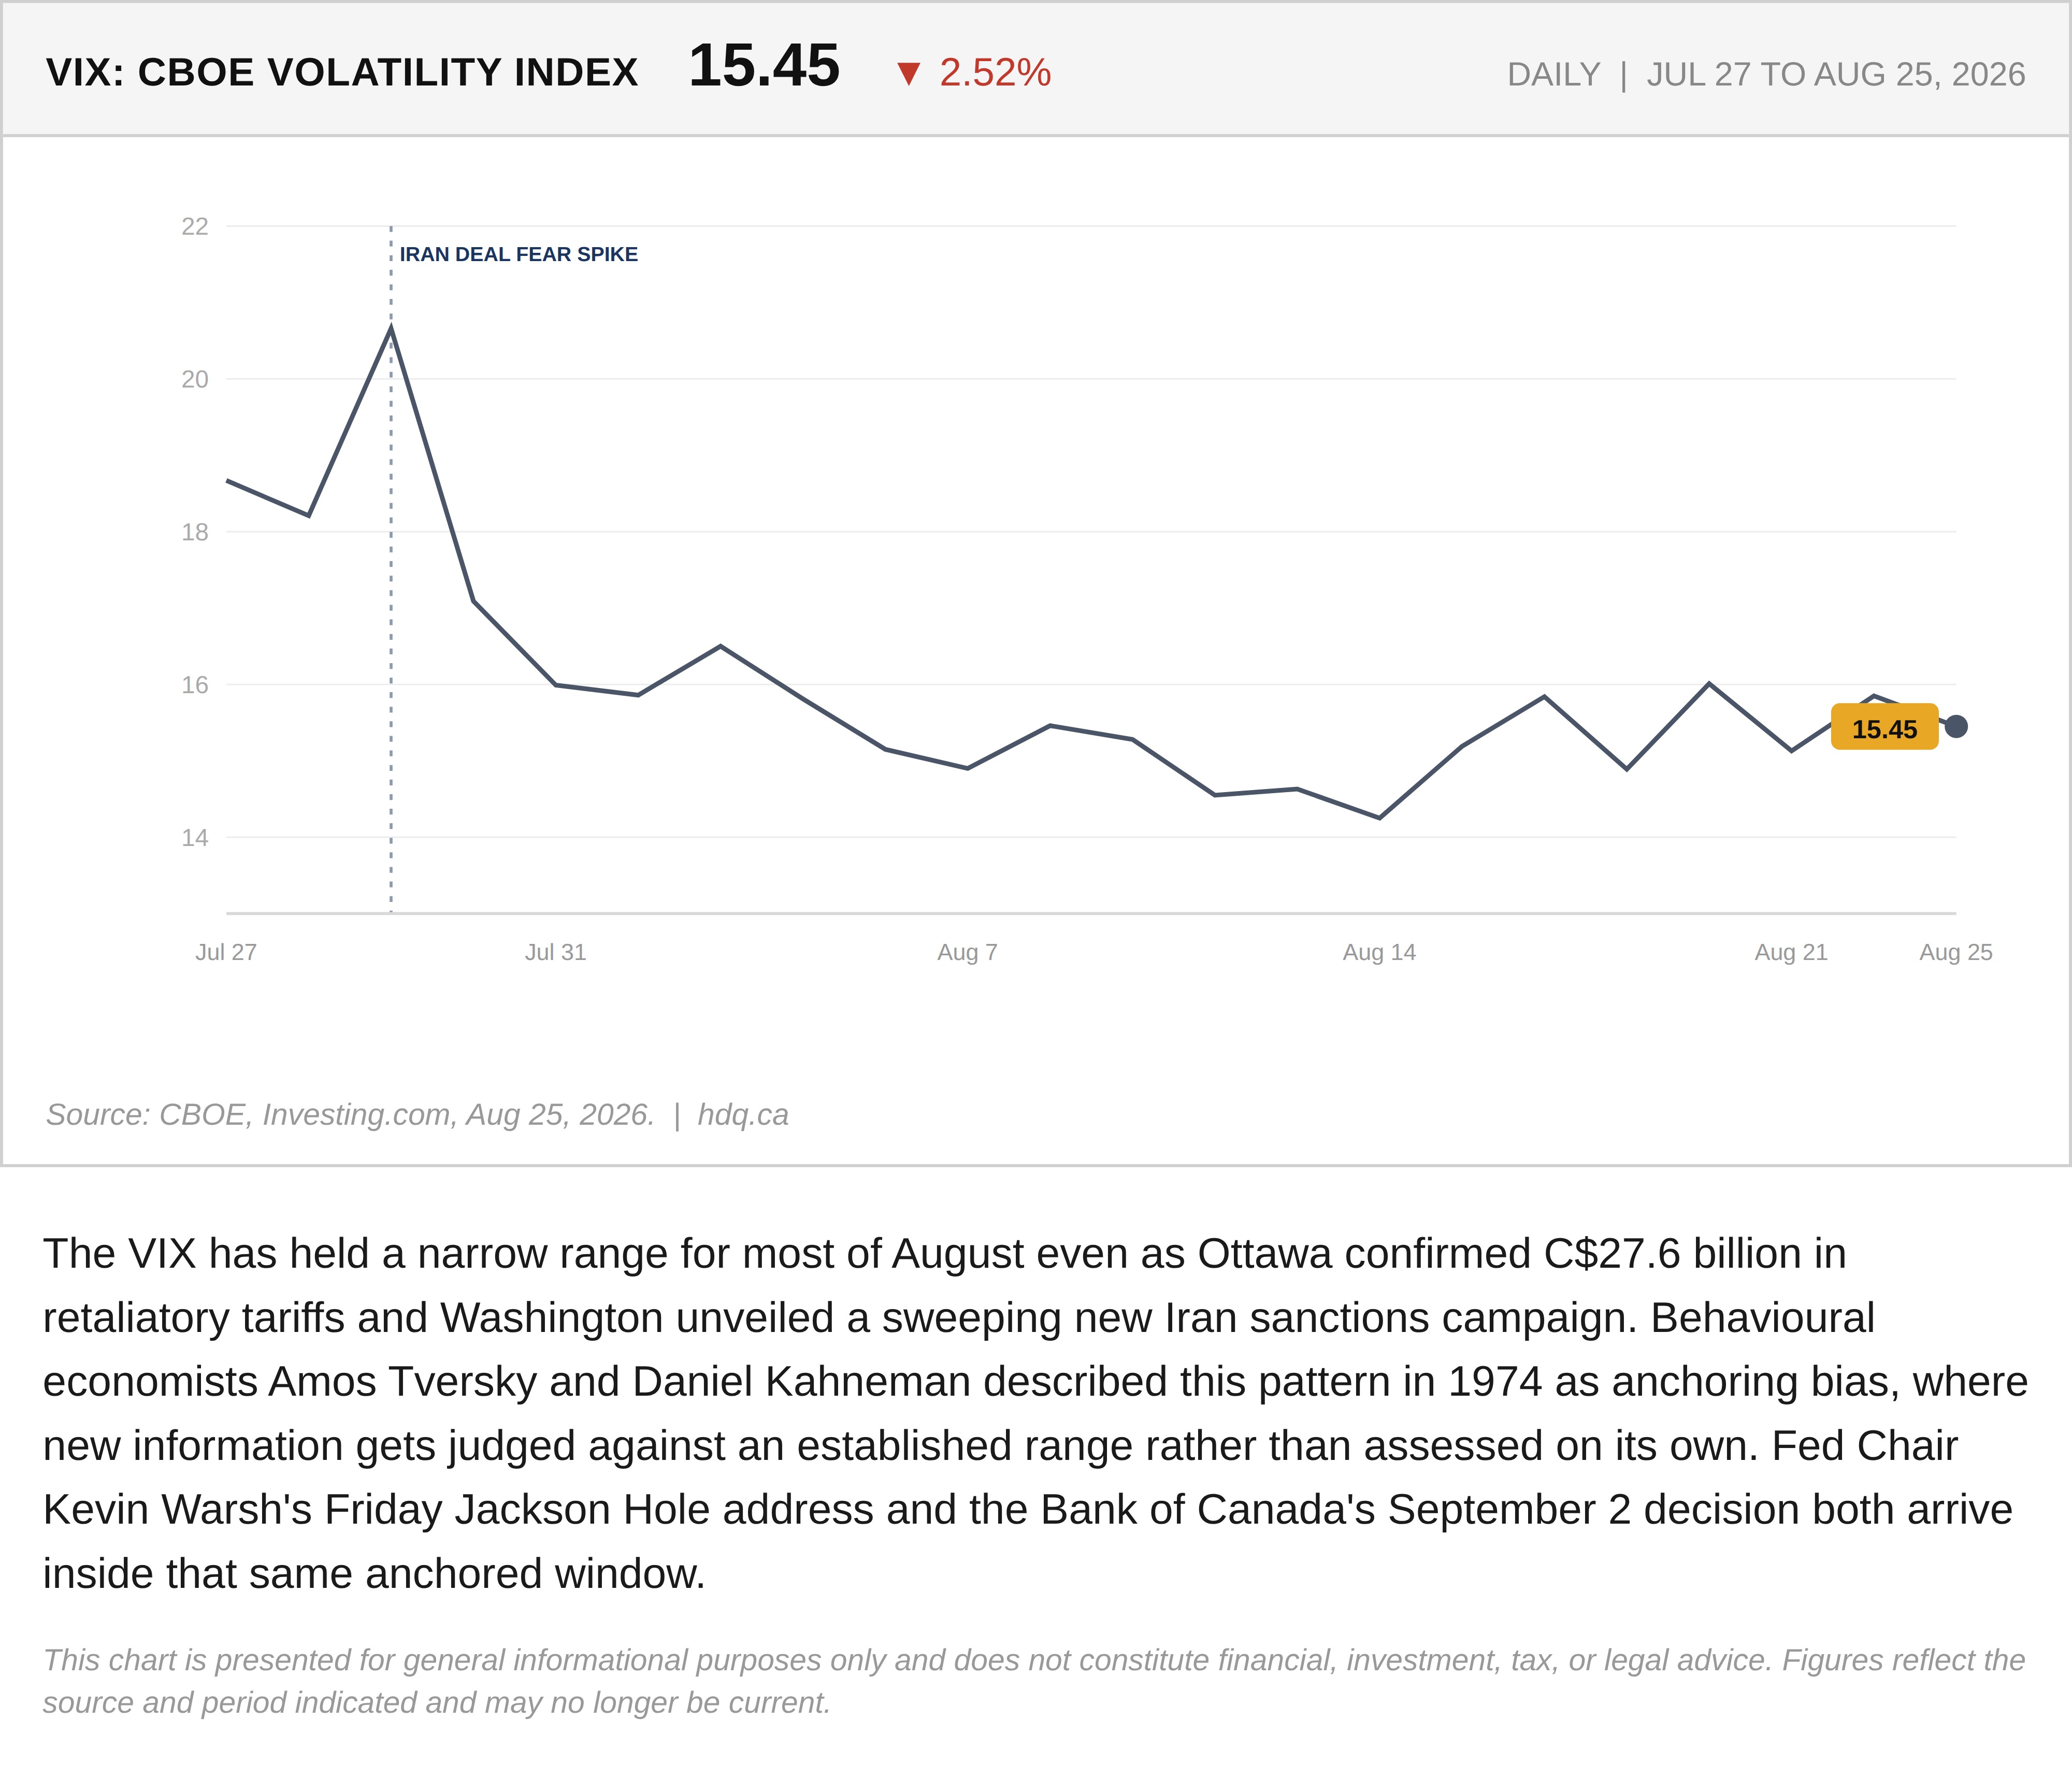
The VIX has held a narrow range for most of August even as Ottawa confirmed C$27.6 billion in retaliatory tariffs and Washington unveiled a sweeping new Iran sanctions campaign. Behavioural economists Amos Tversky and Daniel Kahneman described this pattern in 1974 as anchoring bias, where new information gets judged against an established range rather than assessed on its own. Fed Chair Kevin Warsh's Friday Jackson Hole address and the Bank of Canada's September 2 decision both arrive inside that same anchored window.
This chart is presented for general informational purposes only and does not constitute financial, investment, tax, or legal advice. Figures reflect the source and period indicated and may no longer be current.
Related charts
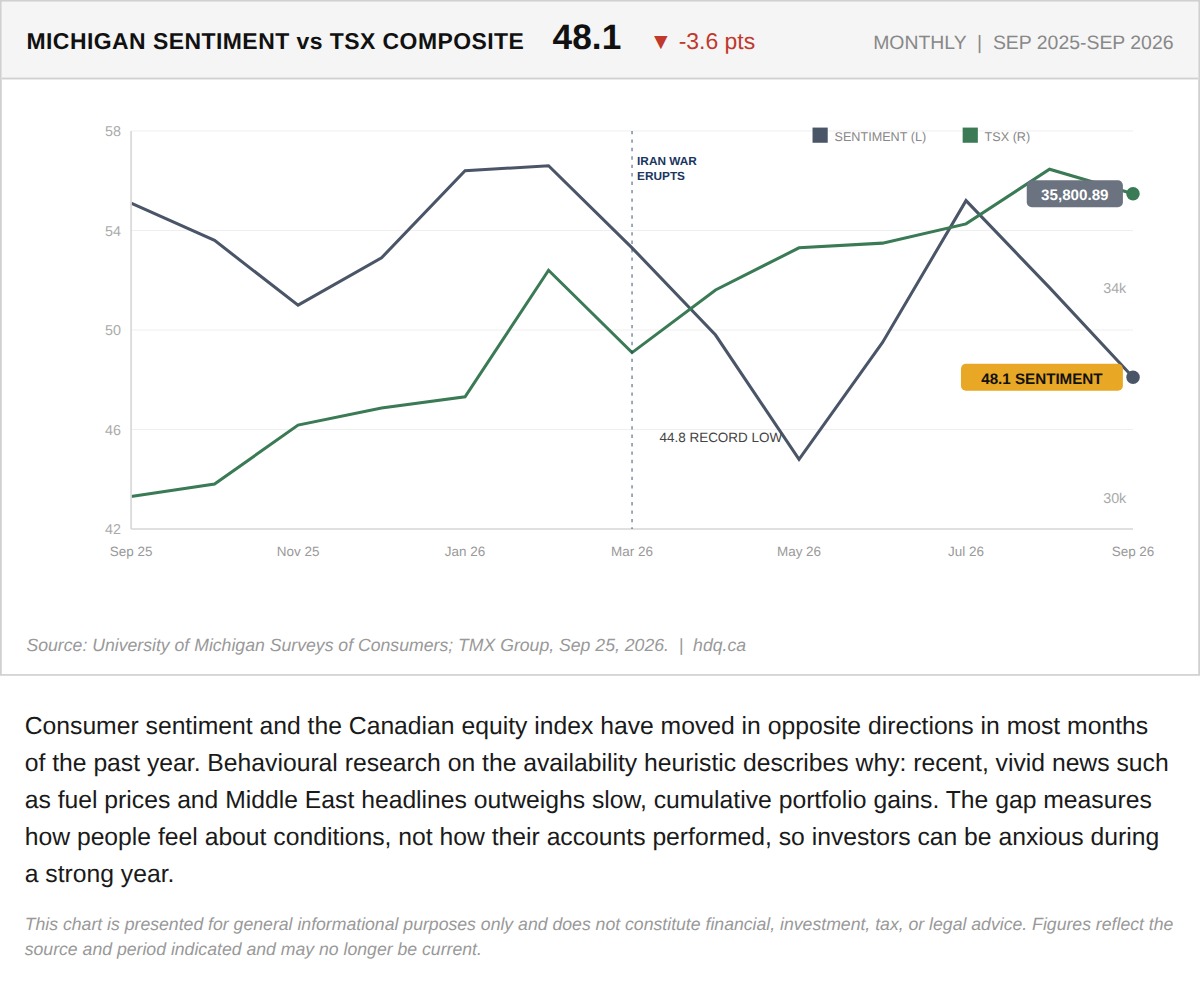
Consumer sentiment and the Canadian equity index have moved in opposite directions in most months of the past year.
Consumer Sentiment Falls While the TSX Rises
September 28, 2026
View chart & download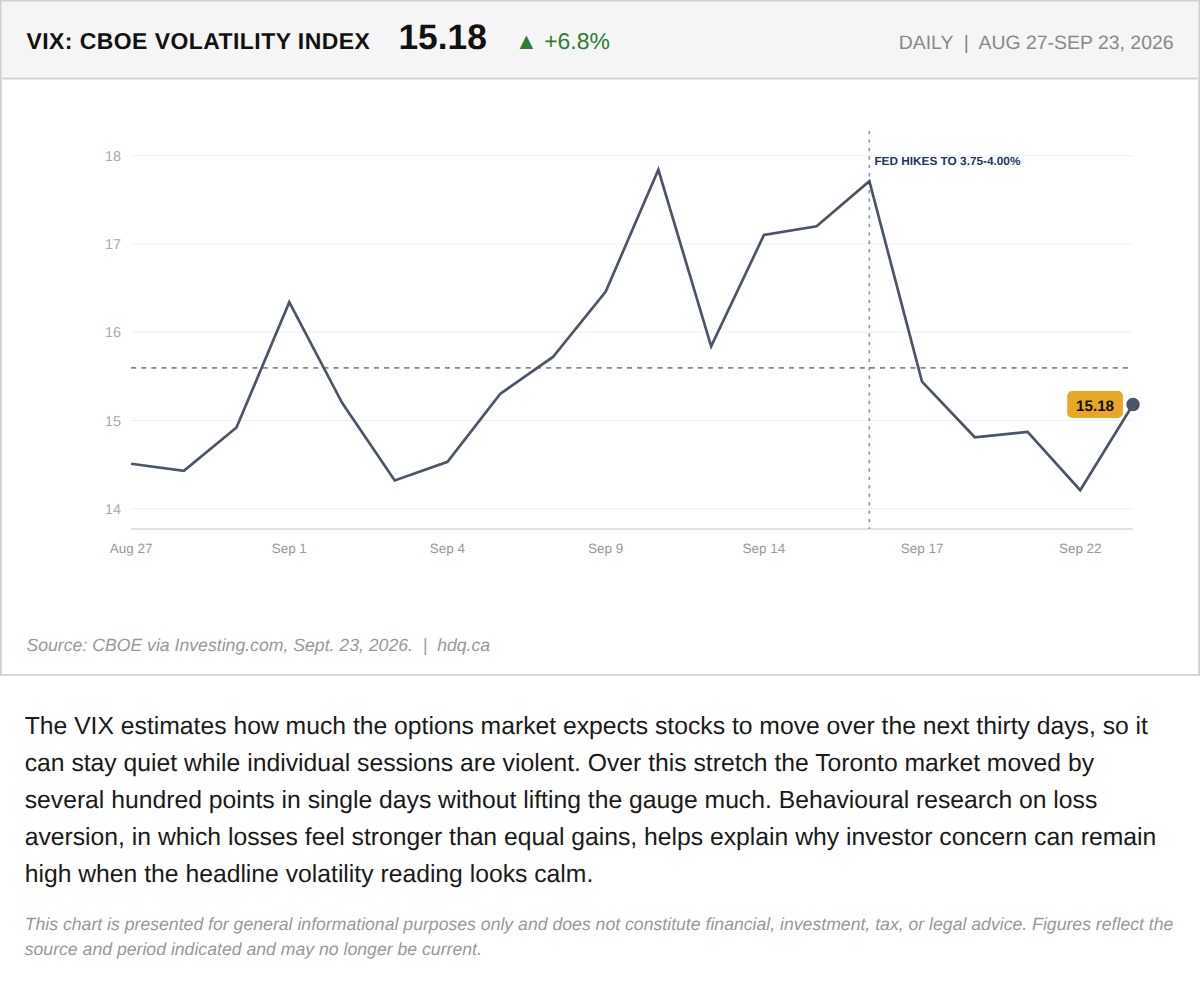
The VIX estimates how much the options market expects stocks to move over the next thirty days, so it can stay quiet while individual sessions are violent.
VIX Stays Subdued While the TSX Swings
September 24, 2026
View chart & download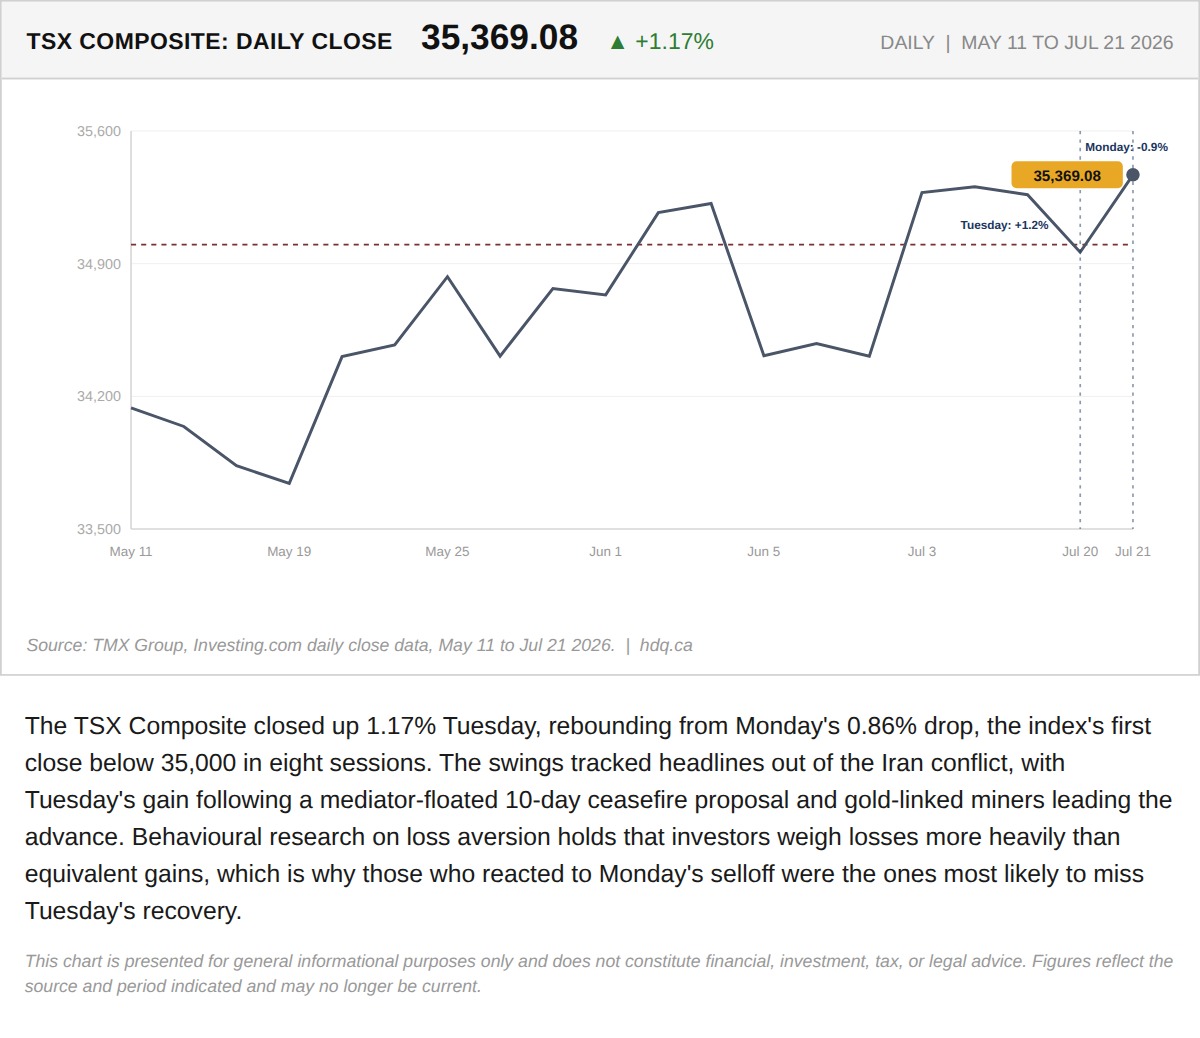
The TSX Composite closed up 1.17% Tuesday, rebounding from Monday's 0.86% drop, the index's first close below 35,000 in eight sessions.
The Monday Sell, the Tuesday Miss
July 22, 2026
View chart & download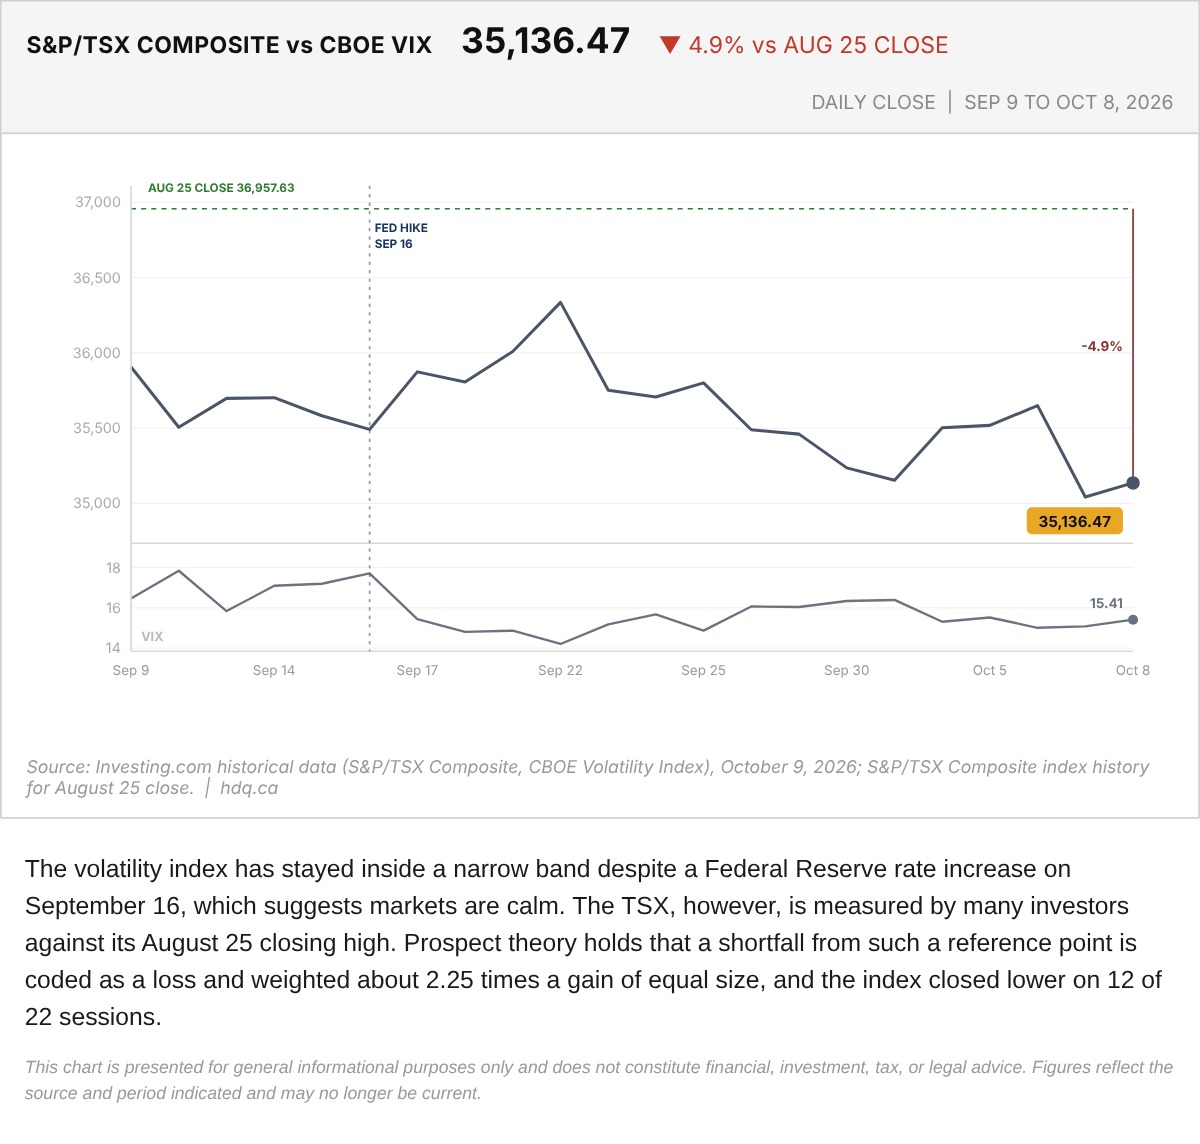
The volatility index has stayed inside a narrow band despite a Federal Reserve rate increase on September 16, which suggests markets are calm.
S&P/TSX Composite Against the Cboe VIX, September 9 to October 8
October 9, 2026
View chart & download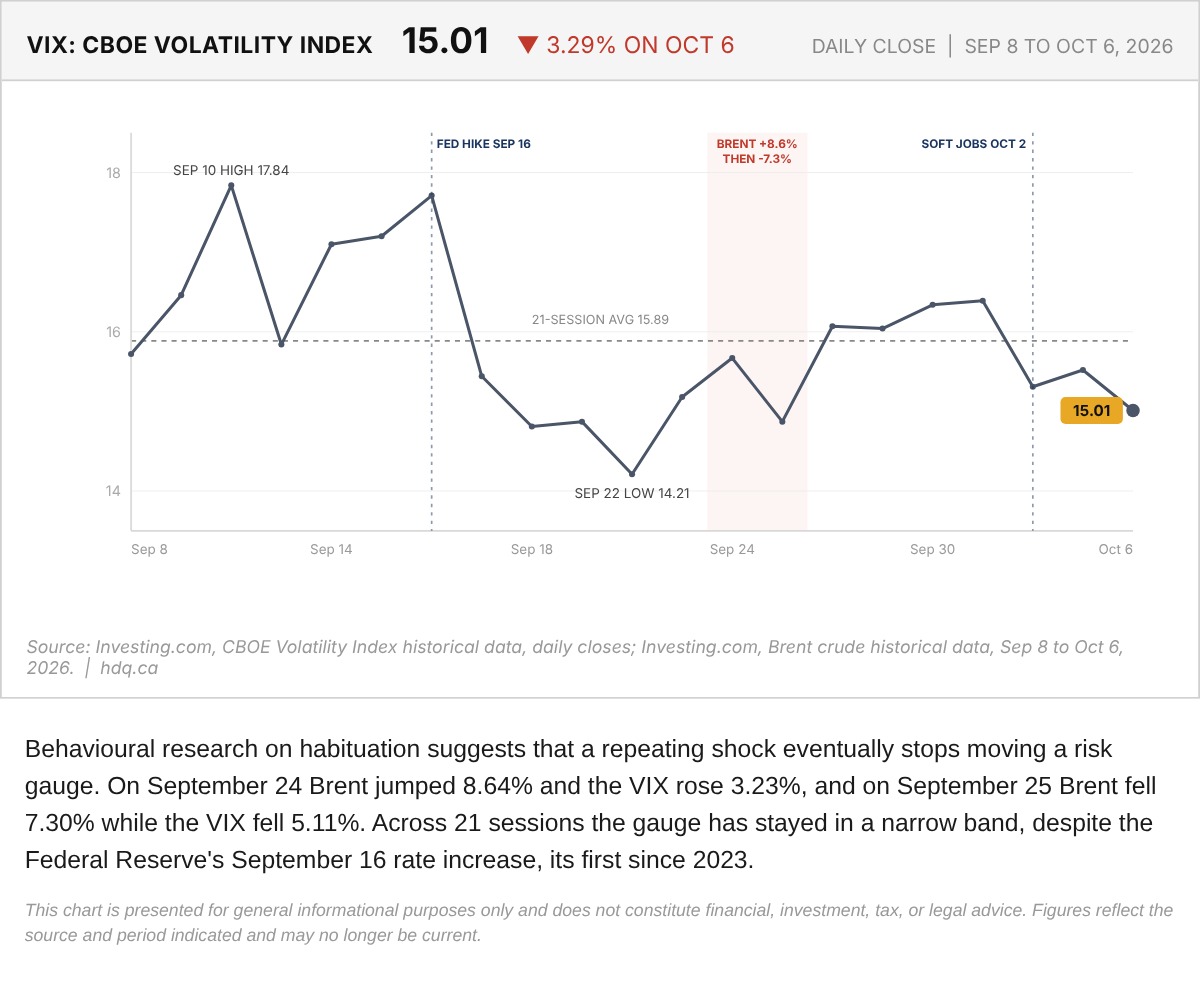
Behavioural research on habituation suggests that a repeating shock eventually stops moving a risk gauge.
VIX Daily Close and Habituation to Oil Shocks, September 8 to October 6
October 7, 2026
View chart & download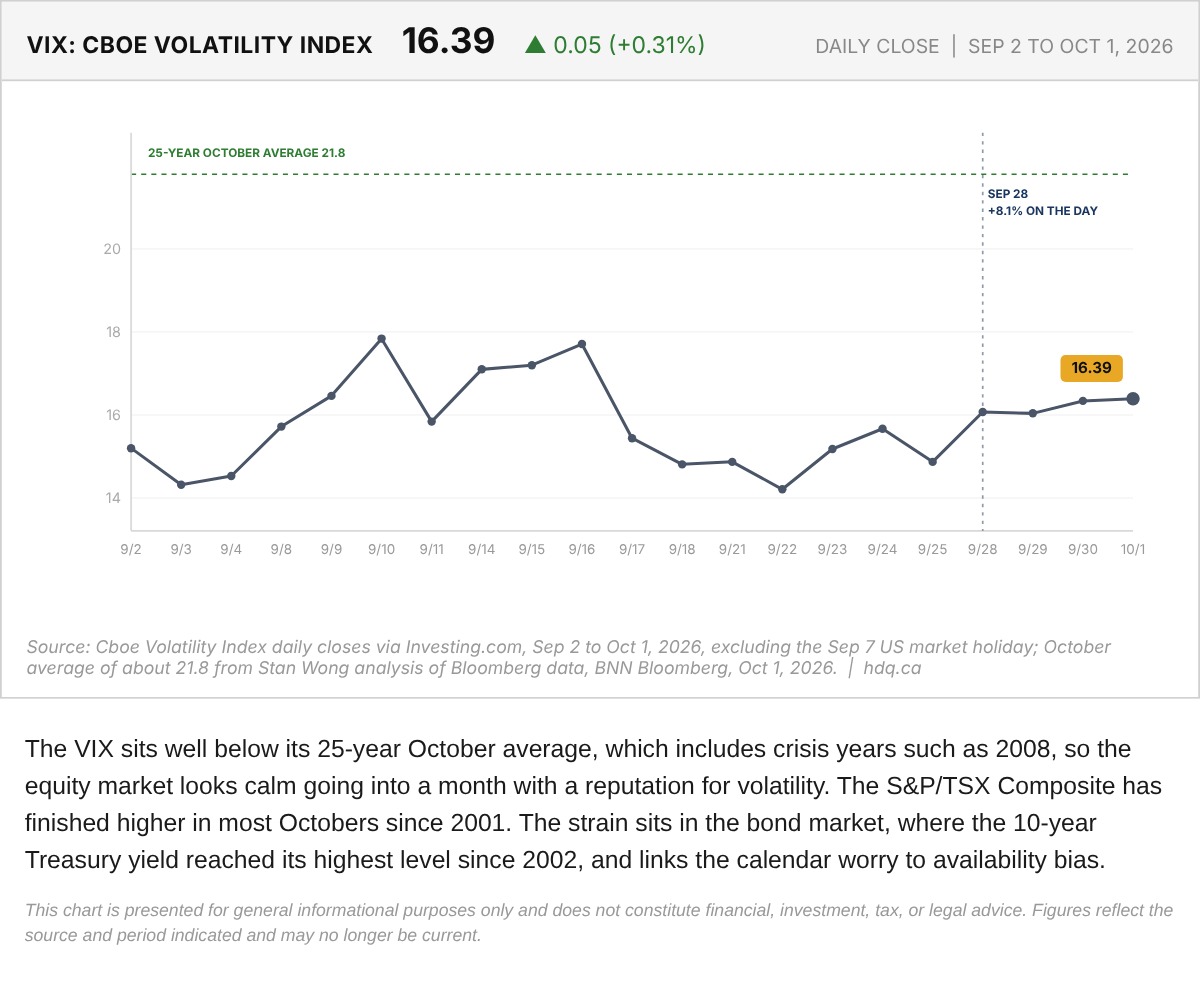
The VIX sits well below its 25-year October average, which includes crisis years such as 2008, so the equity market looks calm going into a month with a reputation for volatility.
Cboe Volatility Index (VIX) and the October Average, September 2 to October 1, 2026
October 2, 2026
View chart & download