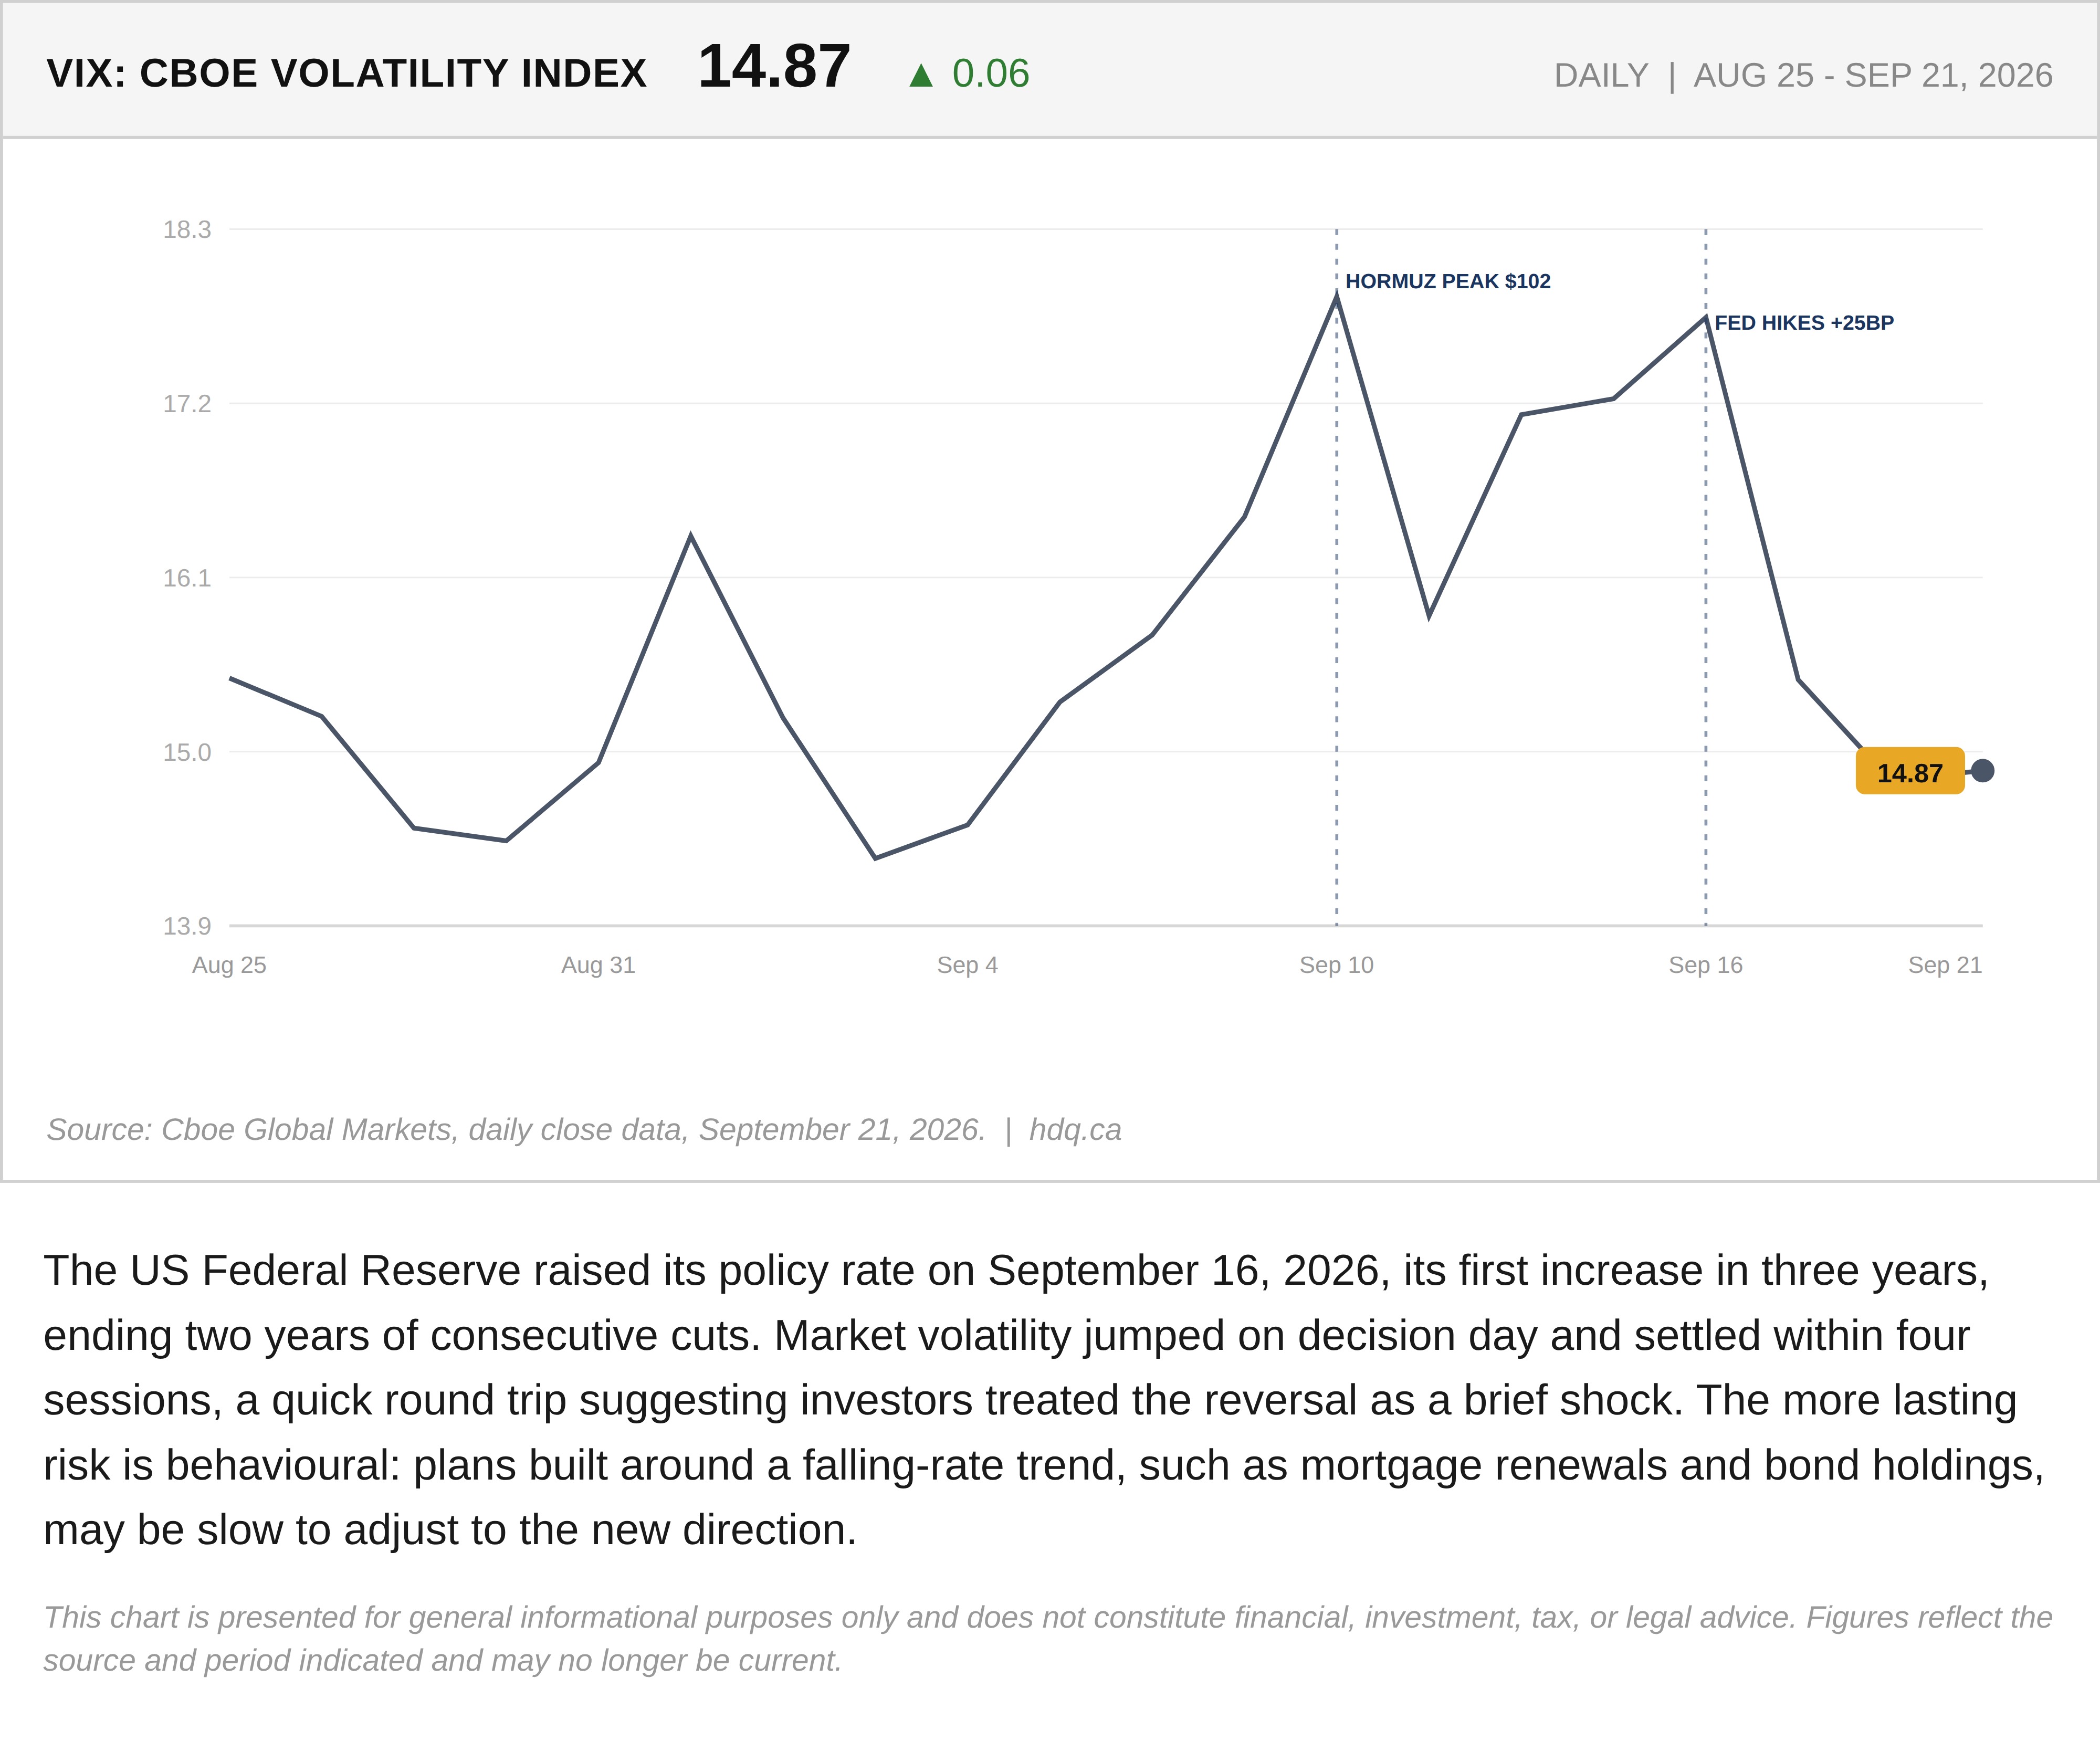
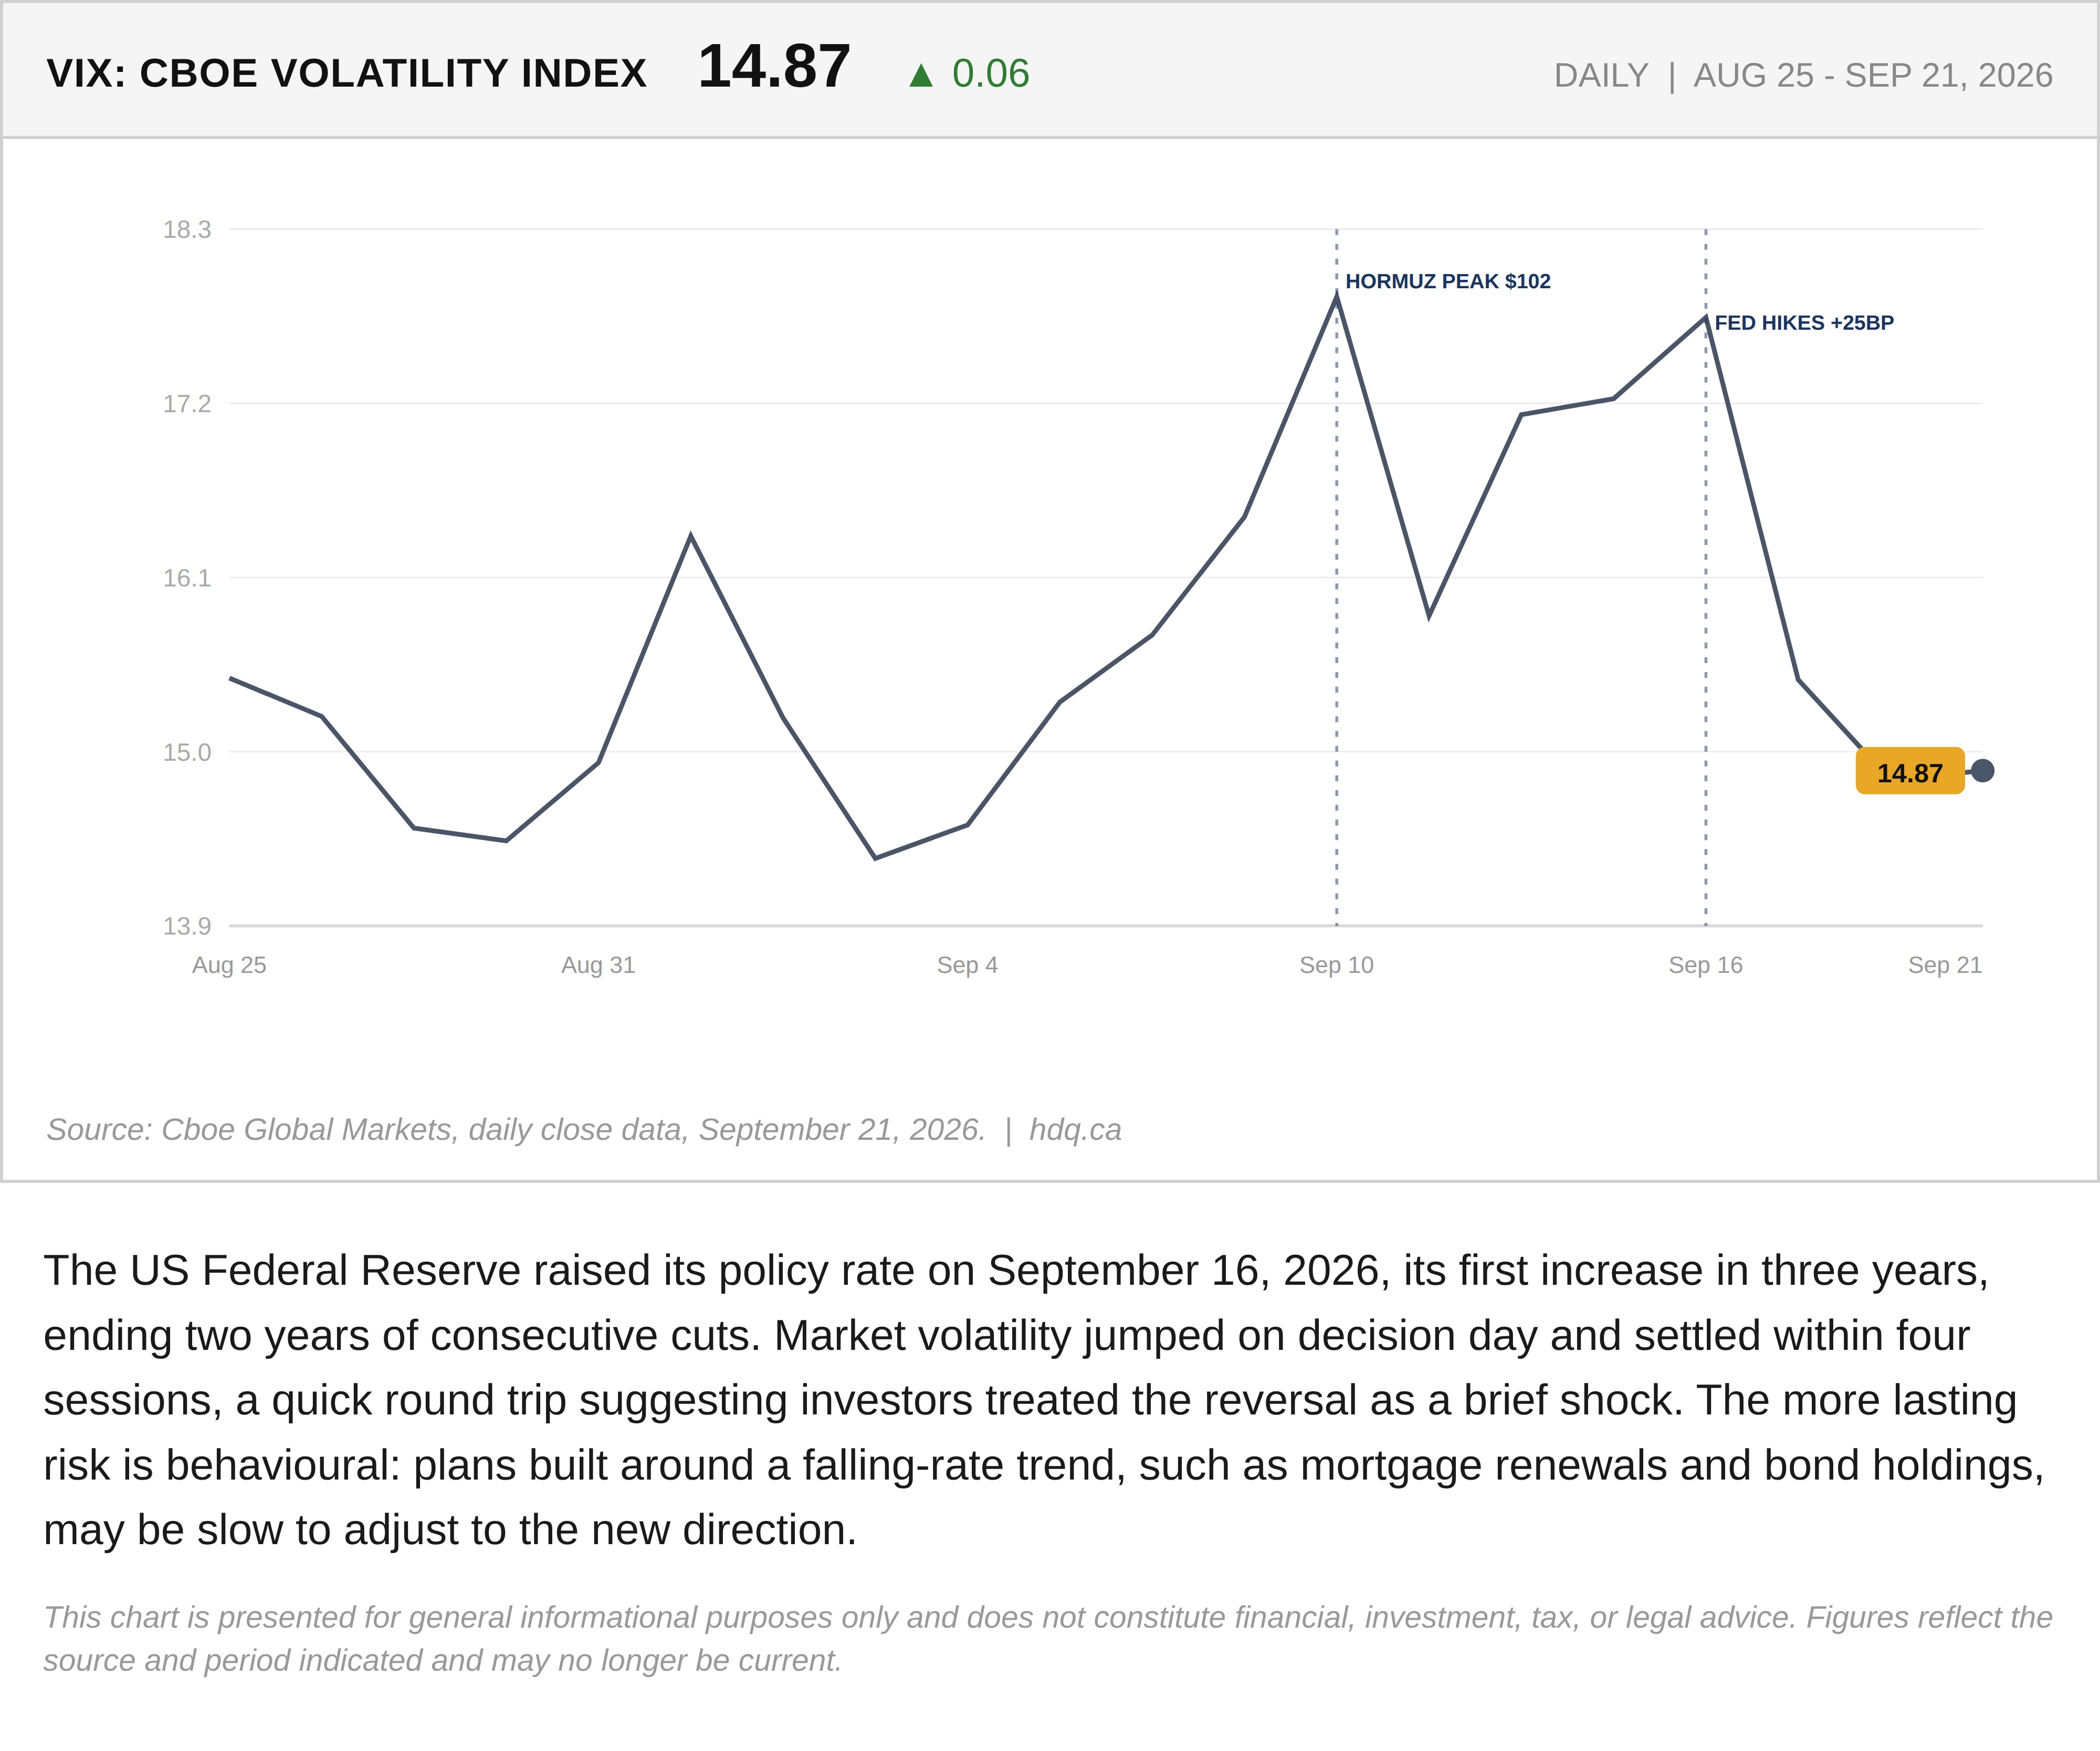
The US Federal Reserve raised its policy rate on September 16, 2026, its first increase in three years, ending two years of consecutive cuts. Market volatility jumped on decision day and settled within four sessions, a quick round trip suggesting investors treated the reversal as a brief shock. The more lasting risk is behavioural: plans built around a falling-rate trend, such as mortgage renewals and bond holdings, may be slow to adjust to the new direction.
This chart is presented for general informational purposes only and does not constitute financial, investment, tax, or legal advice. Figures reflect the source and period indicated and may no longer be current.
Related charts
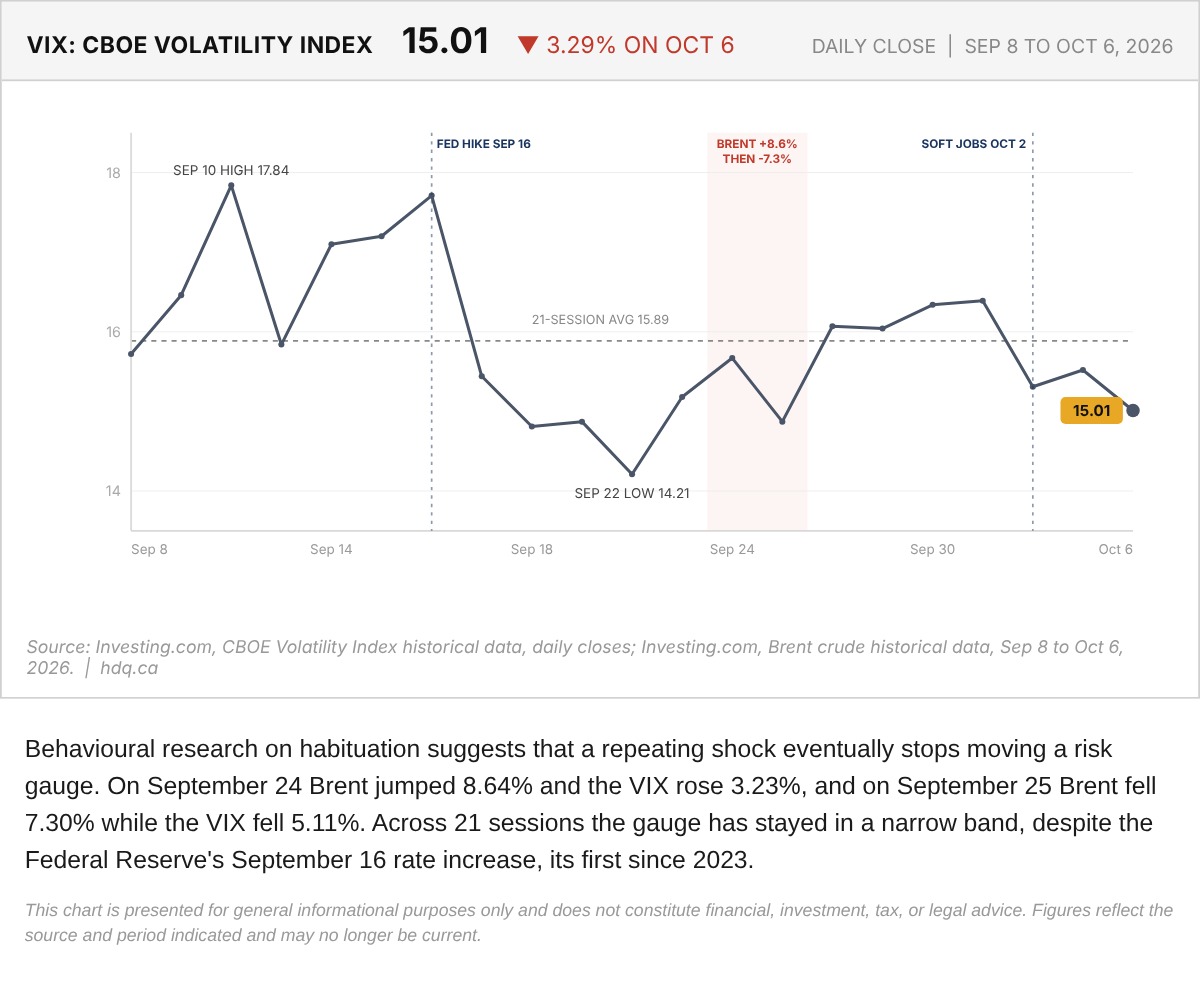
Behavioural research on habituation suggests that a repeating shock eventually stops moving a risk gauge.
VIX Daily Close and Habituation to Oil Shocks, September 8 to October 6
October 7, 2026
View chart & download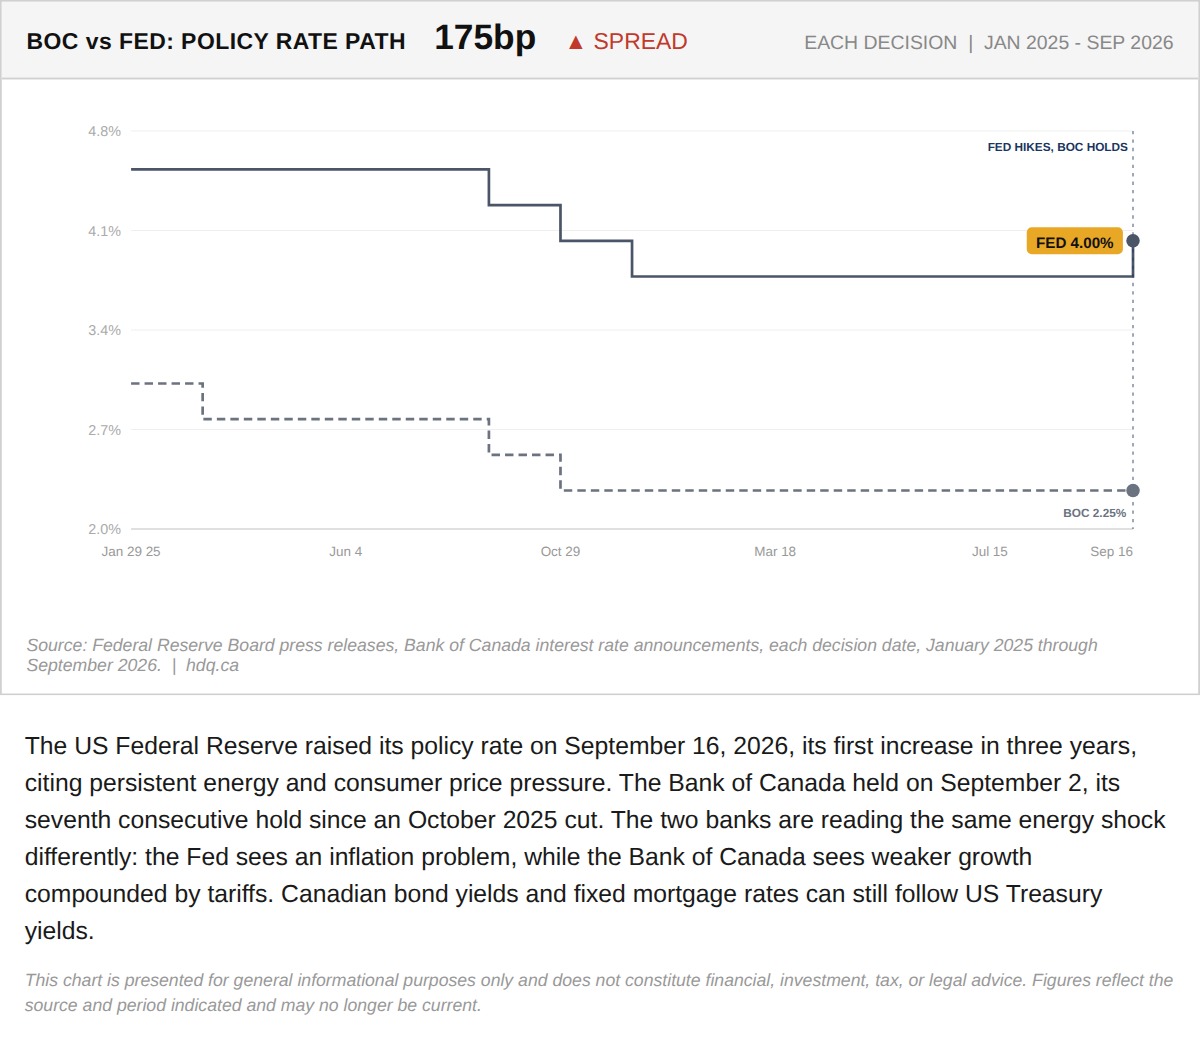
The US Federal Reserve raised its policy rate on September 16, 2026, its first increase in three years, citing persistent energy and consumer price pressure.
Why the Fed Just Broke Rank With the Bank of Canada
September 22, 2026
View chart & download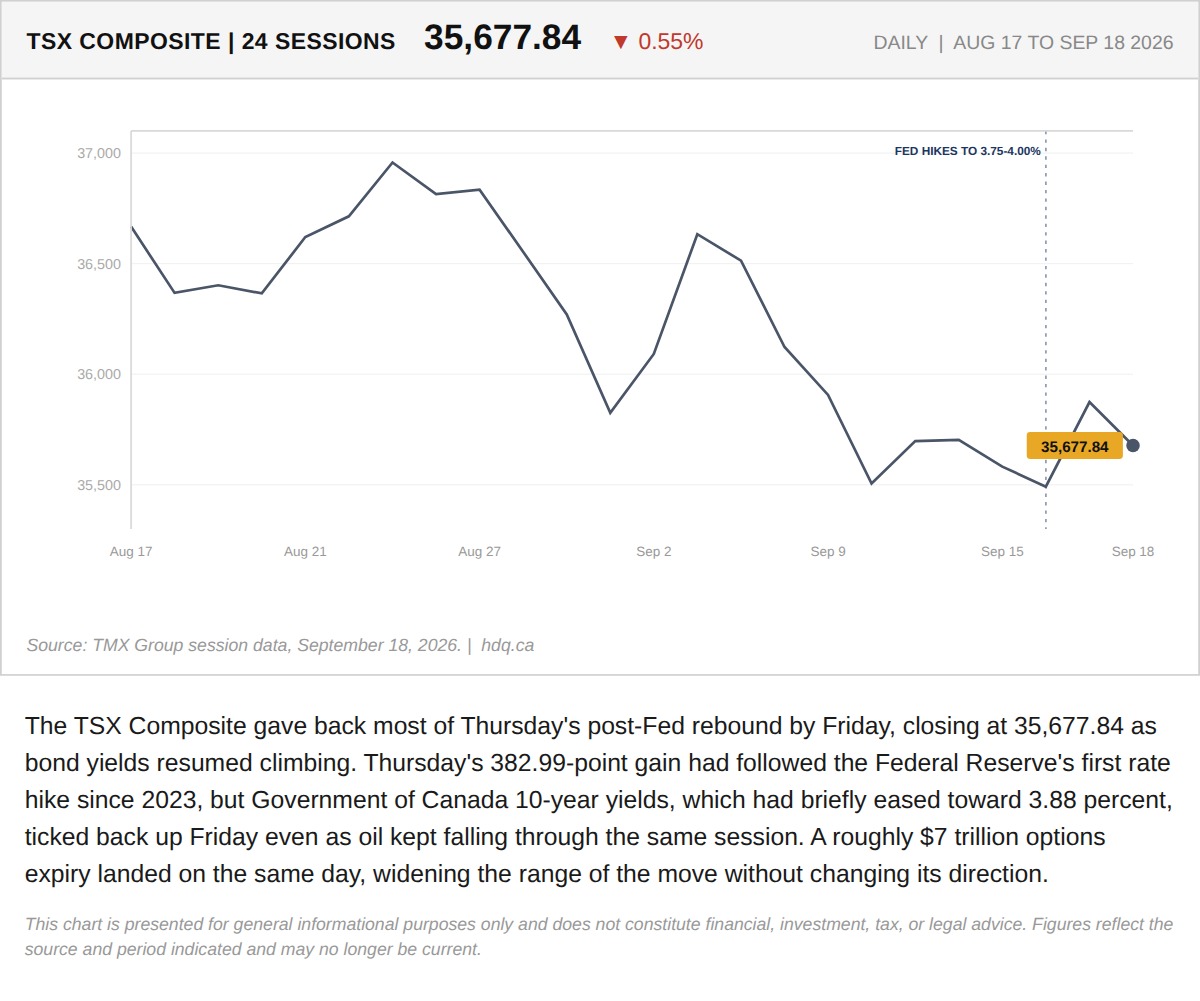
The TSX Composite gave back most of Thursday's post-Fed rebound by Friday, closing at 35,677.84 as bond yields resumed climbing.
TSX Gives Back Post-Fed Rally as Bond Yields Resume Climbing
September 18, 2026
View chart & download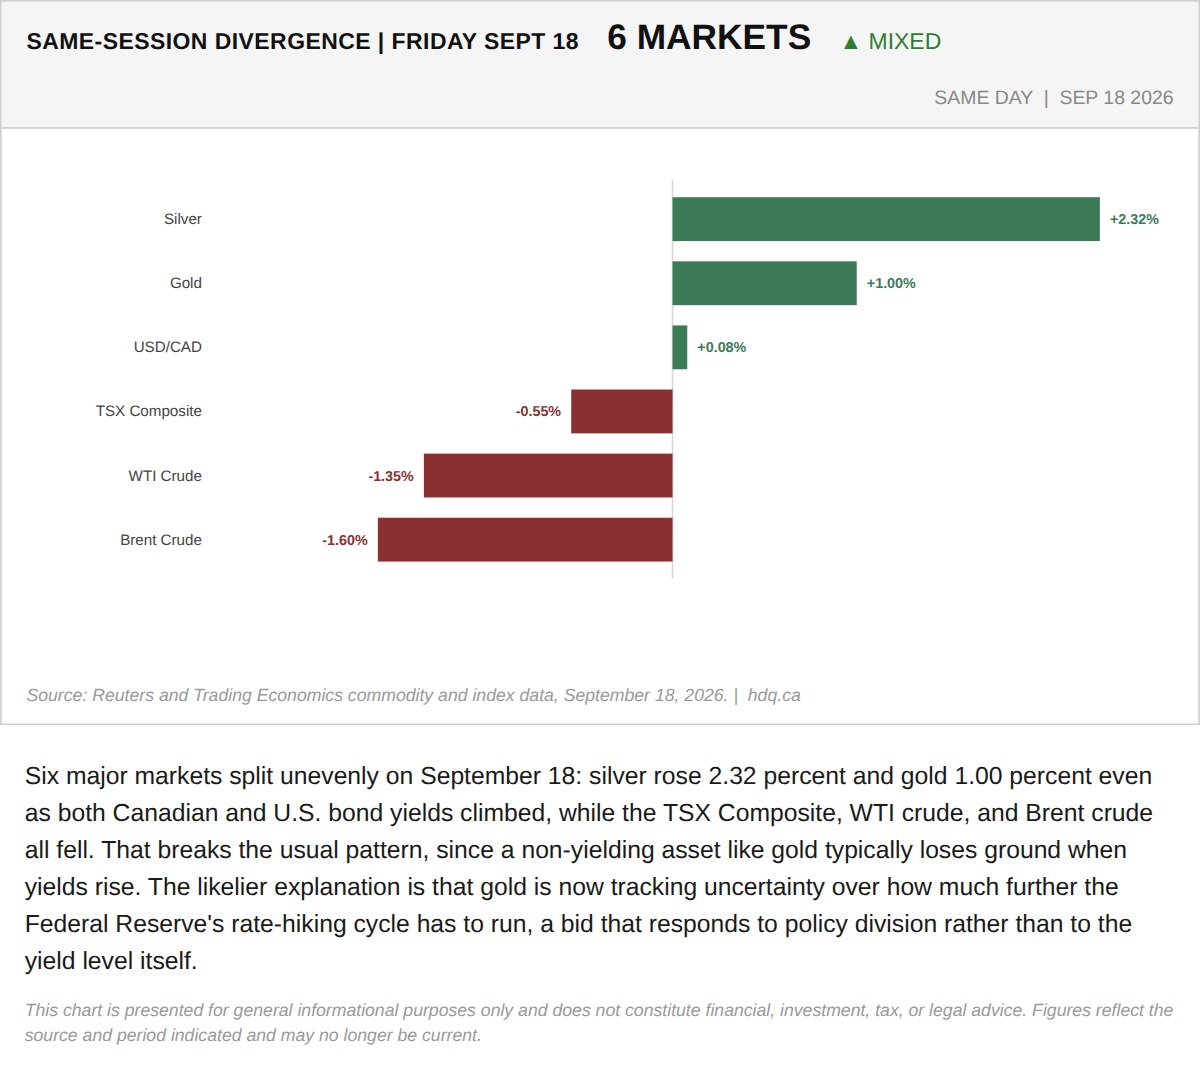
Six major markets split unevenly on September 18: silver rose 2.32 percent and gold 1.00 percent even as both Canadian and U.S.
Gold and Silver Rise With Yields, Breaking the Usual Pattern
September 18, 2026
View chart & download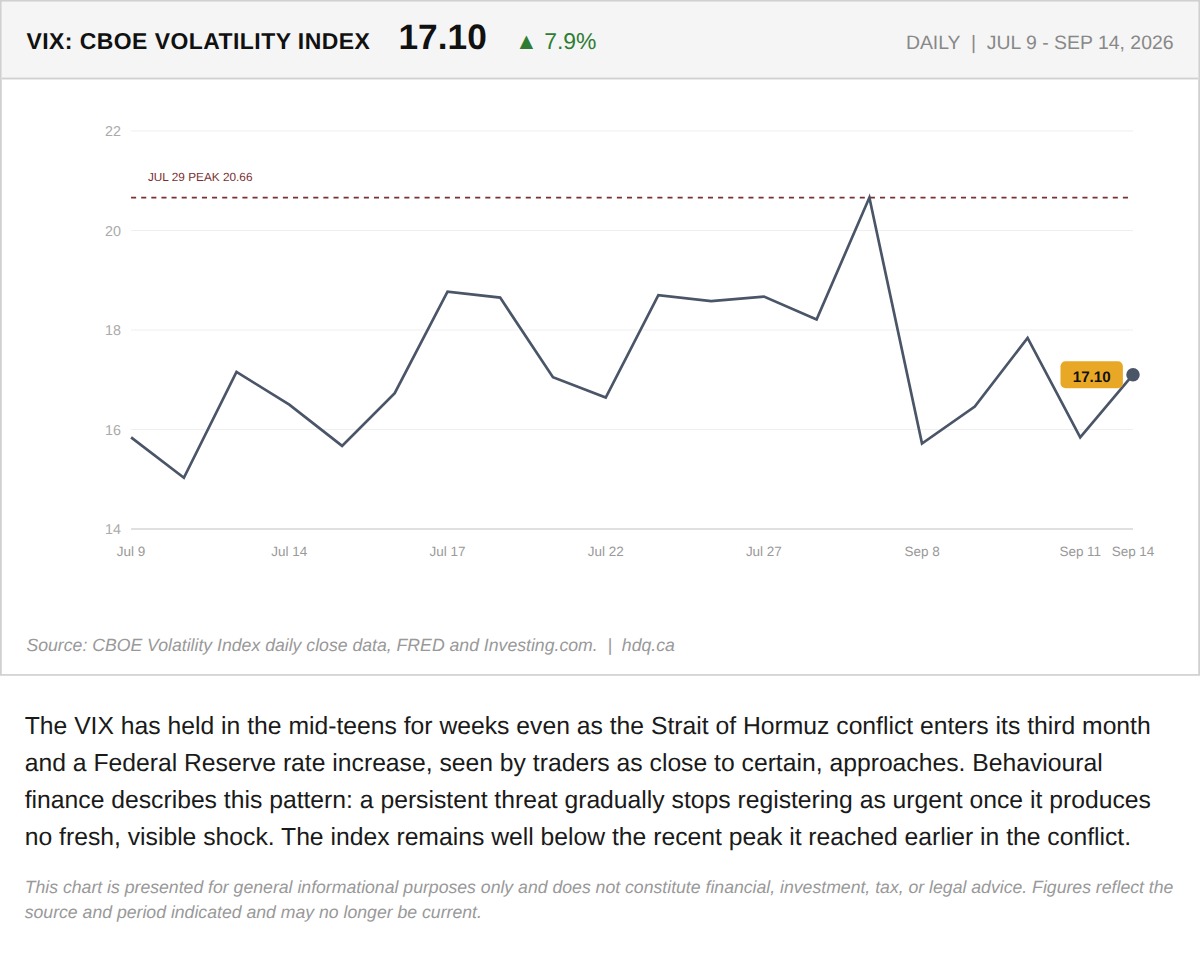
The VIX has held in the mid-teens for weeks even as the Strait of Hormuz conflict enters its third month and a Federal Reserve rate…
Why the Fear Gauge Is Sleeping Through a War and a Rate Hike
September 16, 2026
View chart & download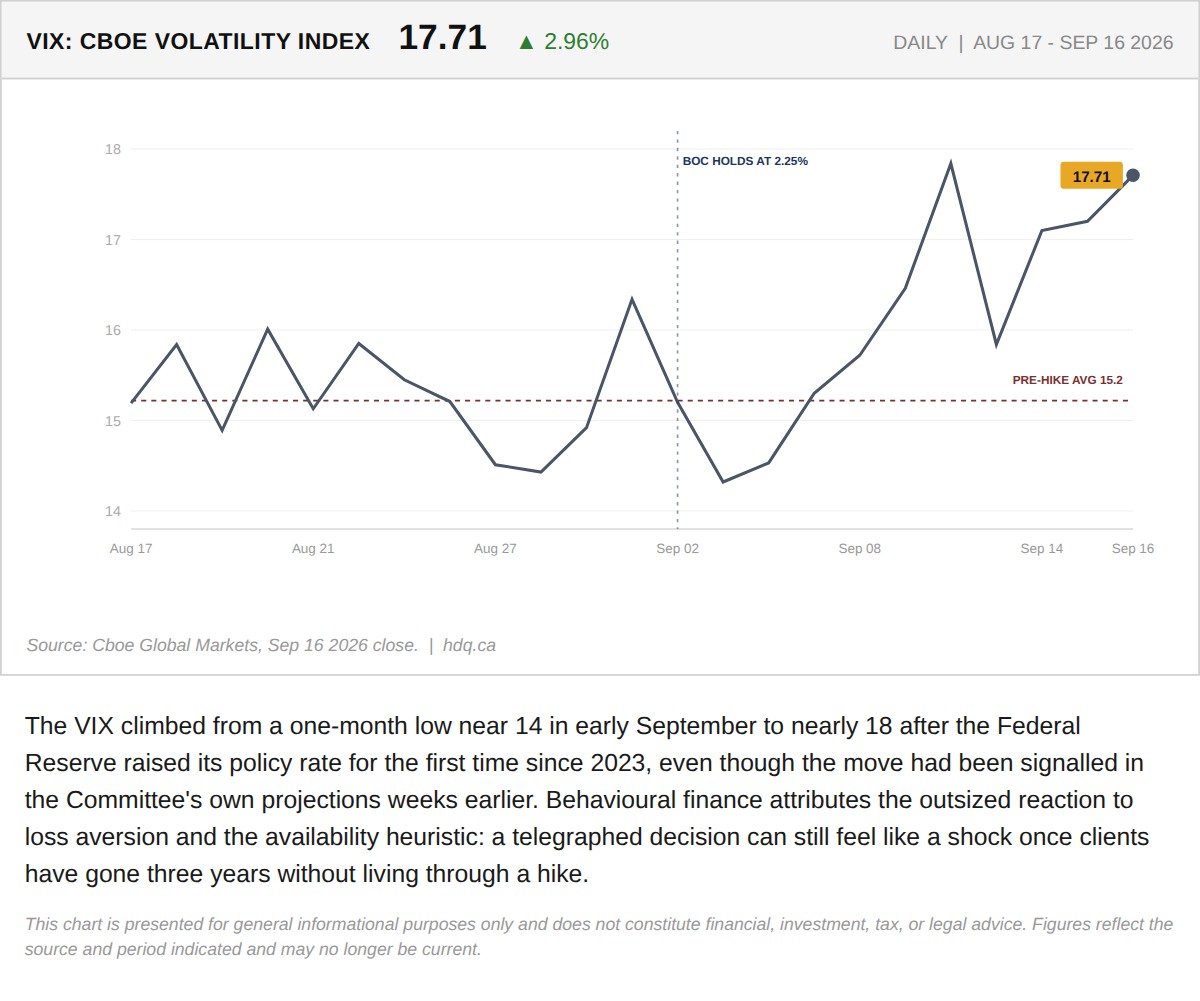
The VIX climbed from a one-month low near 14 in early September to nearly 18 after the Federal Reserve raised its policy rate for the first…
Why an Expected Rate Hike Still Triggered a 631-Point Selloff
September 17, 2026
View chart & download