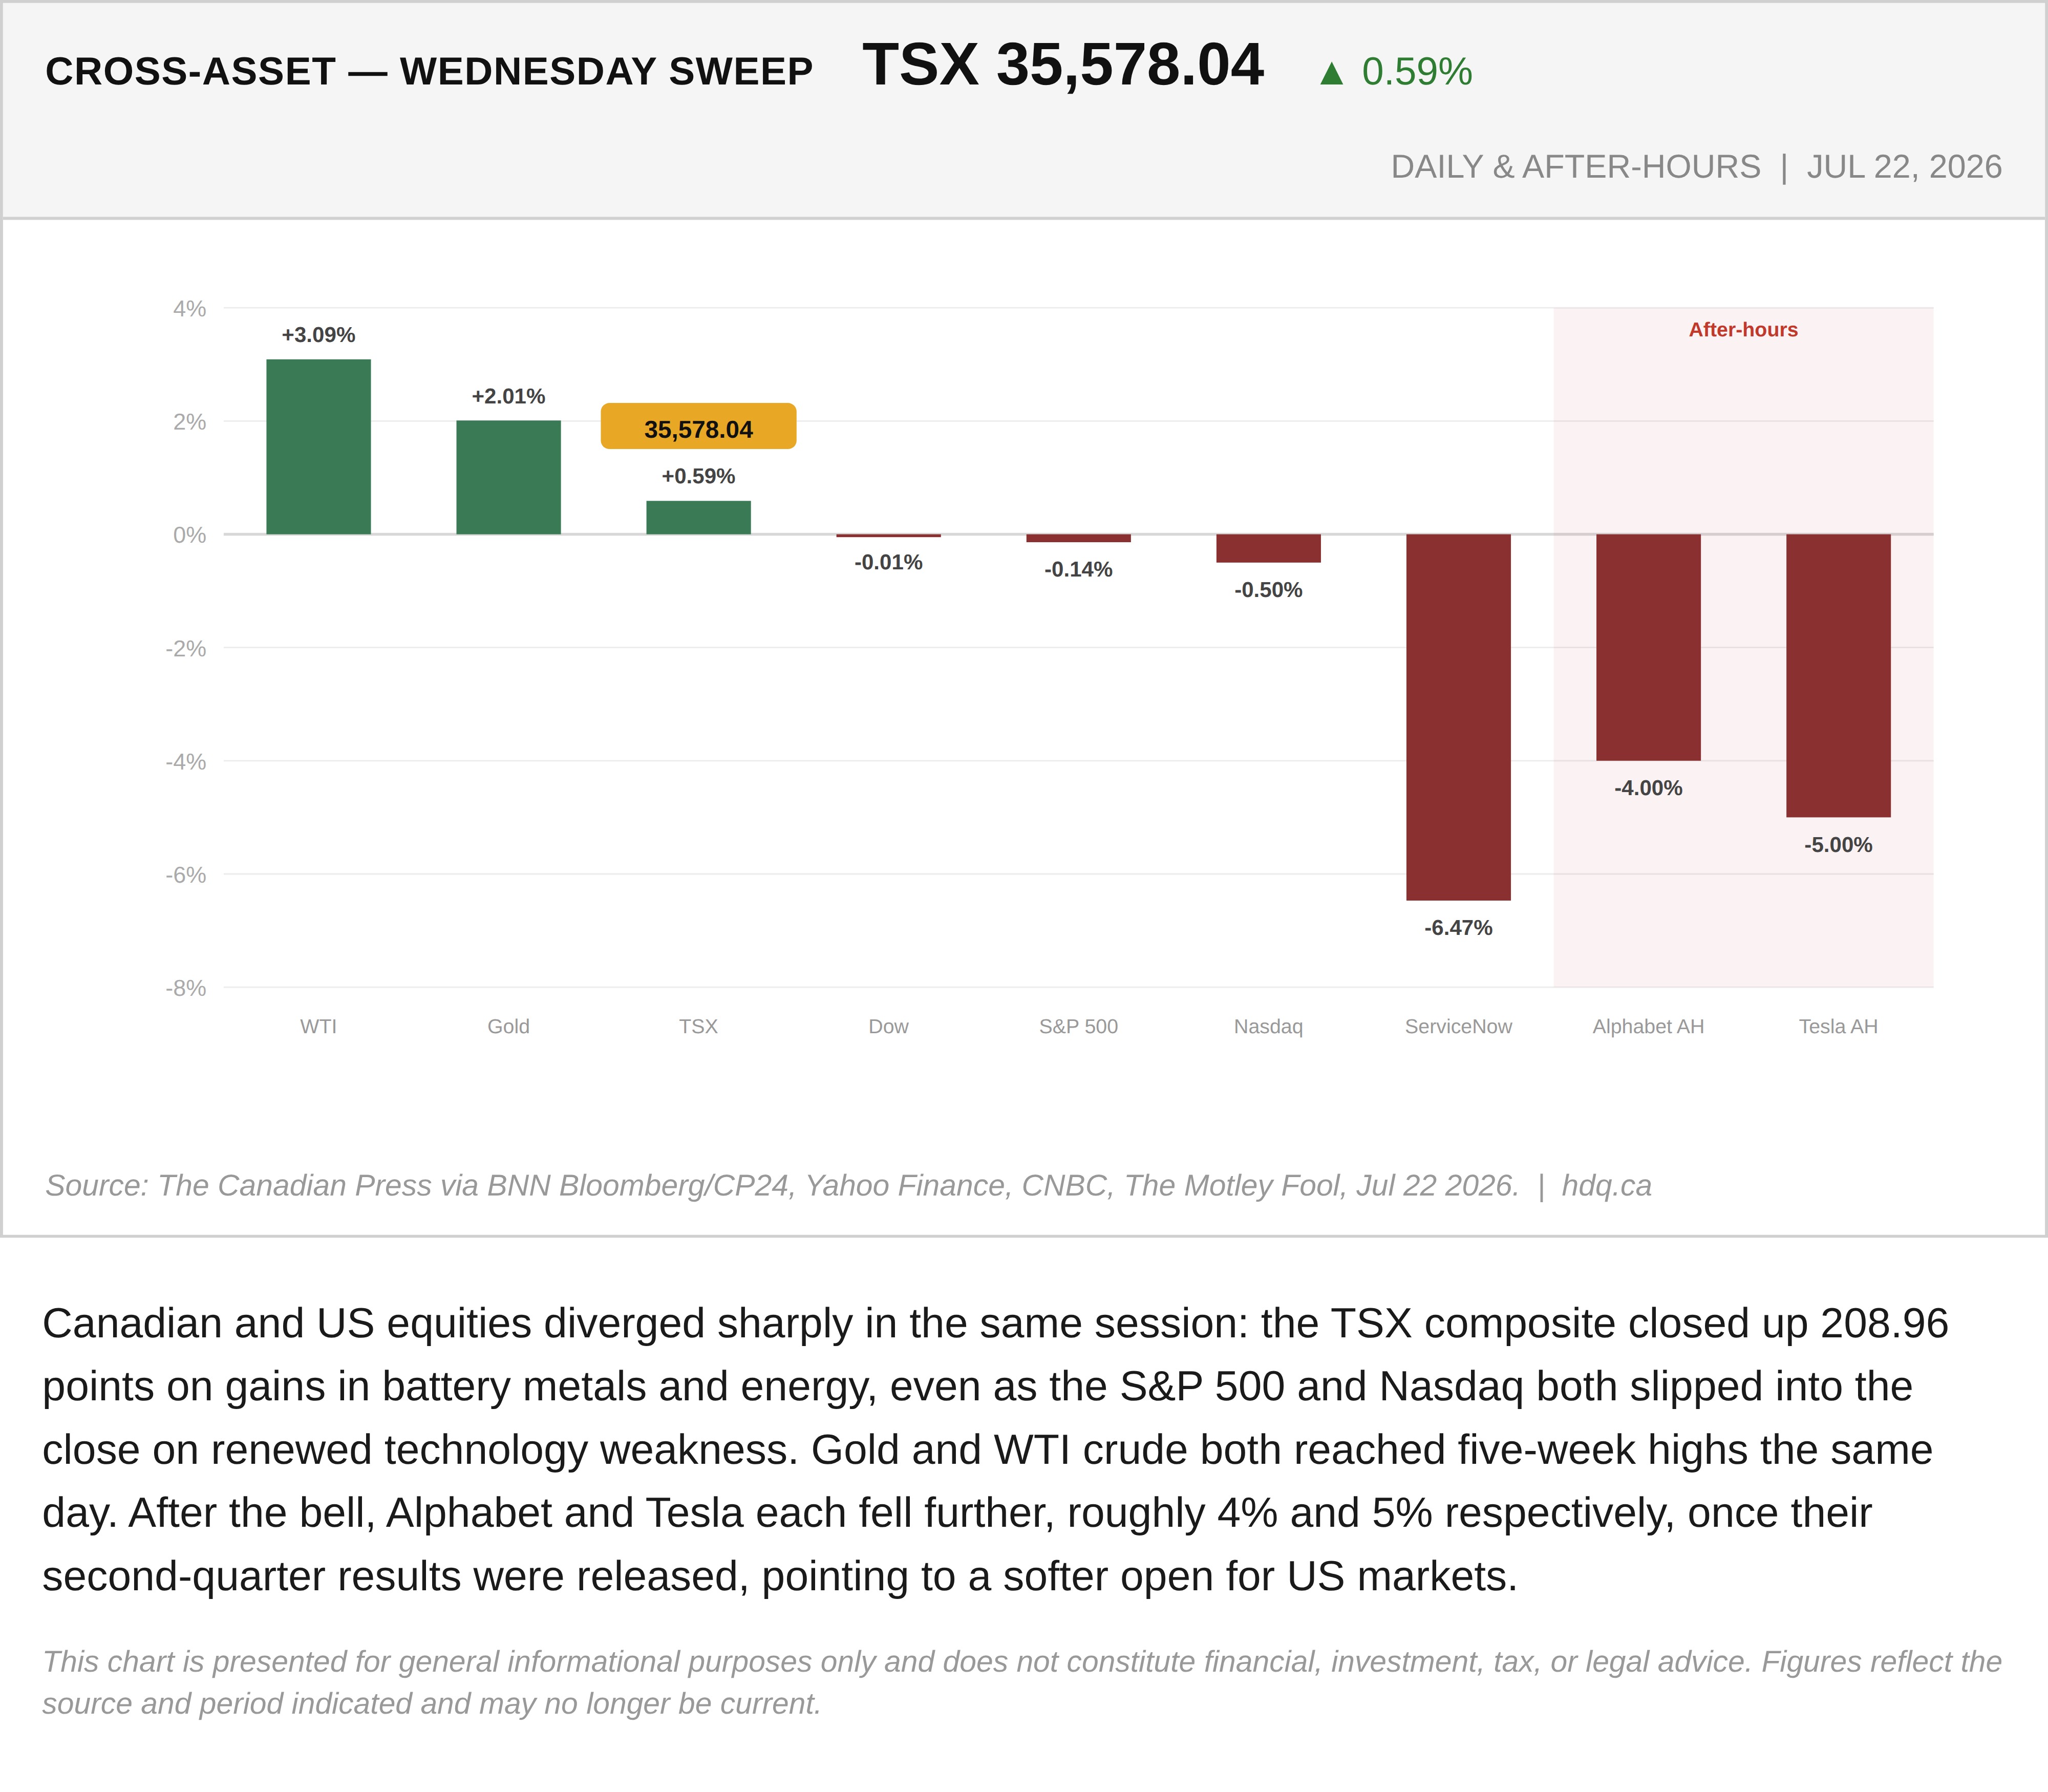
Canadian and US equities diverged sharply in the same session: the TSX composite closed up 208.96 points on gains in battery metals and energy, even as the S&P 500 and Nasdaq both slipped into the close on renewed technology weakness. Gold and WTI crude both reached five-week highs the same day. After the bell, Alphabet and Tesla each fell further, roughly 4% and 5% respectively, once their second-quarter results were released, pointing to a softer open for US markets.
This chart is presented for general informational purposes only and does not constitute financial, investment, tax, or legal advice. Figures reflect the source and period indicated and may no longer be current.

Related charts
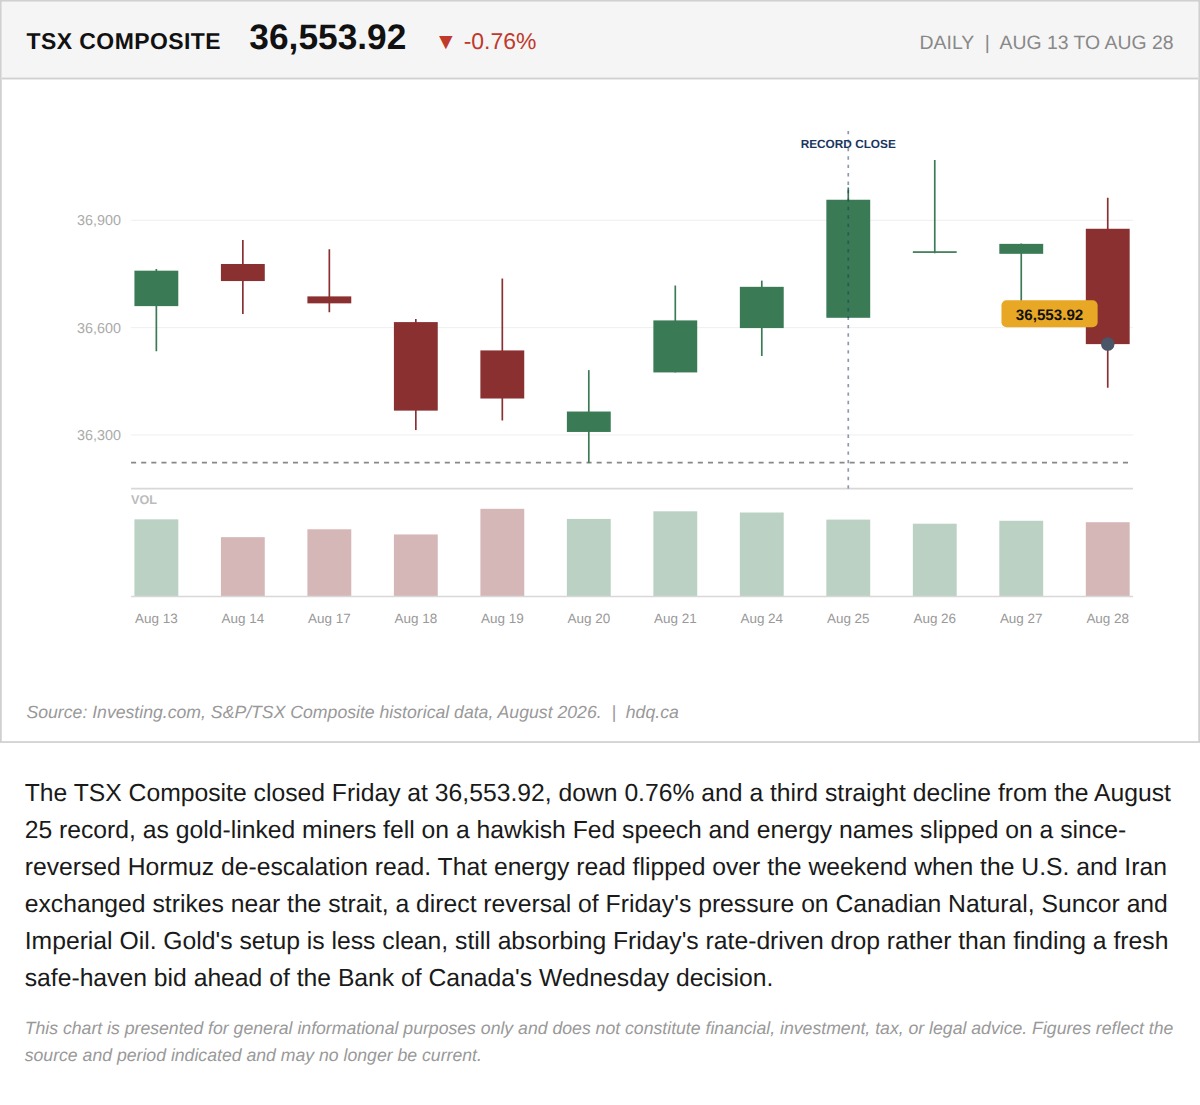
The TSX Composite closed Friday at 36,553.92, down 0.76% and a third straight decline from the August 25 record, as gold-linked miners fell…
The TSX Set a Record Close Six Sessions Ago. It Has Given Back 400 Points Since
August 31, 2026
View chart & download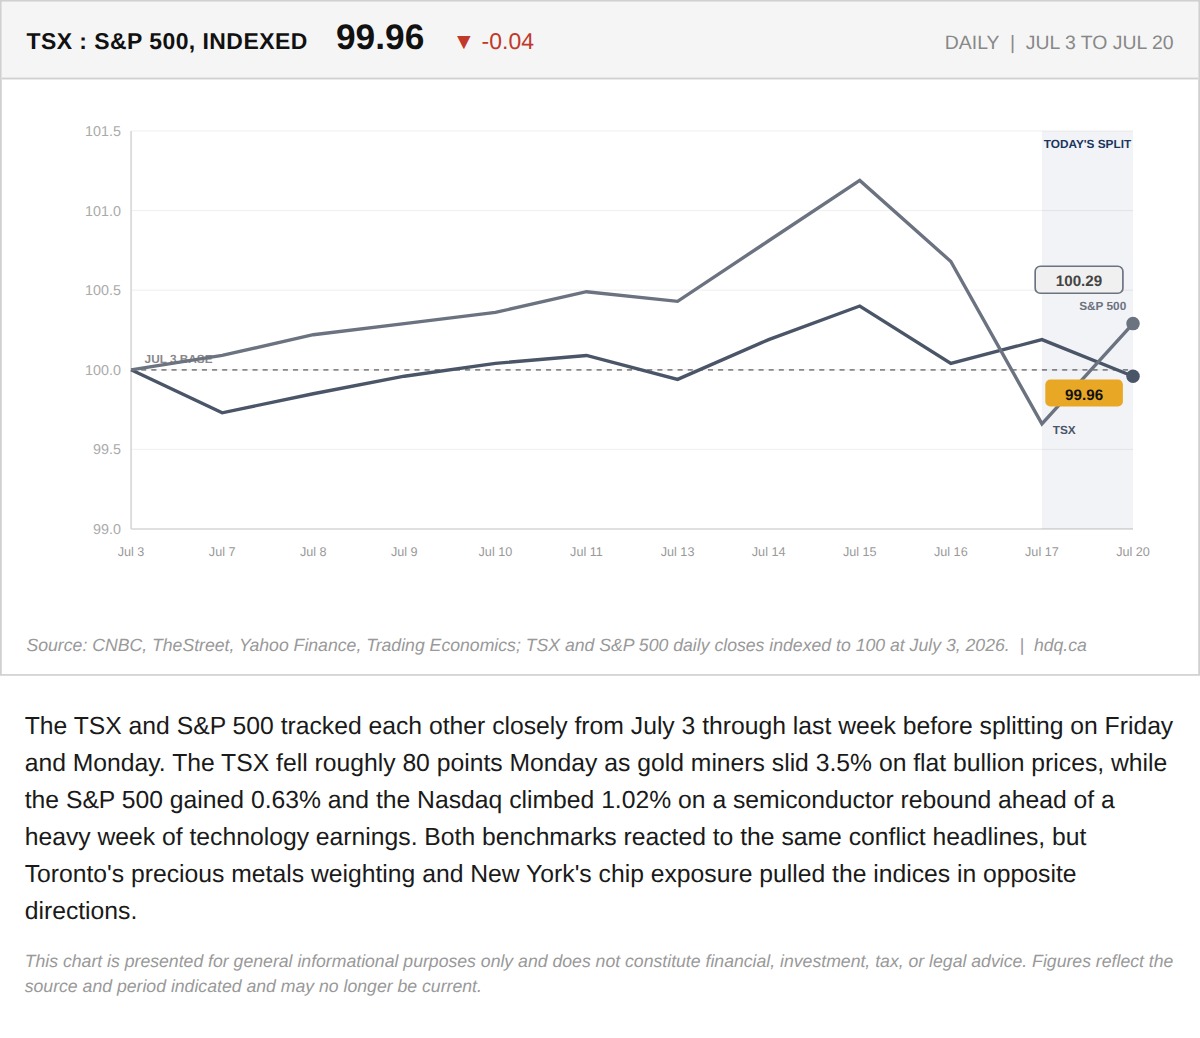
The TSX and S&P 500 tracked each other closely from July 3 through last week before splitting on Friday and Monday.
TSX Falls 80 Points as Gold Miners Slide 3.5%. The S&P 500 Rose 0.6% on the Exact Same Day.
July 20, 2026
View chart & download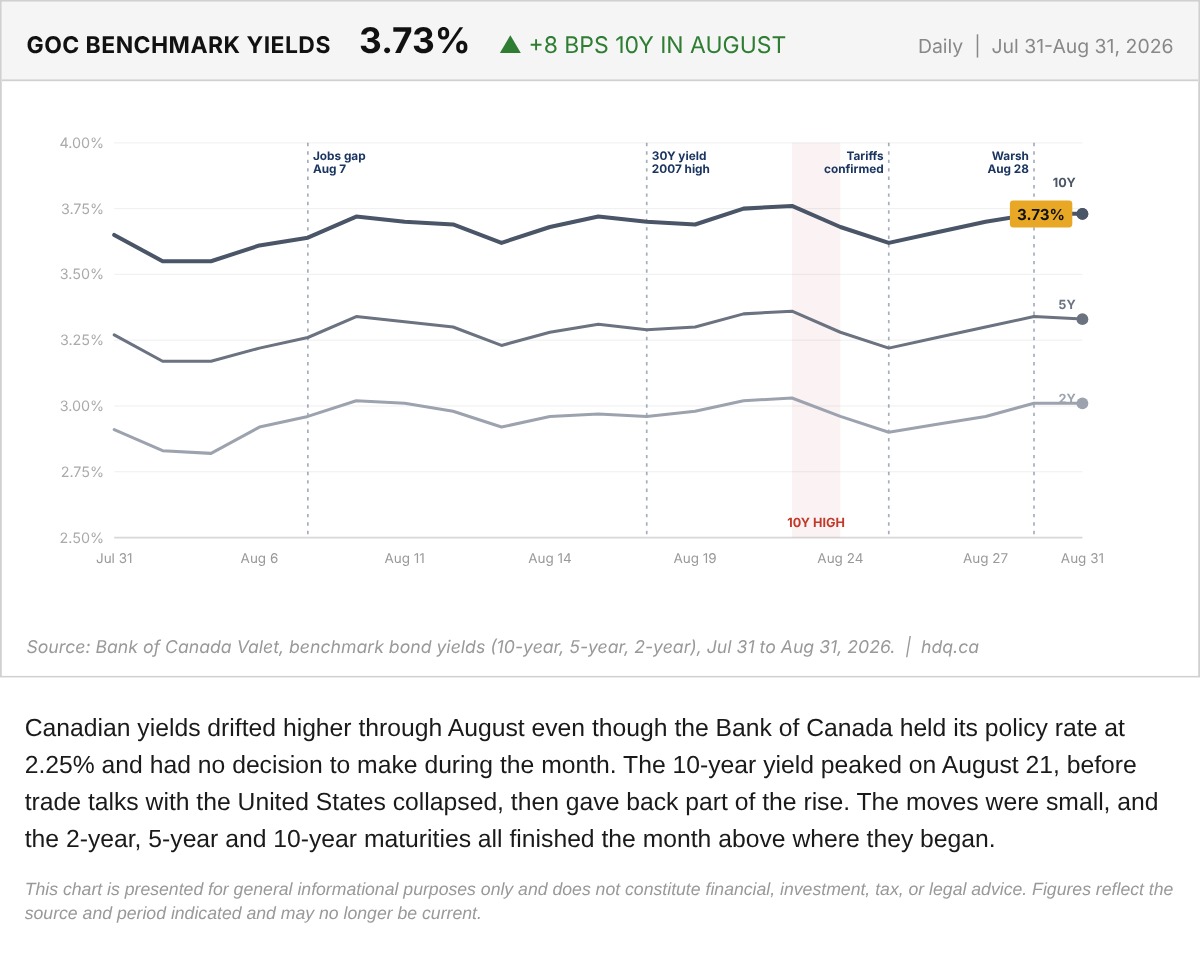
Canadian yields drifted higher through August even though the Bank of Canada held its policy rate at 2.25% and had no decision to make during the month.
Government of Canada Benchmark Yields, August 2026
August 31, 2026
View chart & download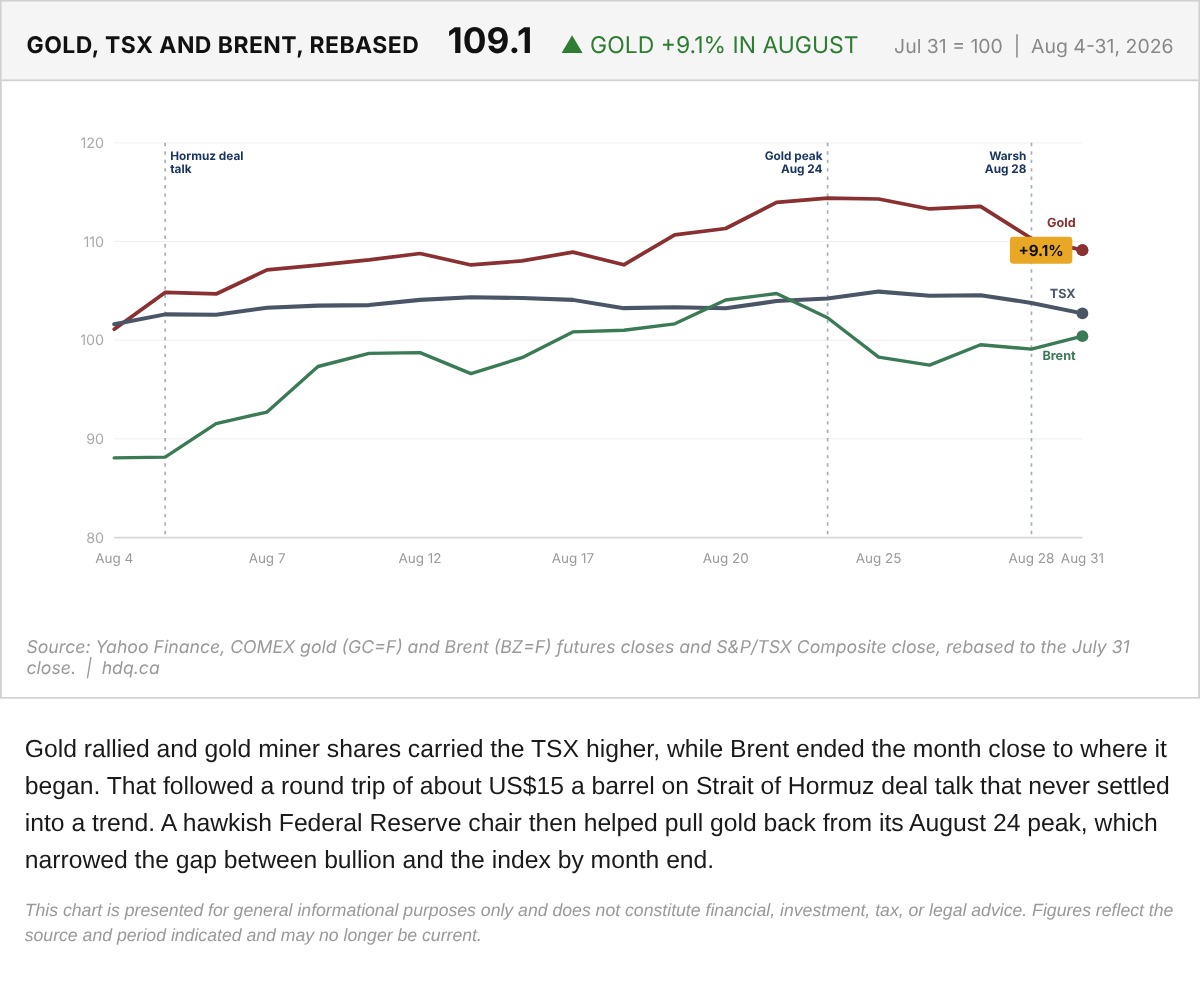
Gold rallied and gold miner shares carried the TSX higher, while Brent ended the month close to where it began.
Gold, TSX and Brent Rebased to the July 31 Close
August 31, 2026
View chart & download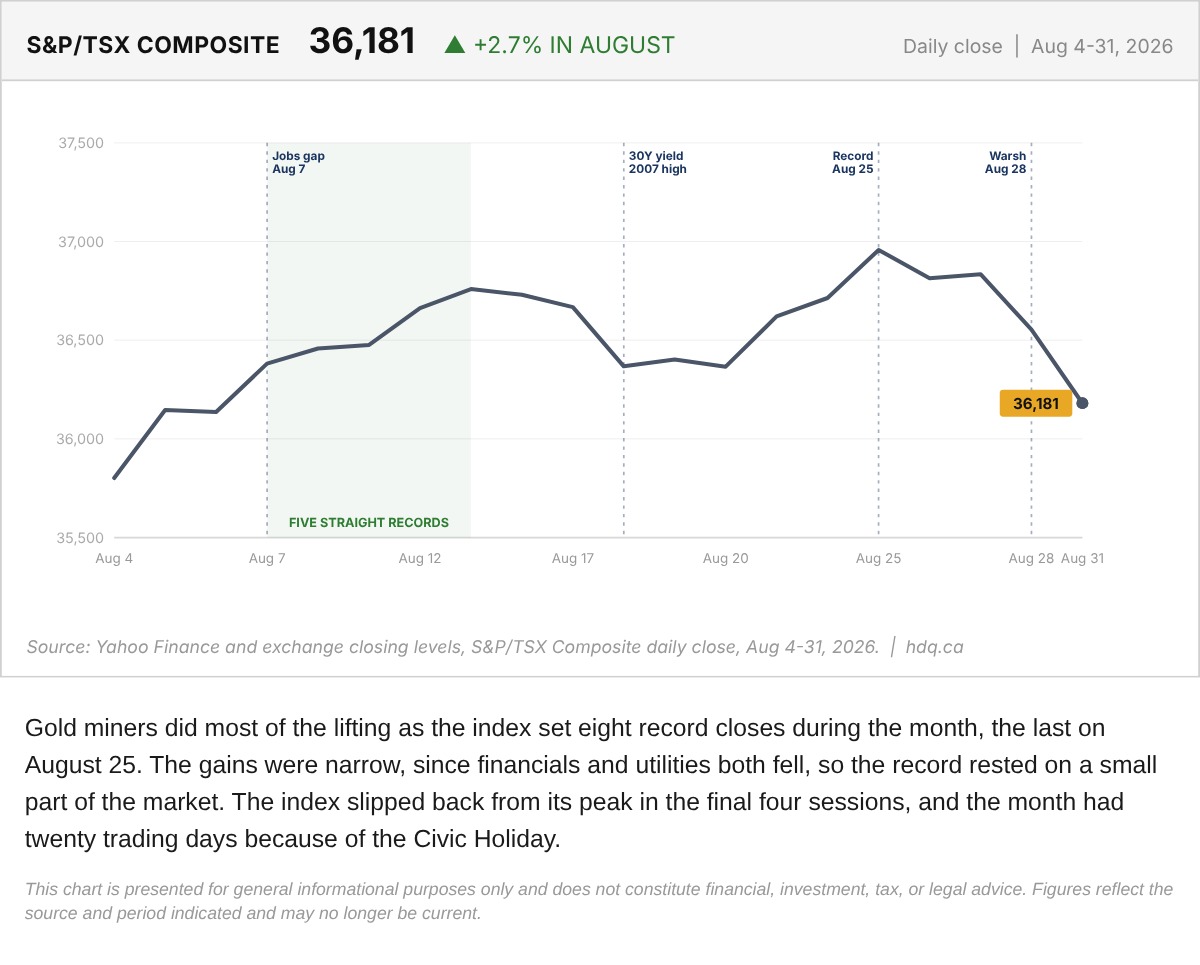
Gold miners did most of the lifting as the index set eight record closes during the month, the last on August 25.
S&P/TSX Composite Daily Close Through August 2026
August 31, 2026
View chart & download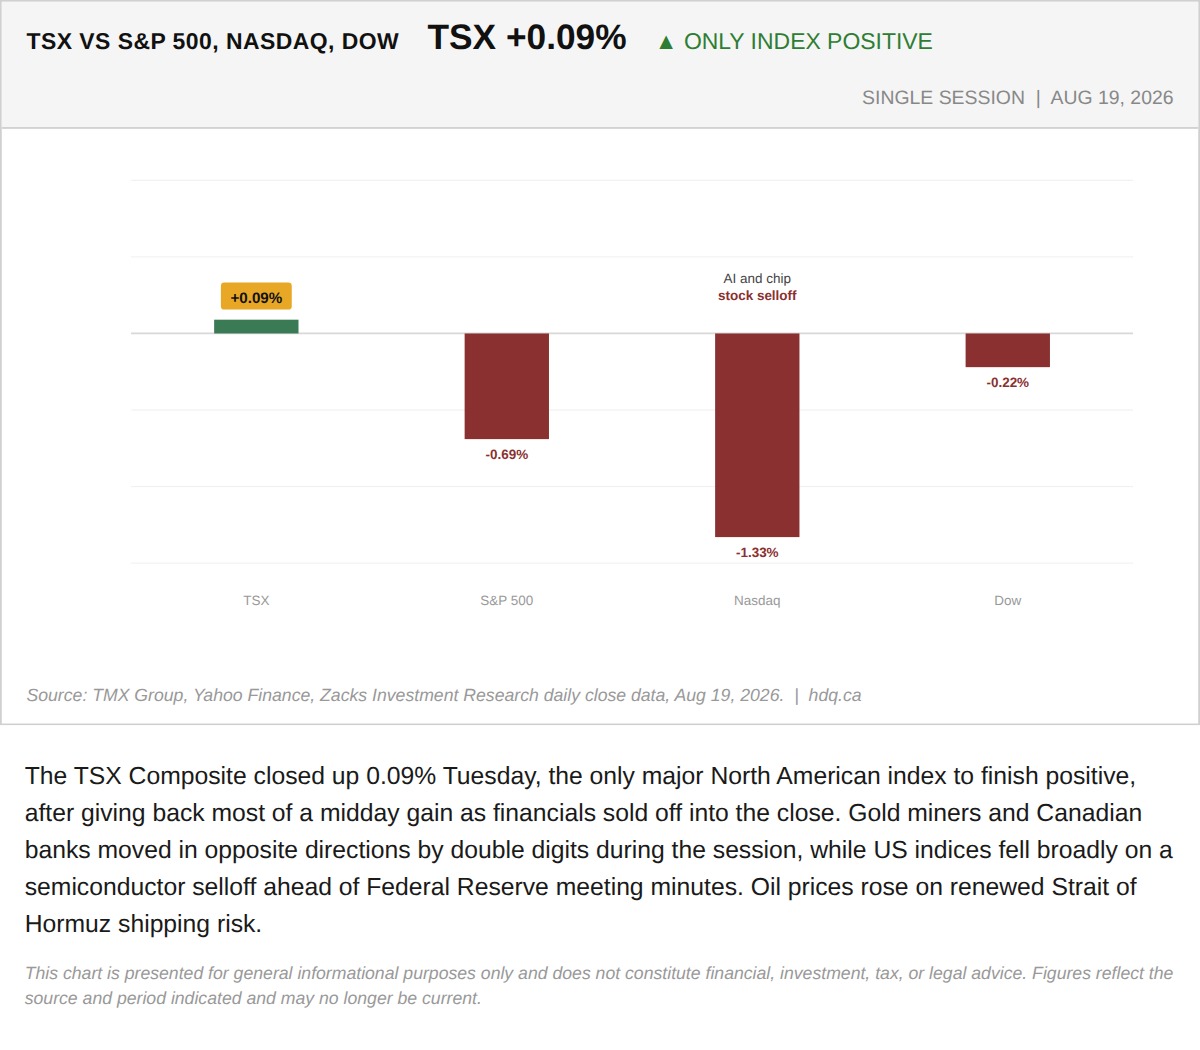
The TSX Composite closed up 0.09% Tuesday, the only major North American index to finish positive, after giving back most of a midday gain as financials sold off into the close.
The TSX Gave Back a 127-Point Tariff Rally as Financials Sold Off Into the Close
August 19, 2026
View chart & download