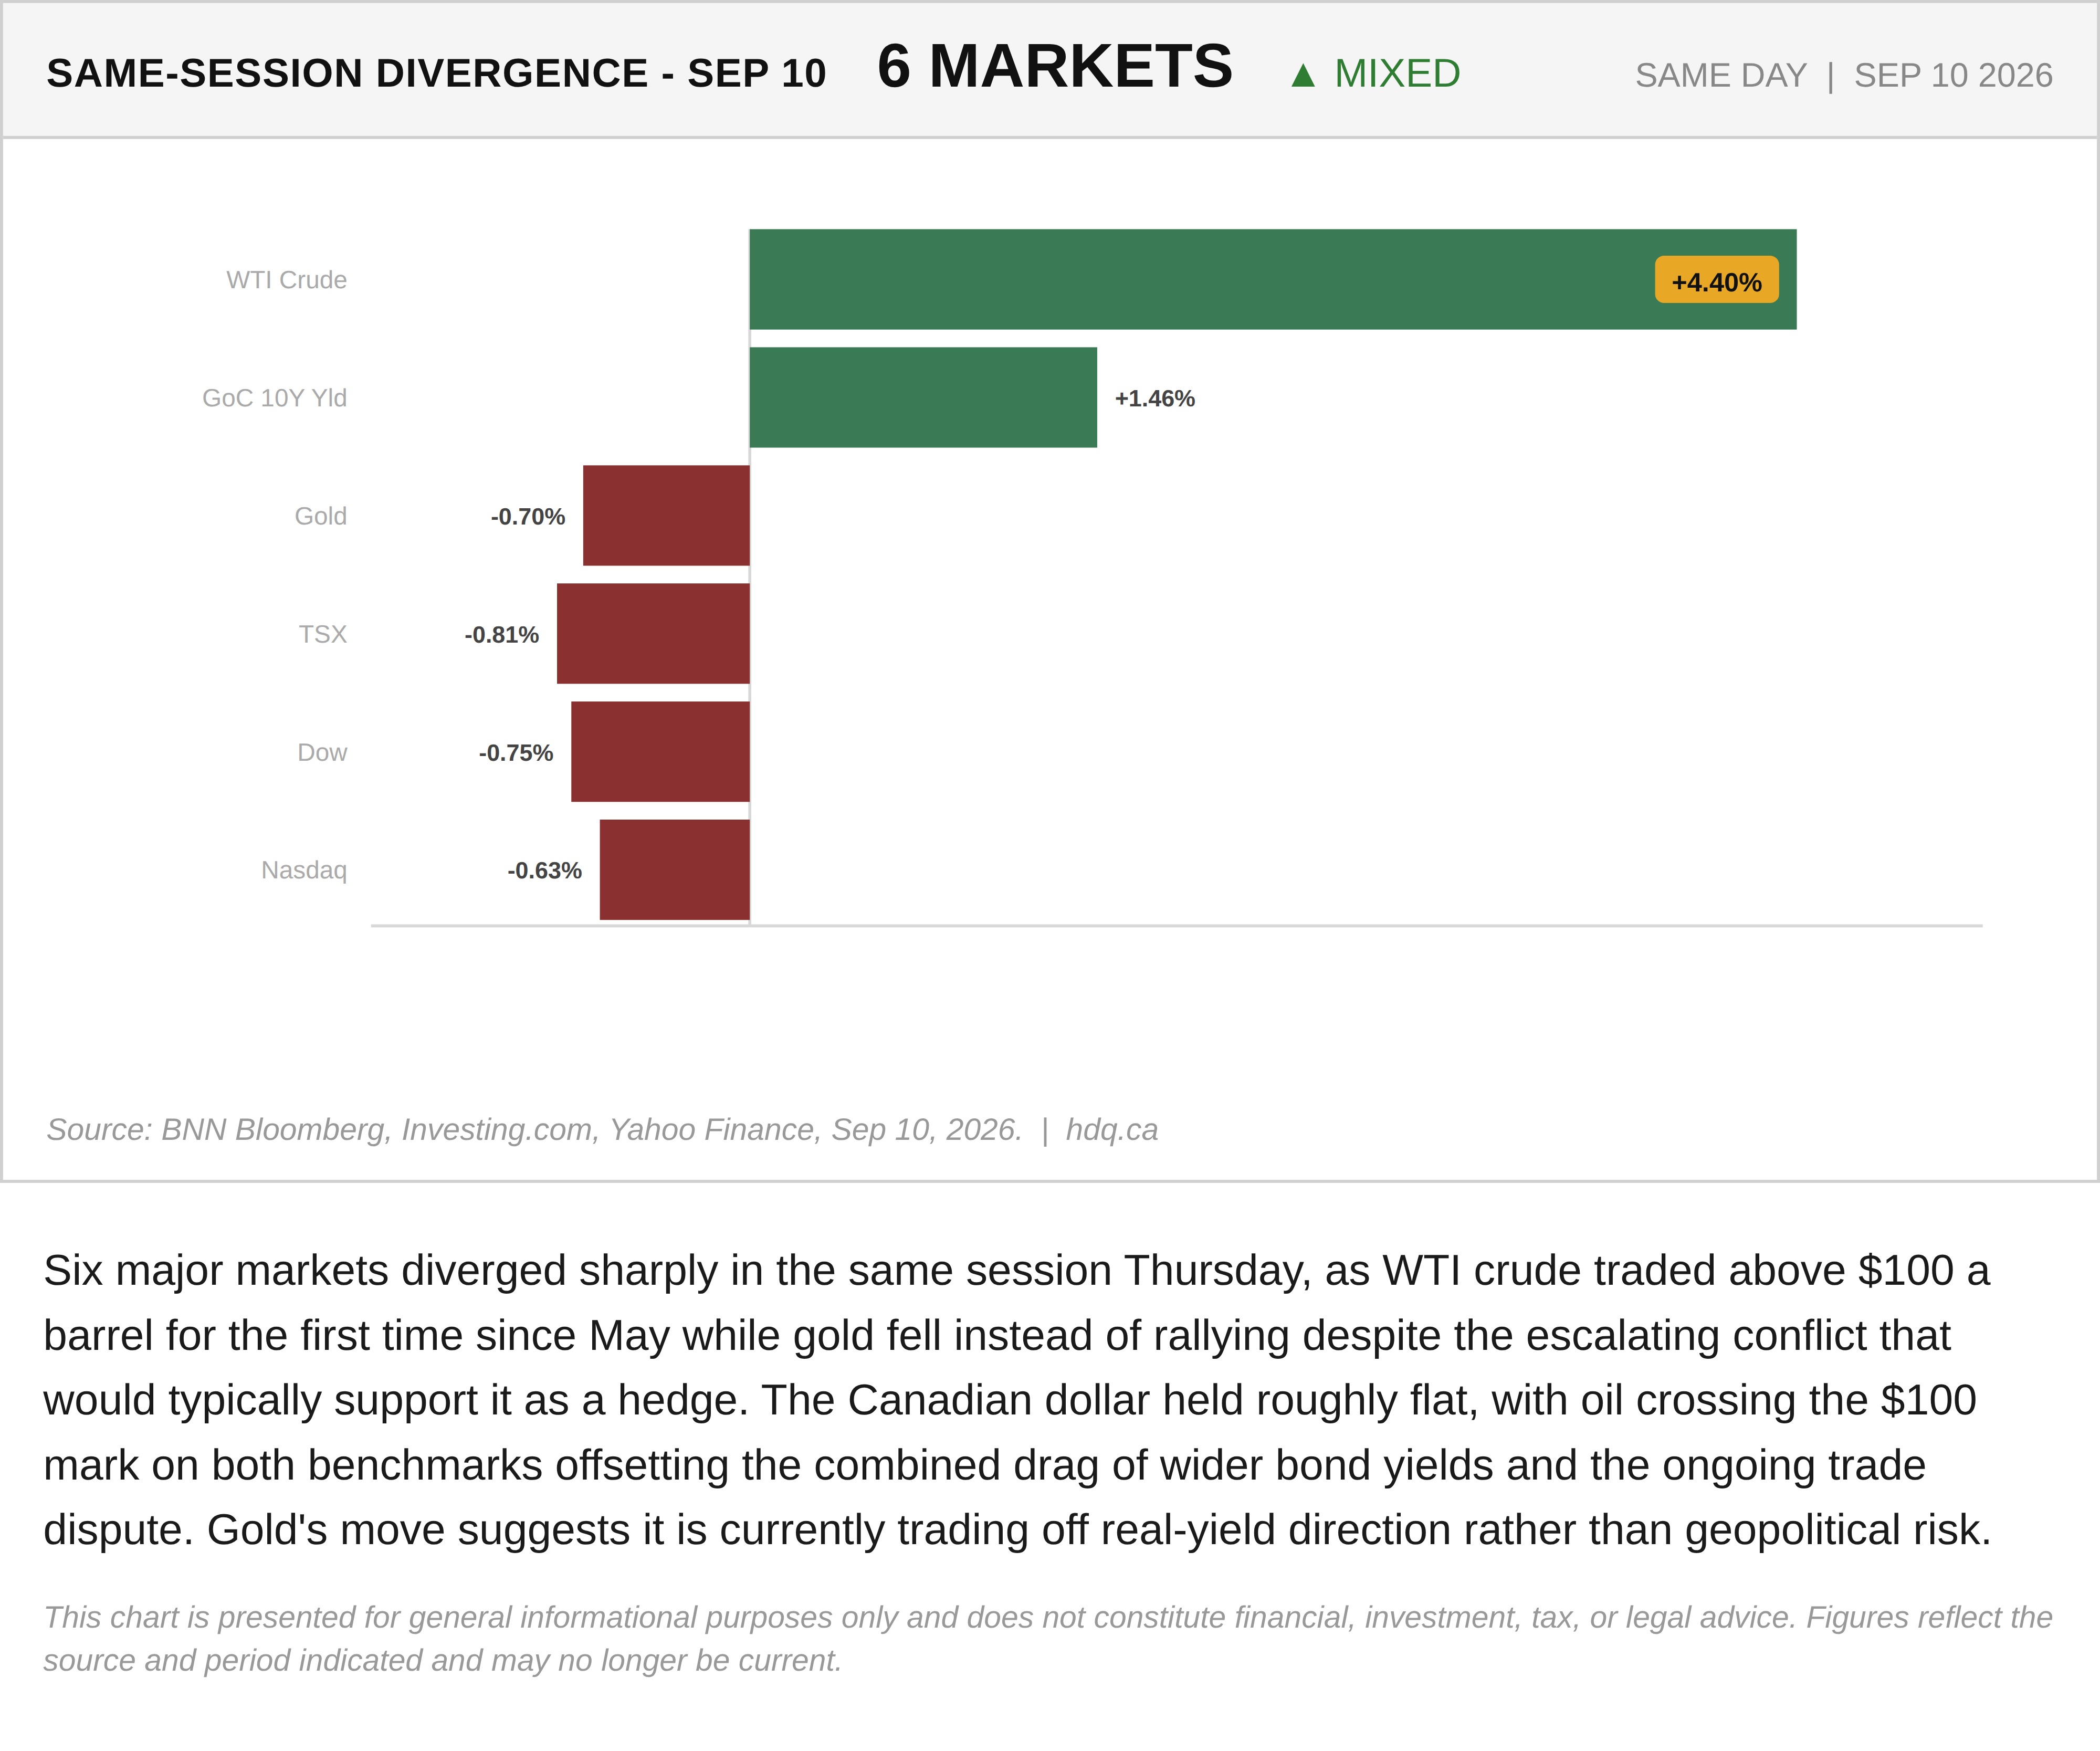
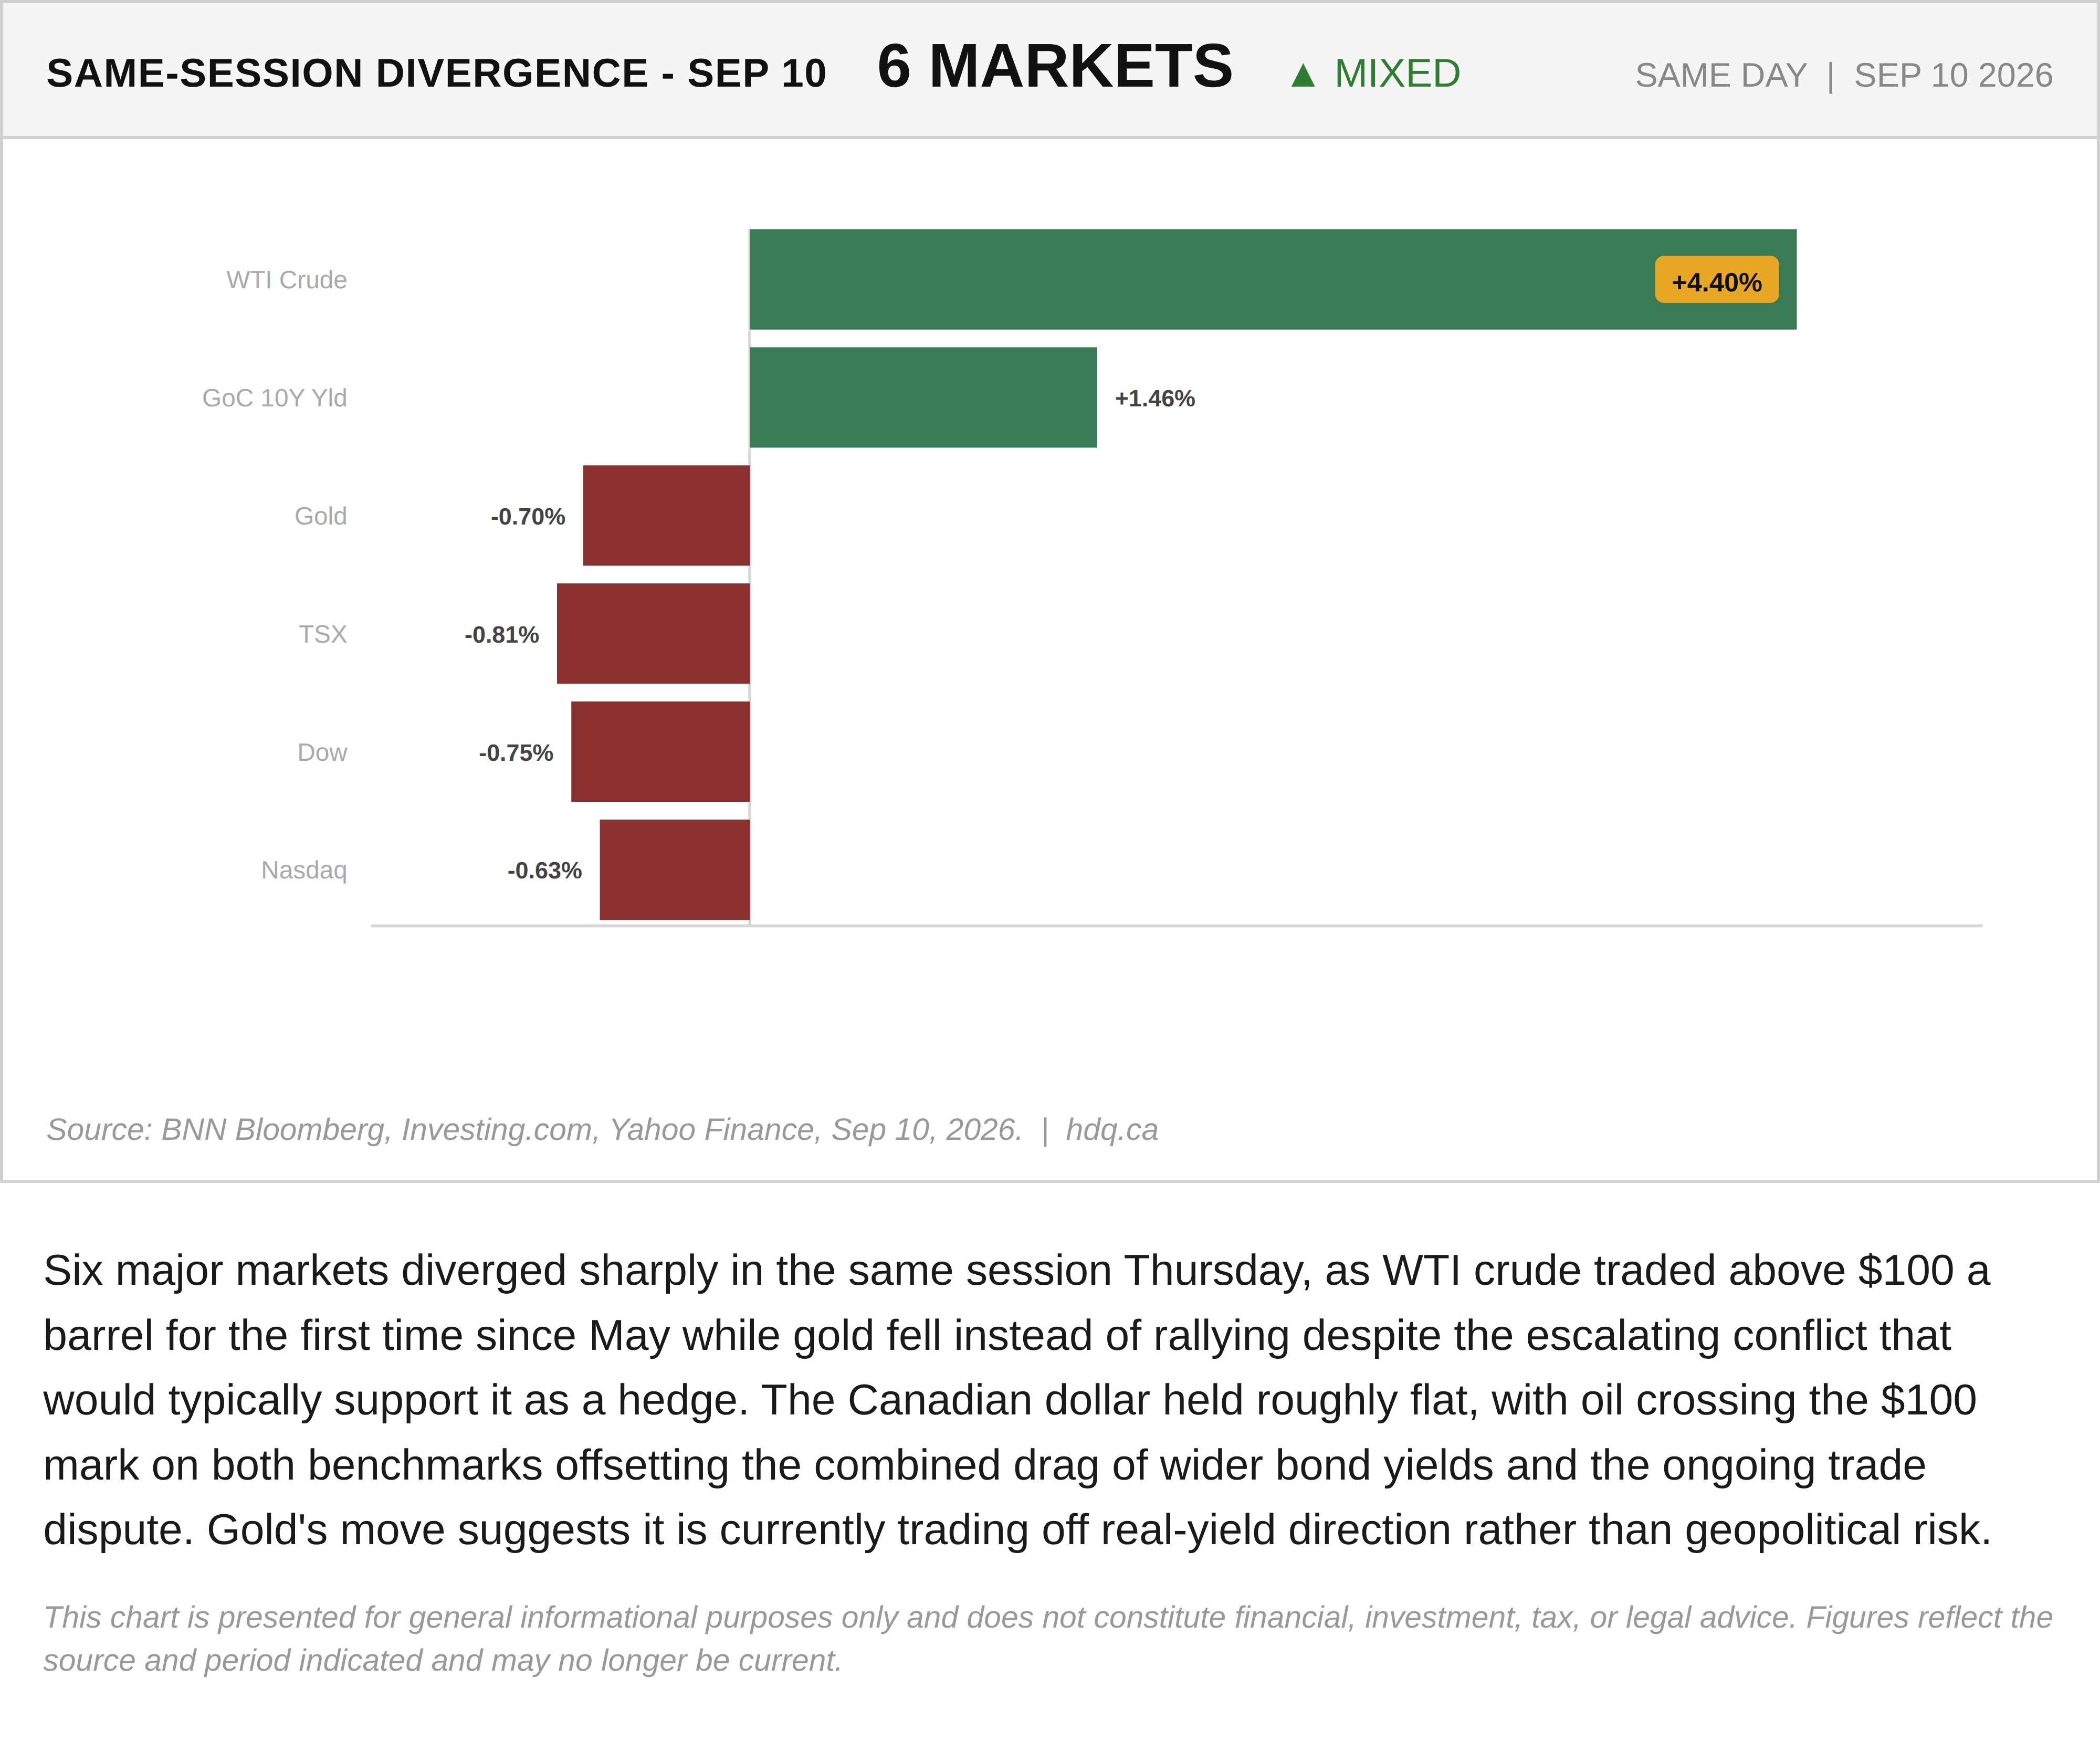
Six major markets diverged sharply in the same session Thursday, as WTI crude traded above $100 a barrel for the first time since May while gold fell instead of rallying despite the escalating conflict that would typically support it as a hedge. The Canadian dollar held roughly flat, with oil crossing the $100 mark on both benchmarks offsetting the combined drag of wider bond yields and the ongoing trade dispute. Gold's move suggests it is currently trading off real-yield direction rather than geopolitical risk.
This chart is presented for general informational purposes only and does not constitute financial, investment, tax, or legal advice. Figures reflect the source and period indicated and may no longer be current.
Related charts
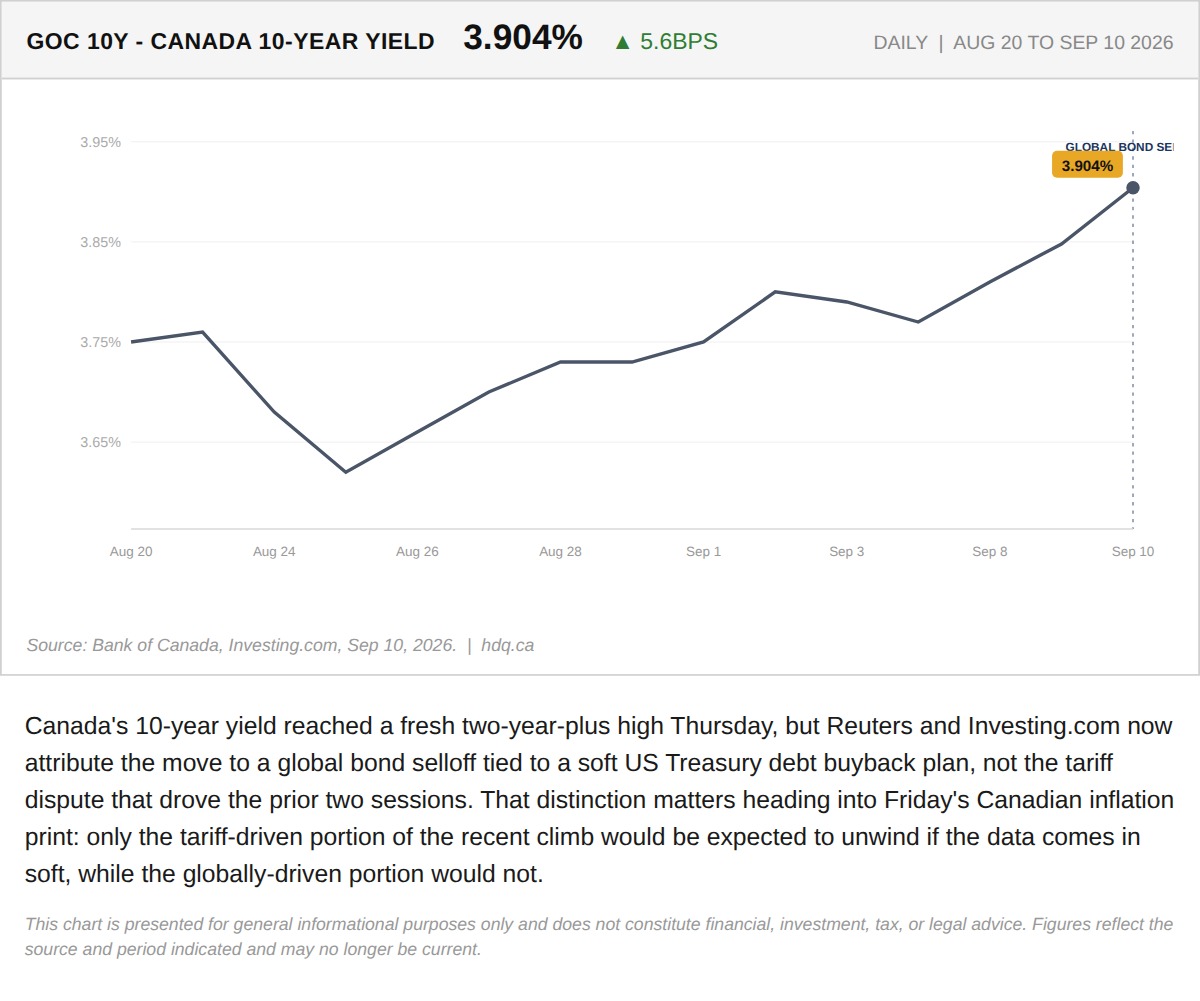
Canada's 10-year yield reached a fresh two-year-plus high Thursday, but Reuters and Investing.com now attribute the move to a global bond…
Canada's Bond Yield Hits a Fresh Two-Year High, But Not for the Reason Tuesday's Move Was
September 10, 2026
View chart & download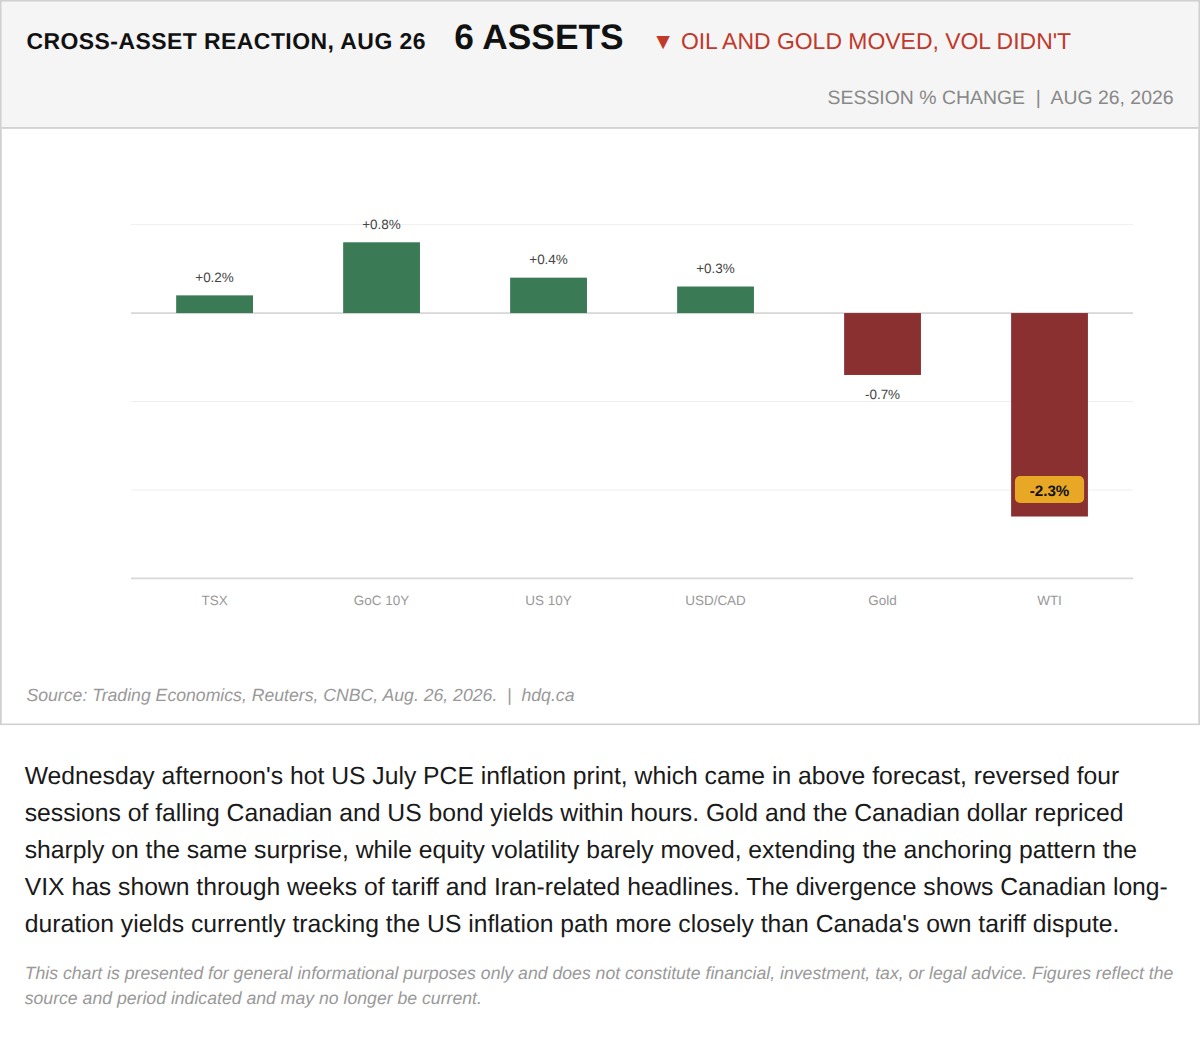
Wednesday afternoon's hot US July PCE inflation print, which came in above forecast, reversed four sessions of falling Canadian and US bond yields within hours.
The July PCE Surprise Reversed Four Days of Falling Canadian Yields in One Afternoon
August 26, 2026
View chart & download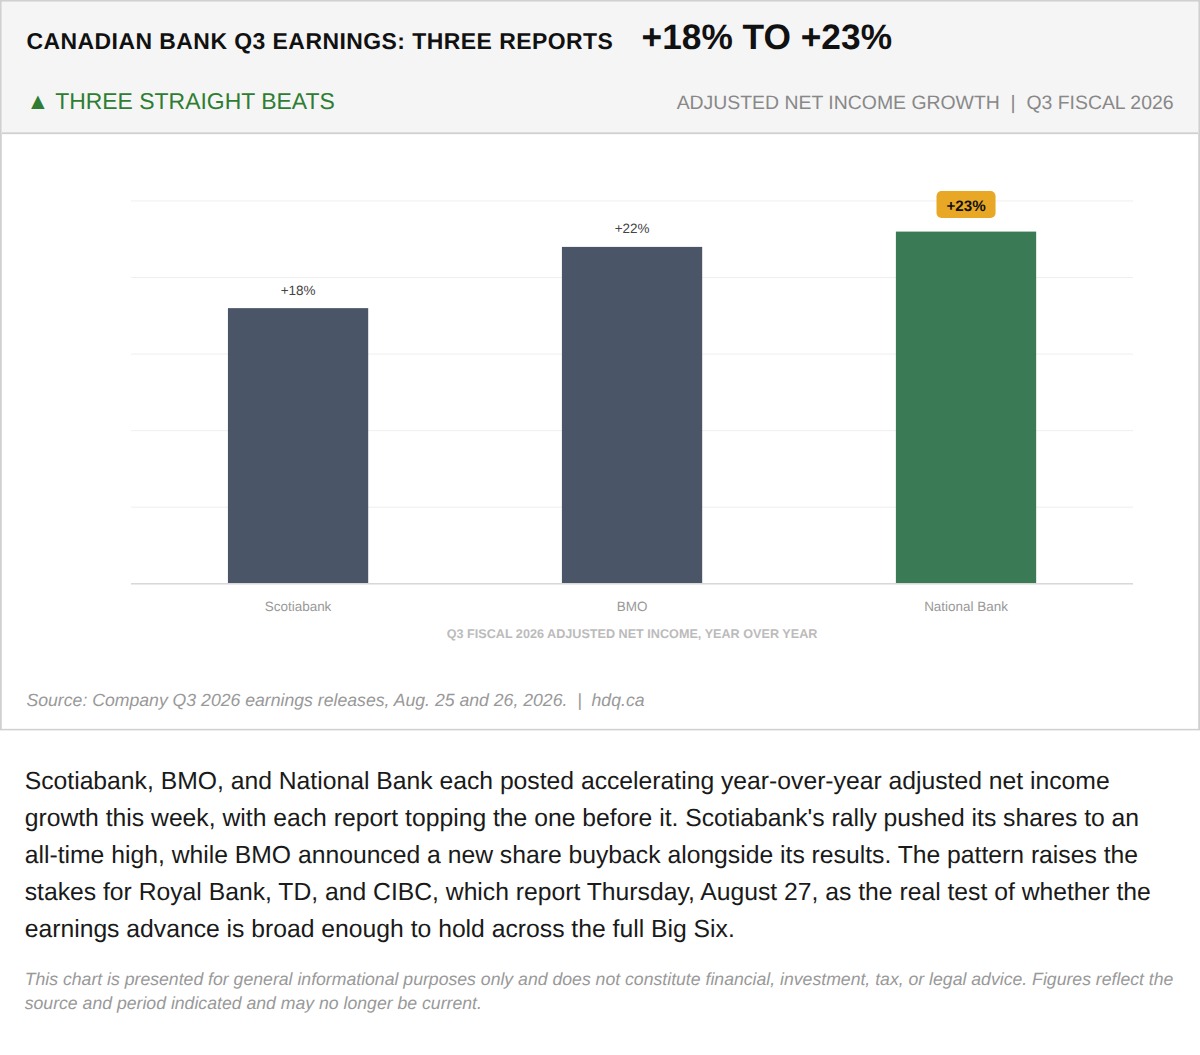
Scotiabank, BMO, and National Bank each posted accelerating year-over-year adjusted net income growth this week, with each report topping the one before it.
The July PCE Surprise Reversed Four Days of Falling Canadian Yields in One Afternoon
August 26, 2026
View chart & download
Brent was the only one of the three to finish above its starting level, while the index and gold both fell.
Brent, TSX and Gold Rebased to the August 31 Close
September 30, 2026
View chart & download
The Bank of Canada held its policy rate at 2.25% for a seventh straight time, yet Canadian yields rose as United States yields surged.
Government of Canada Benchmark Yields, September 2026
September 30, 2026
View chart & download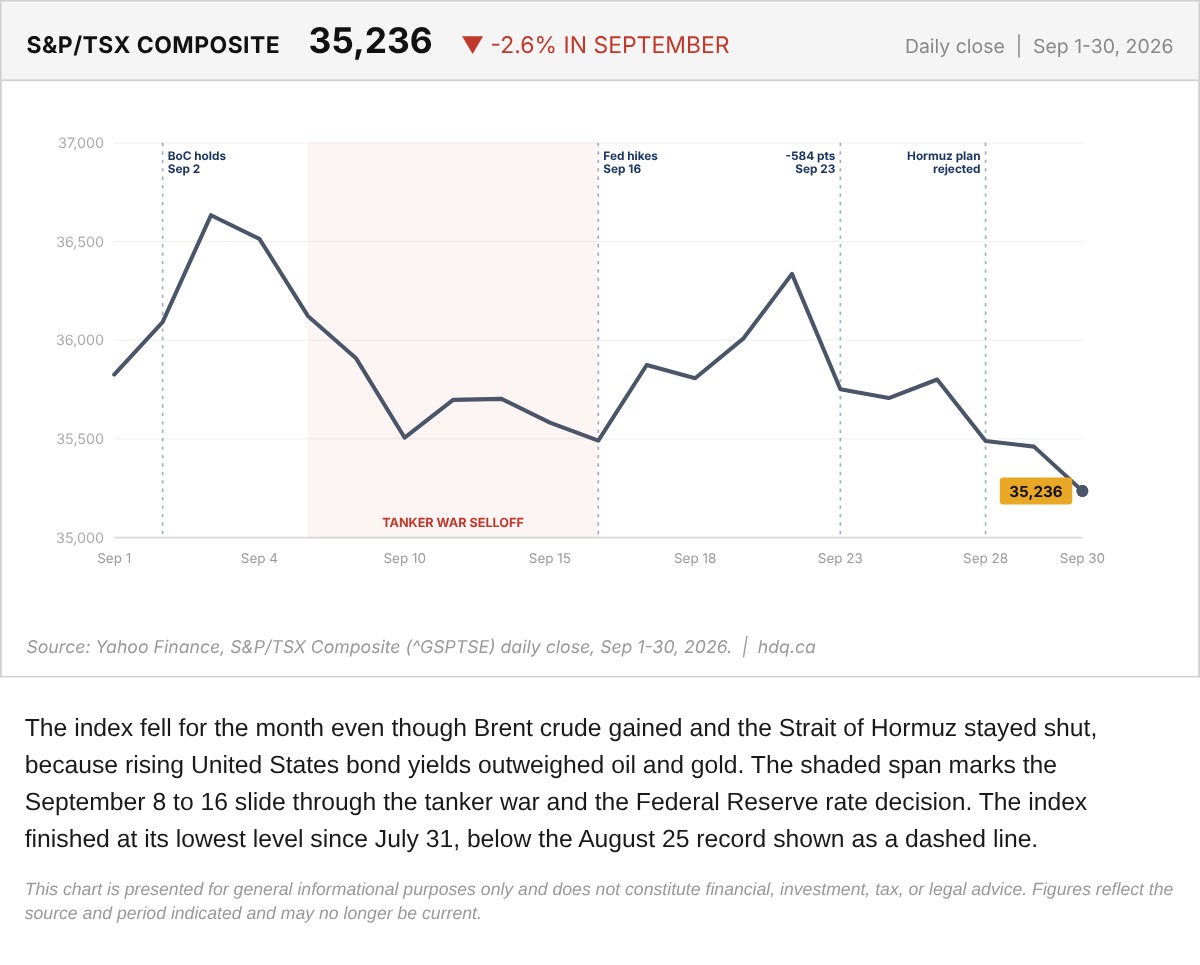
The index fell for the month even though Brent crude gained and the Strait of Hormuz stayed shut, because rising United States bond yields outweighed oil and gold.
S&P/TSX Composite Daily Close Through September 2026
September 30, 2026
View chart & download