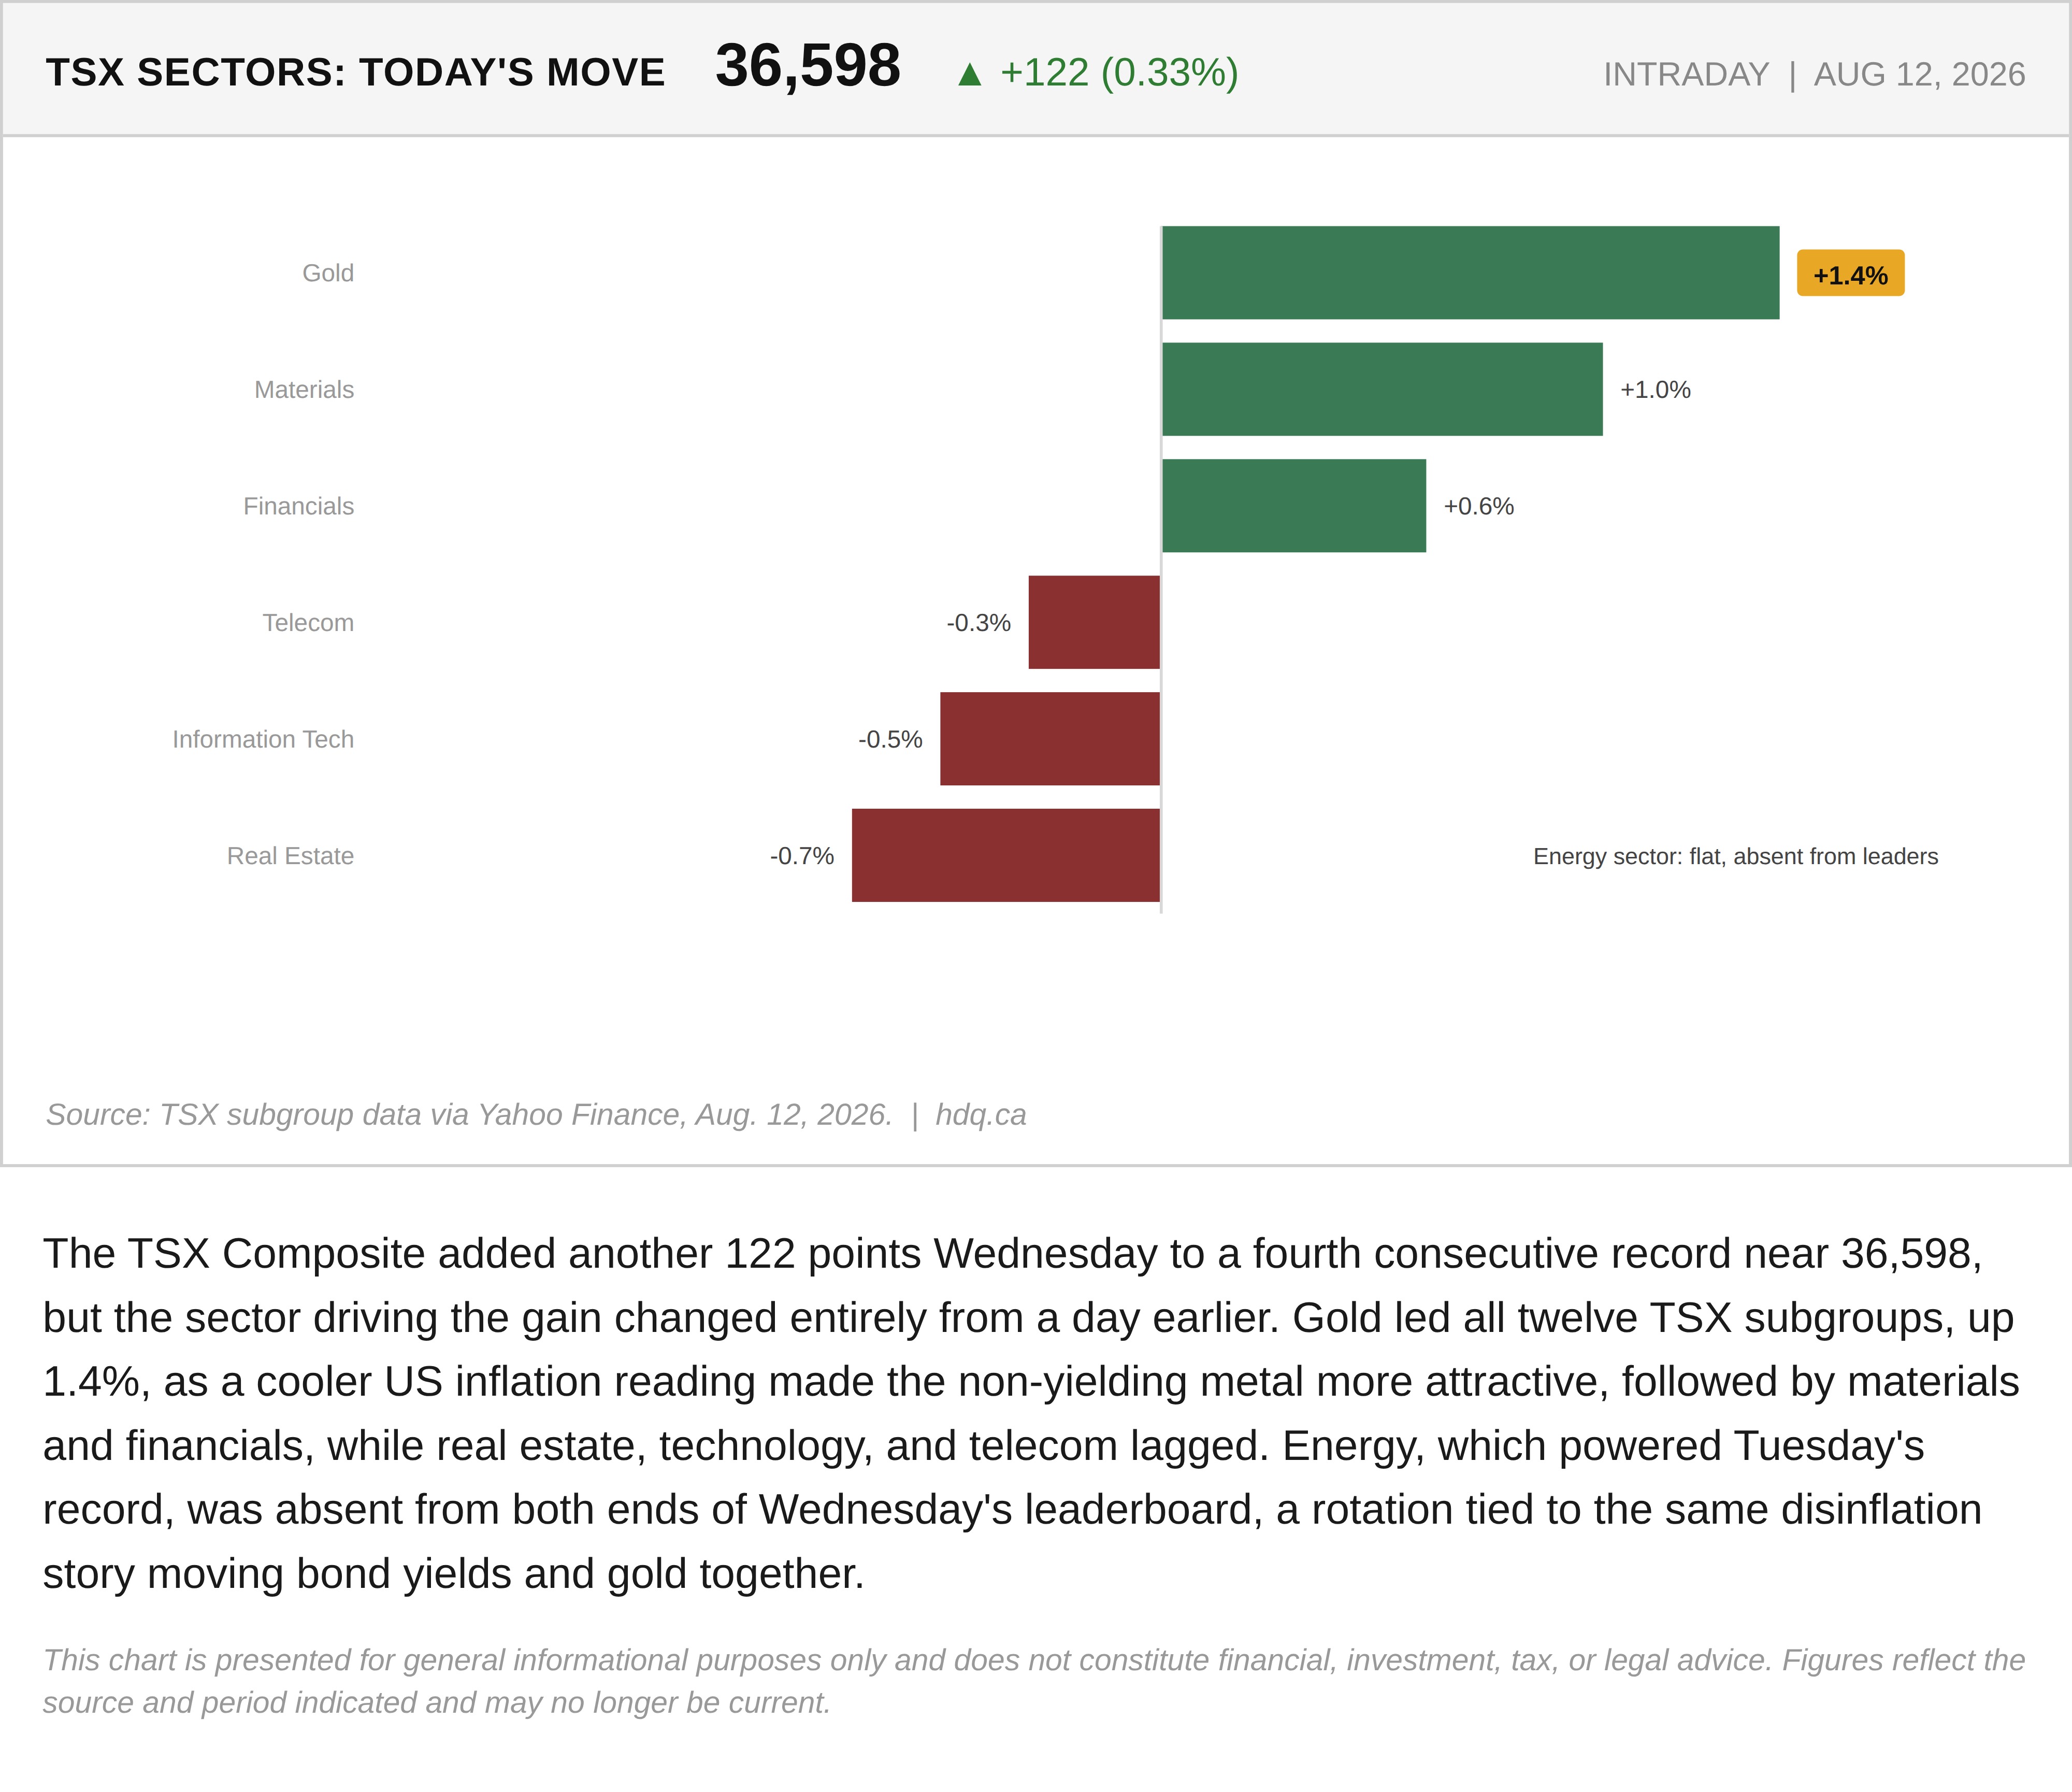
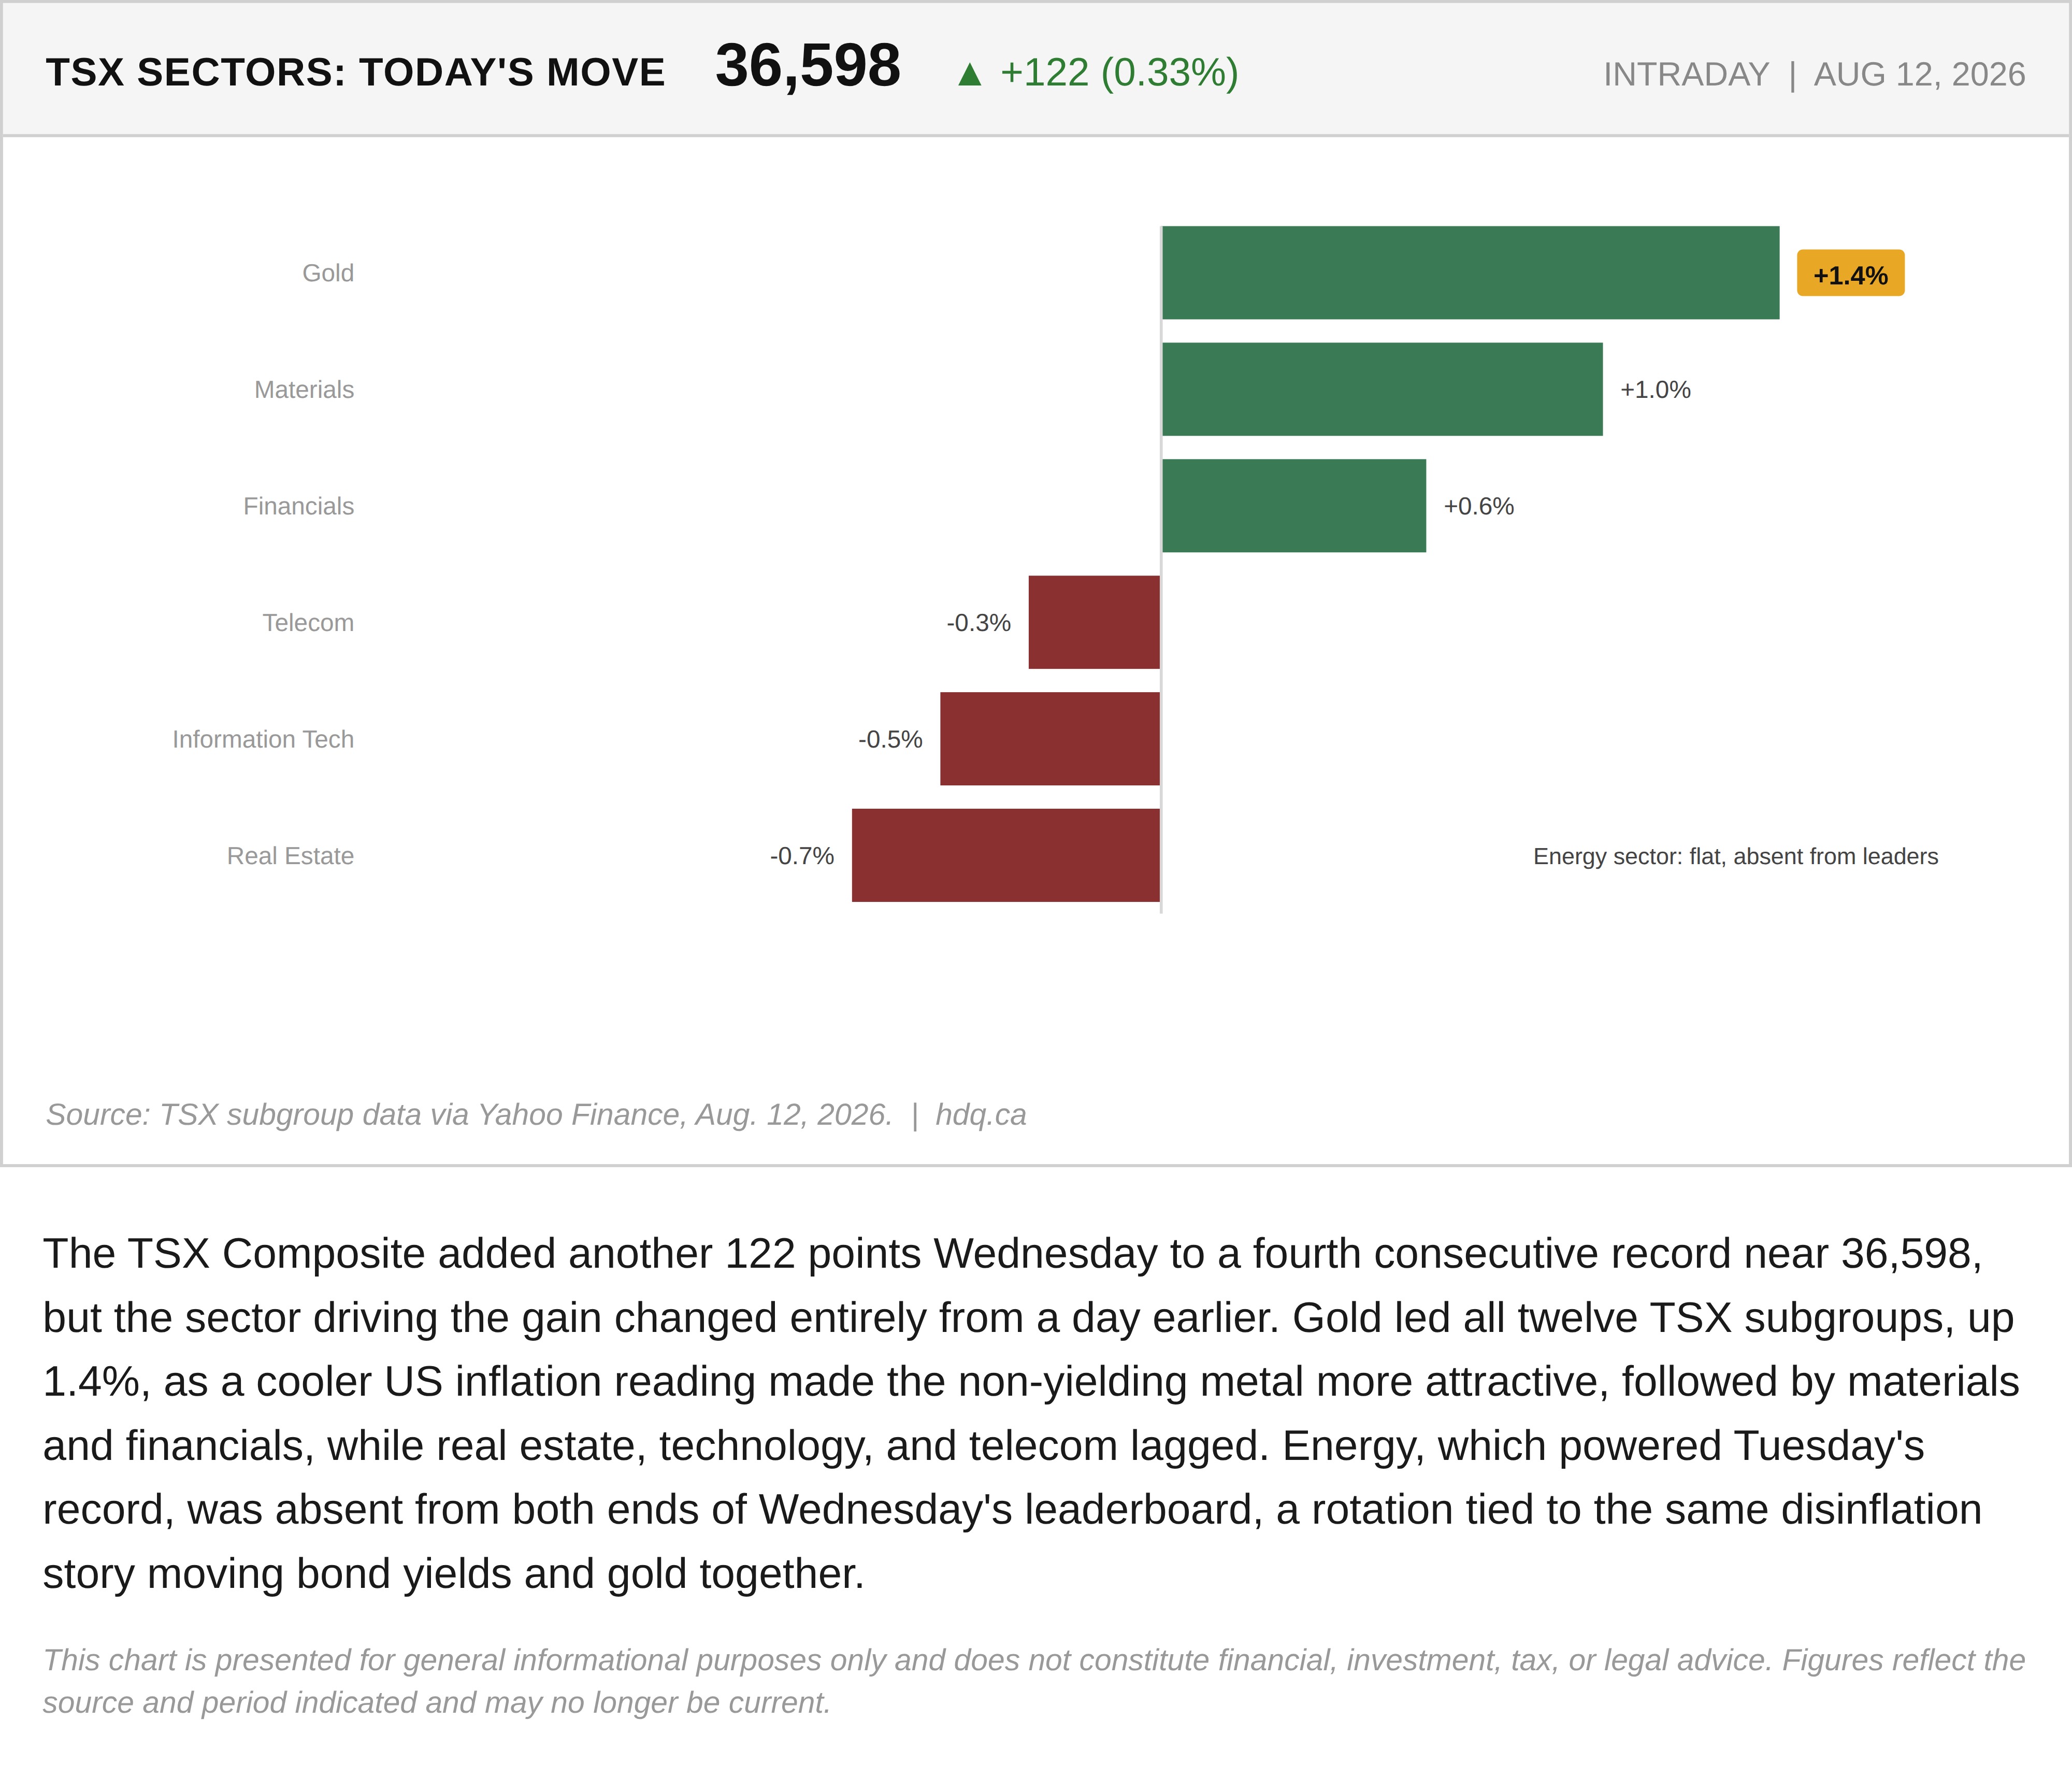
The TSX Composite added another 122 points Wednesday to a fourth consecutive record near 36,598, but the sector driving the gain changed entirely from a day earlier. Gold led all twelve TSX subgroups, up 1.4%, as a cooler US inflation reading made the non-yielding metal more attractive, followed by materials and financials, while real estate, technology, and telecom lagged. Energy, which powered Tuesday's record, was absent from both ends of Wednesday's leaderboard, a rotation tied to the same disinflation story moving bond yields and gold together.
This chart is presented for general informational purposes only and does not constitute financial, investment, tax, or legal advice. Figures reflect the source and period indicated and may no longer be current.
Related charts
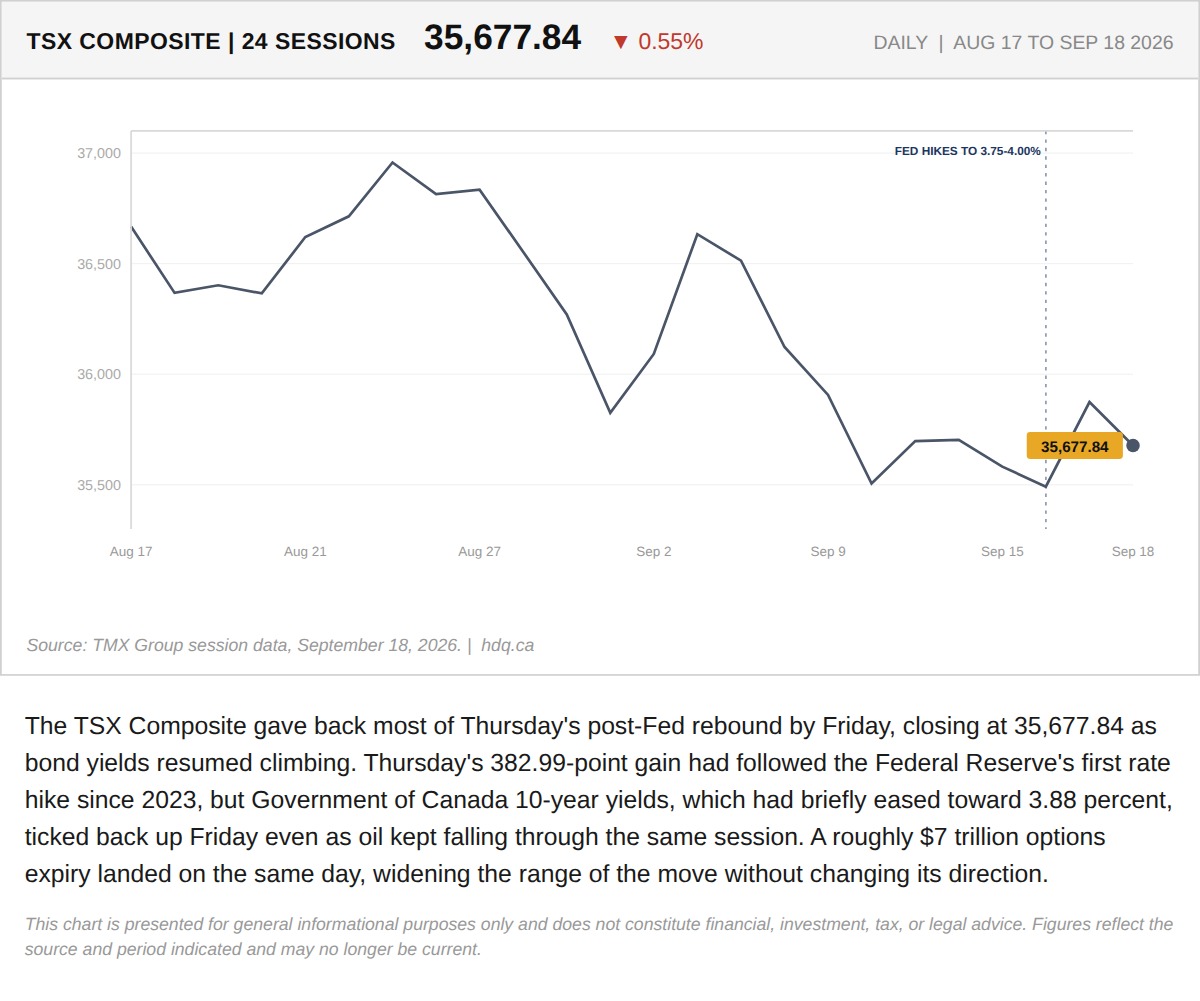
The TSX Composite gave back most of Thursday's post-Fed rebound by Friday, closing at 35,677.84 as bond yields resumed climbing.
TSX Gives Back Post-Fed Rally as Bond Yields Resume Climbing
September 18, 2026
View chart & download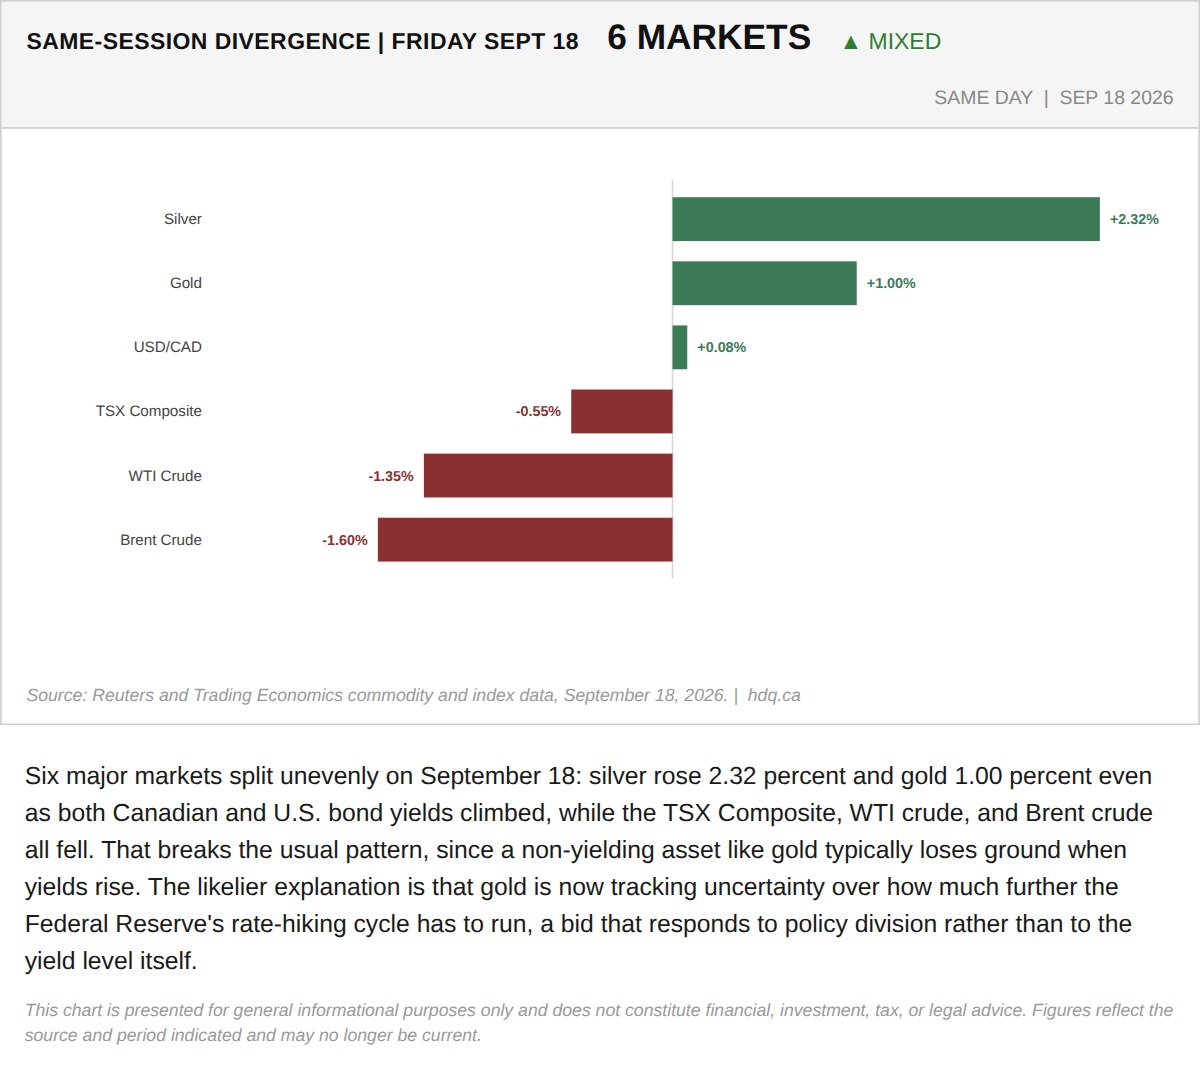
Six major markets split unevenly on September 18: silver rose 2.32 percent and gold 1.00 percent even as both Canadian and U.S.
Gold and Silver Rise With Yields, Breaking the Usual Pattern
September 18, 2026
View chart & download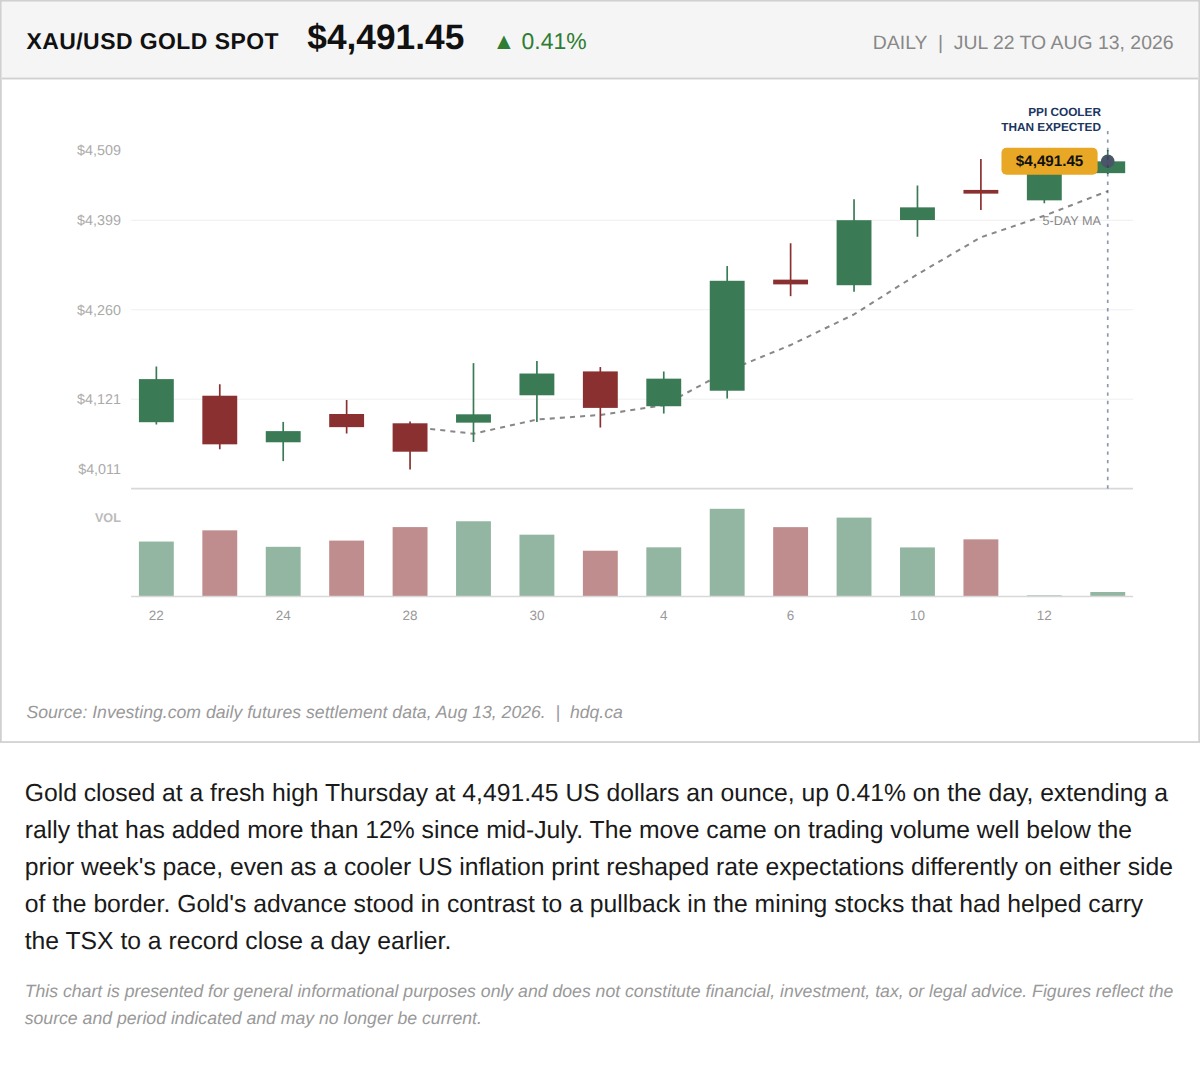
Gold closed at a fresh high Thursday at 4,491.45 US dollars an ounce, up 0.41% on the day, extending a rally that has added more than 12% since mid-July.
Gold Spot Price Hits a Fresh High on August 13, 2026
August 13, 2026
View chart & download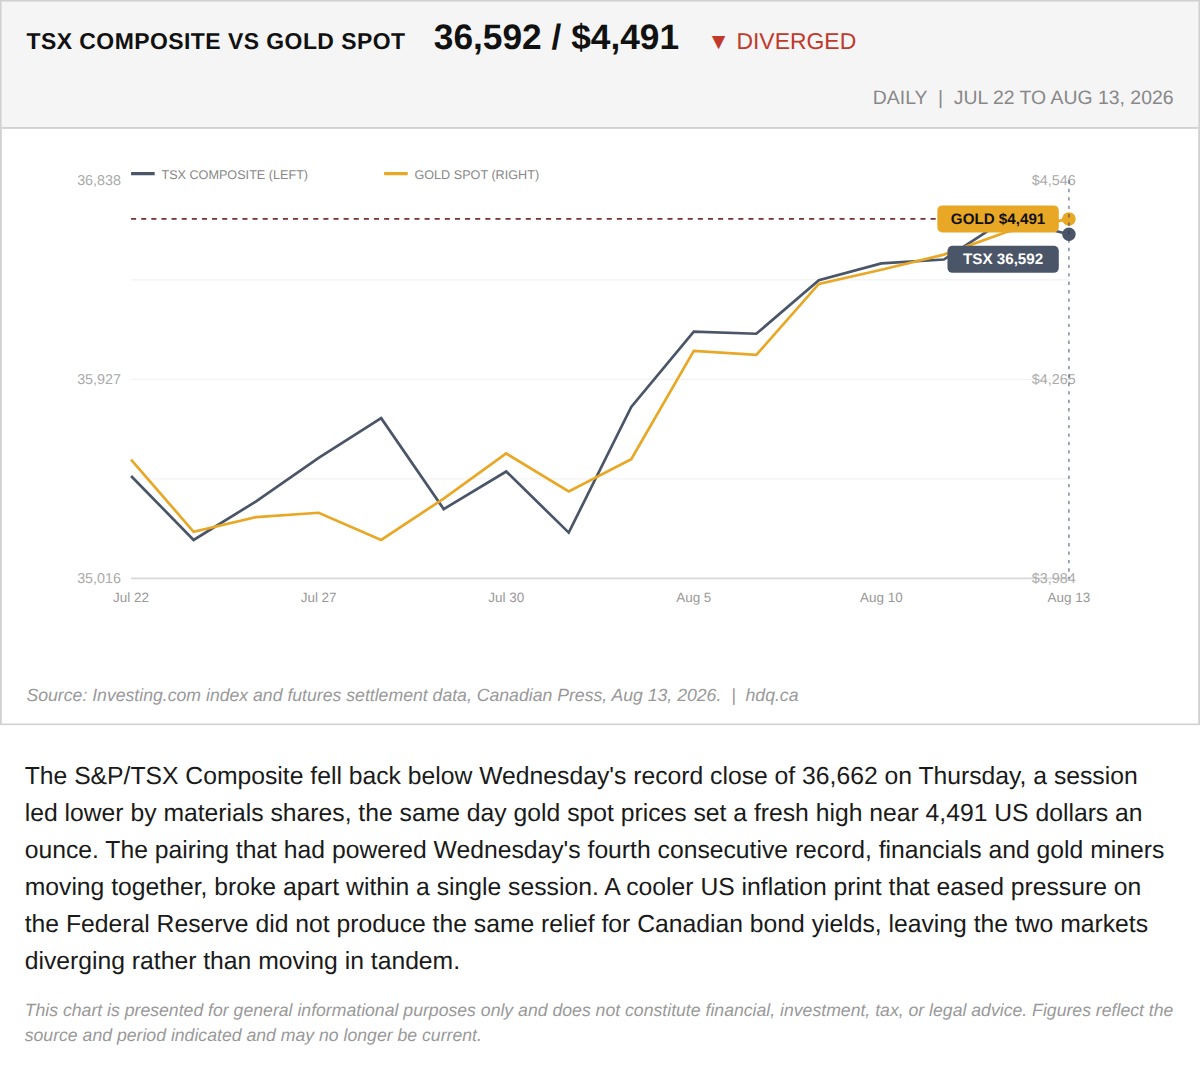
The S&P/TSX Composite fell back below Wednesday's record close of 36,662 on Thursday, a session led lower by materials shares, the same day…
TSX Composite and Gold Spot Diverge After Wednesday's Record
August 13, 2026
View chart & download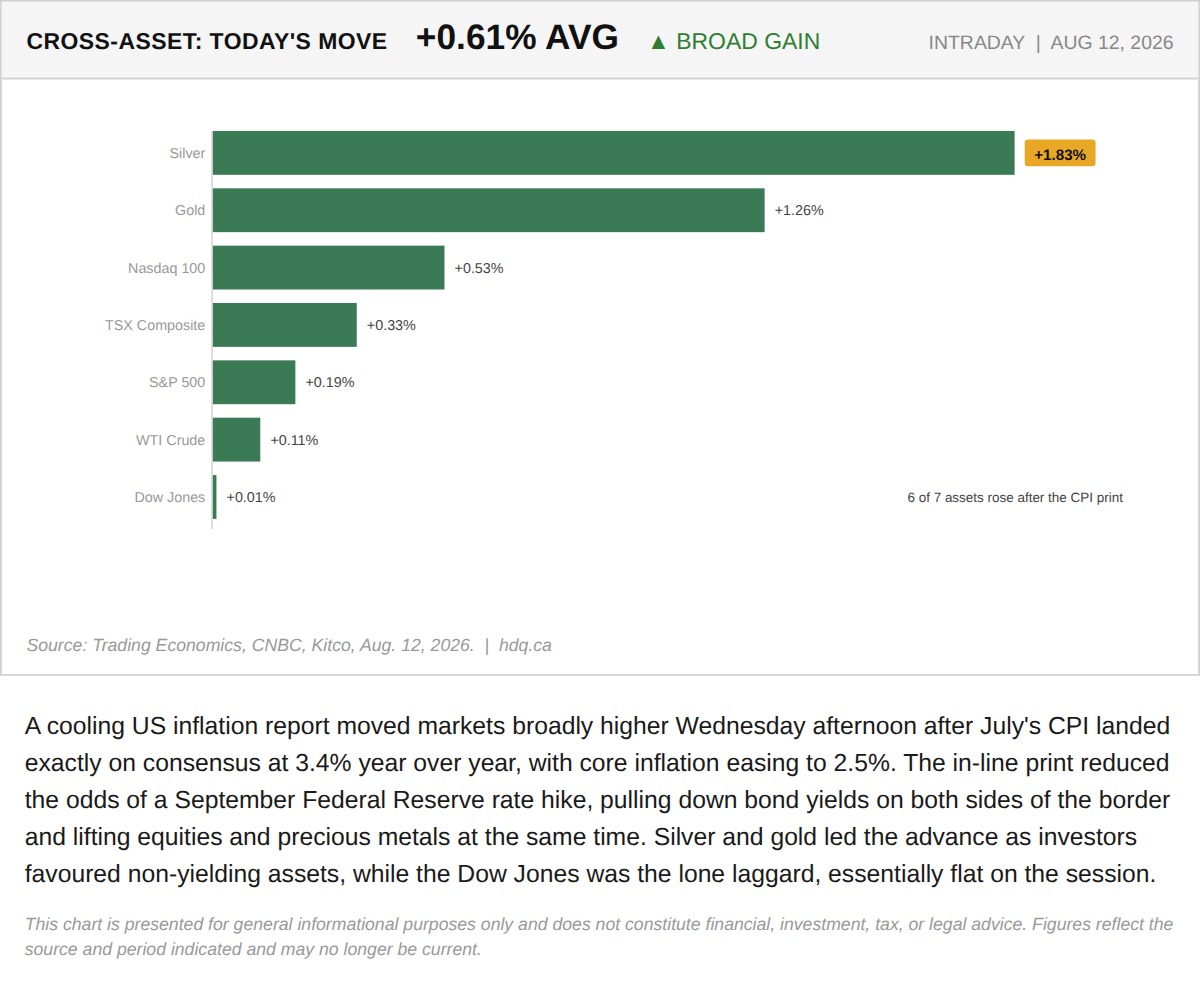
A cooling US inflation report moved markets broadly higher Wednesday afternoon after July's CPI landed exactly on consensus at 3.4% year…
August 12, 2026
View chart & download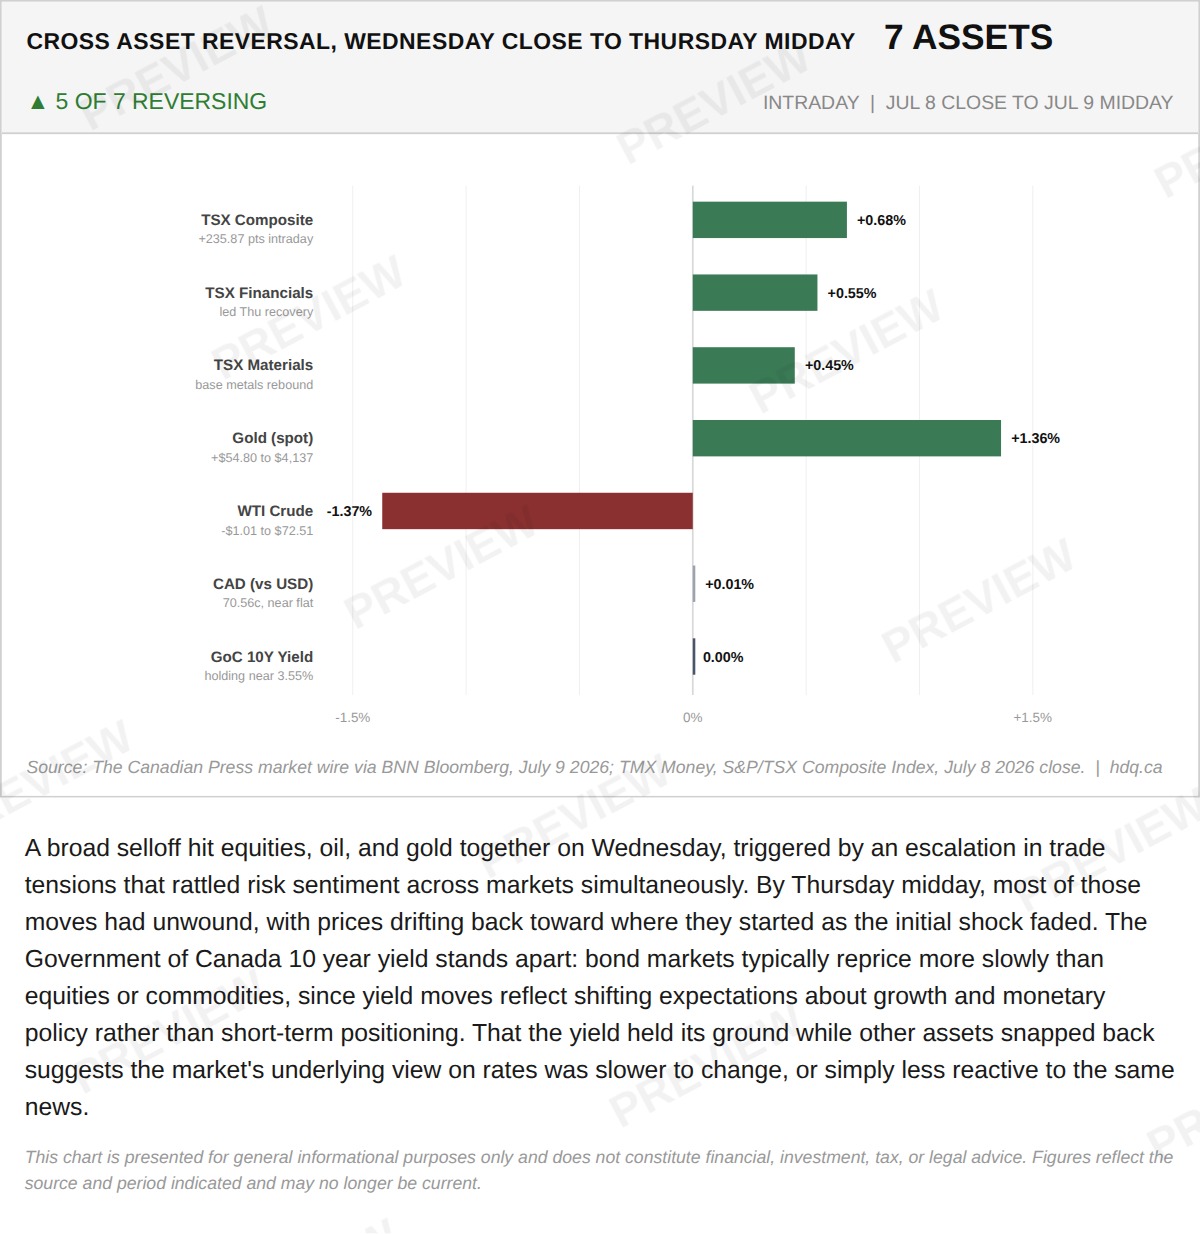
A broad selloff hit equities, oil, and gold together on Wednesday, triggered by an escalation in trade tensions that rattled risk sentiment across markets simultaneously.
The TSX Round Tripped in Two Days. The Bond Market Did Not.
July 9, 2026
View chart & download