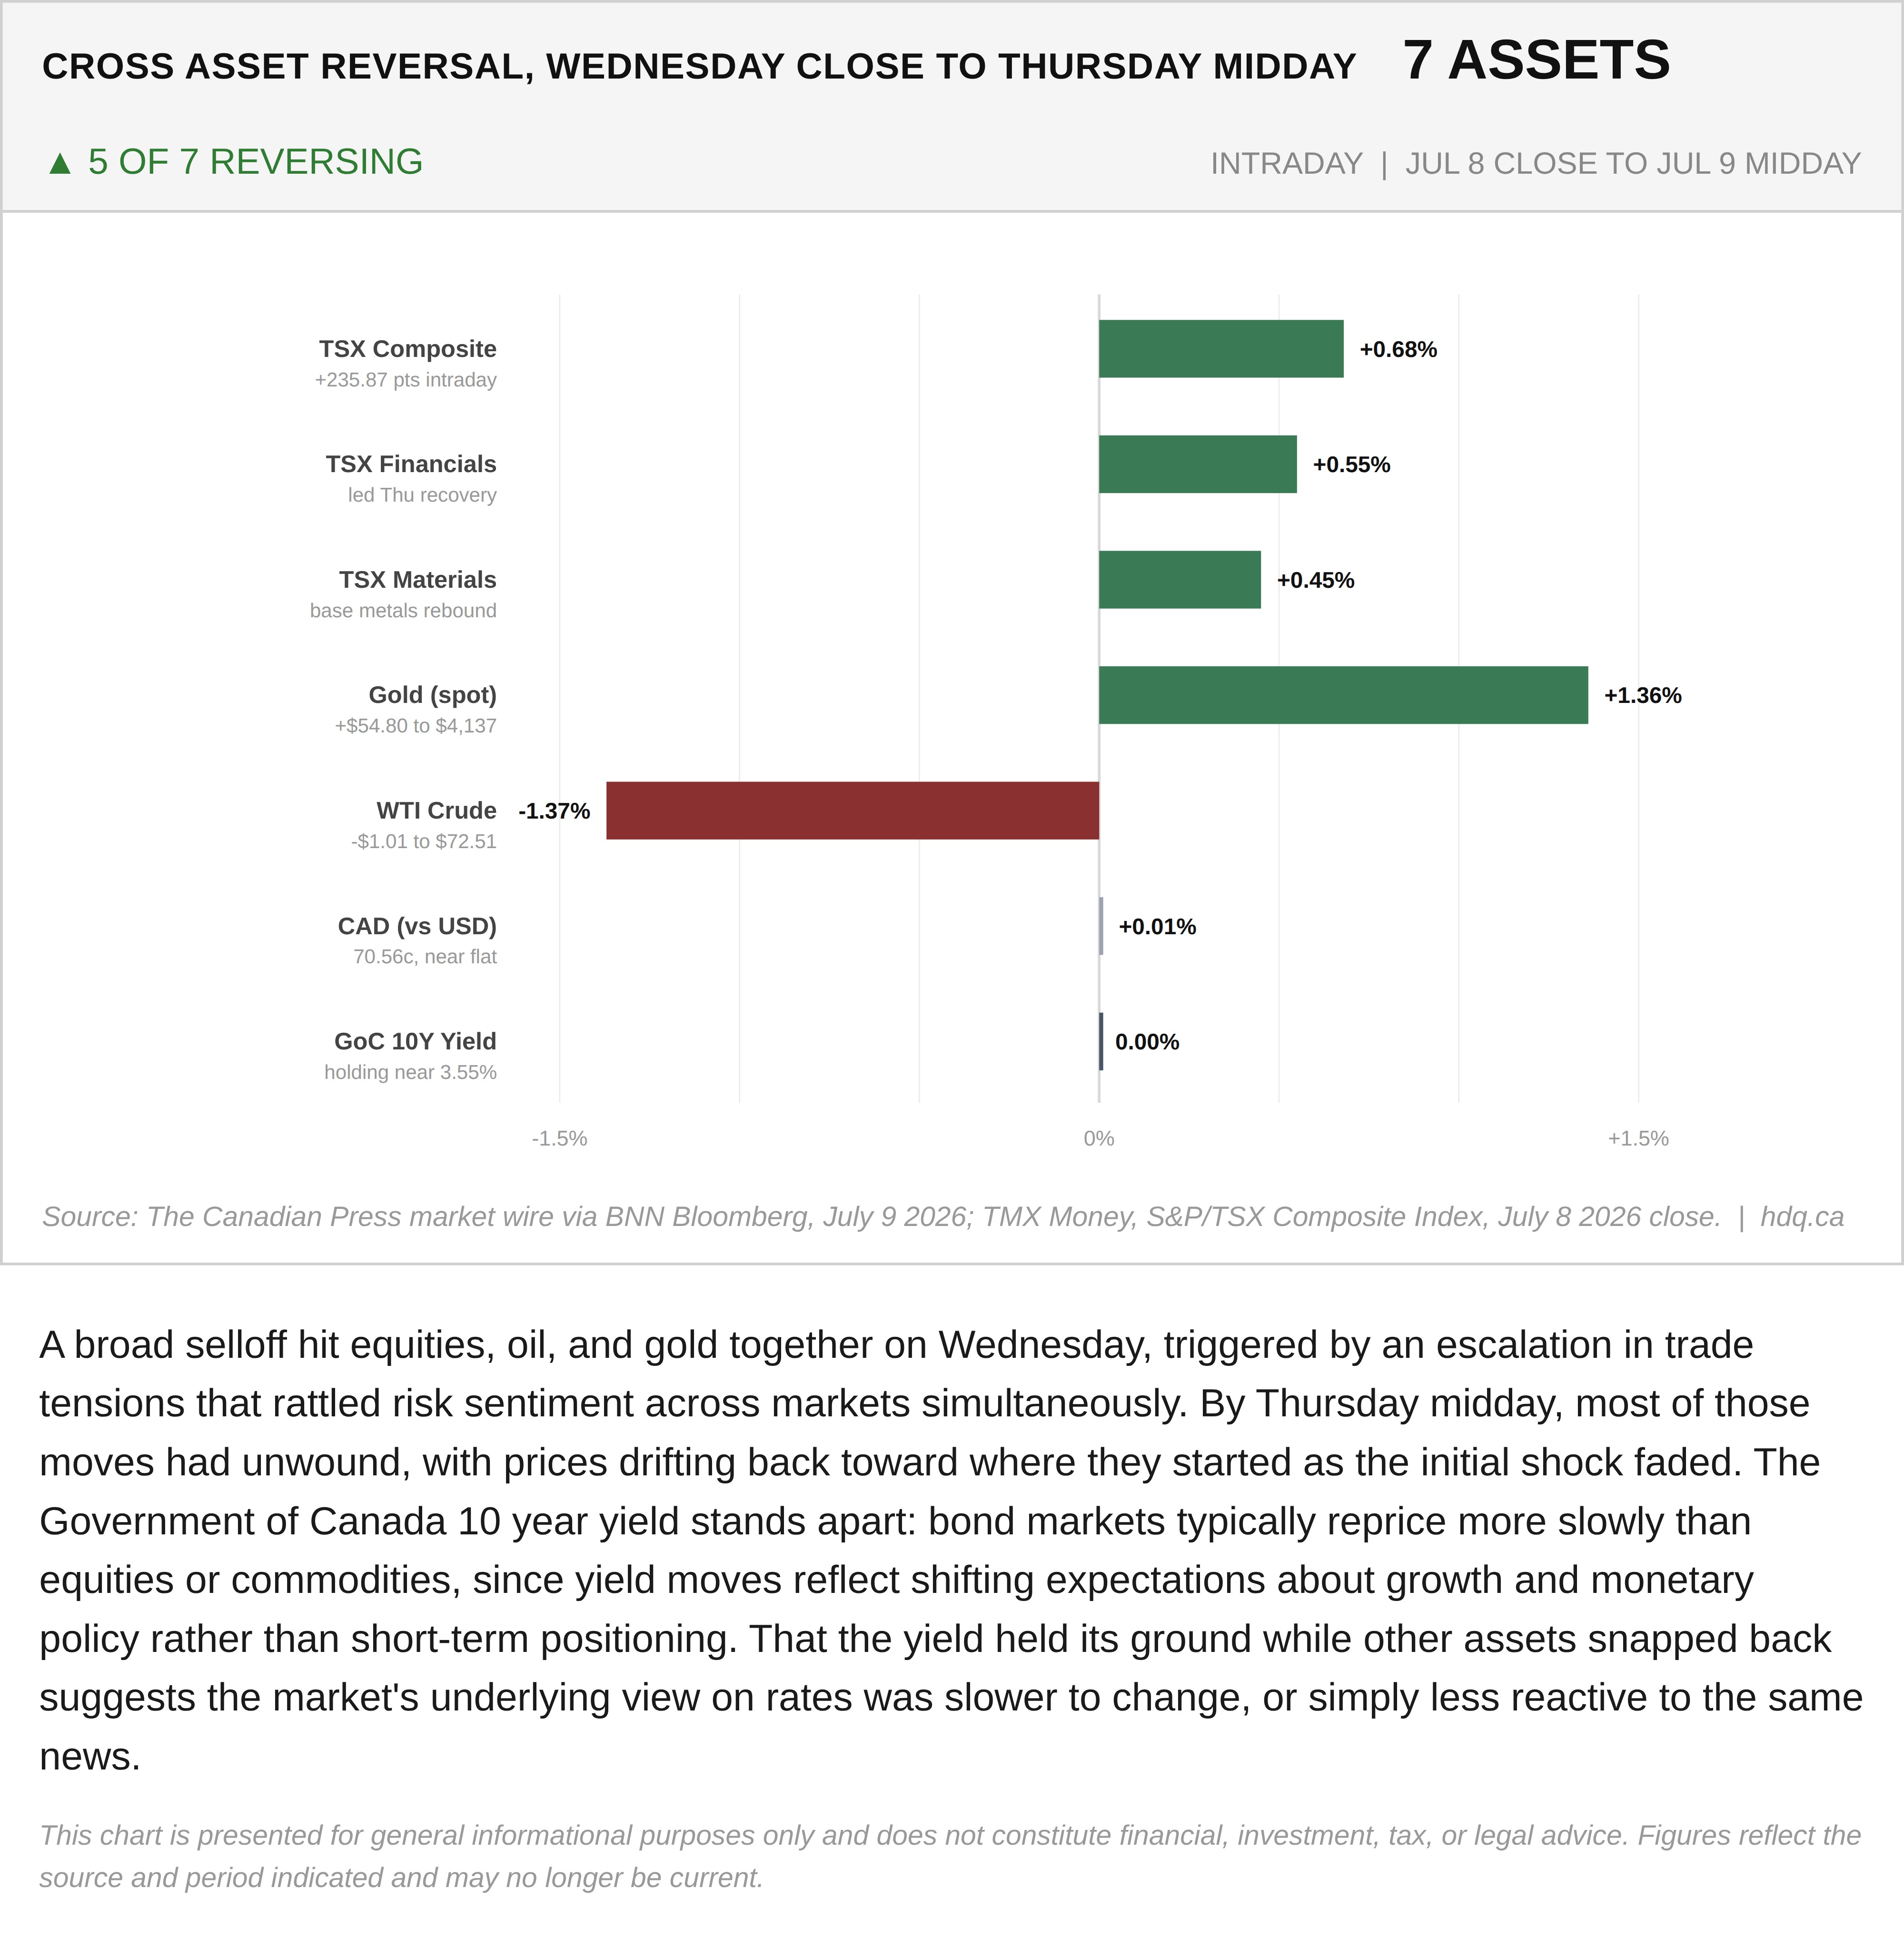
A broad selloff hit equities, oil, and gold together on Wednesday, triggered by an escalation in trade tensions that rattled risk sentiment across markets simultaneously. By Thursday midday, most of those moves had unwound, with prices drifting back toward where they started as the initial shock faded. The Government of Canada 10 year yield stands apart: bond markets typically reprice more slowly than equities or commodities, since yield moves reflect shifting expectations about growth and monetary policy rather than short-term positioning. That the yield held its ground while other assets snapped back suggests the market's underlying view on rates was slower to change, or simply less reactive to the same news.
This chart is presented for general informational purposes only and does not constitute financial, investment, tax, or legal advice. Figures reflect the source and period indicated and may no longer be current.

Related charts
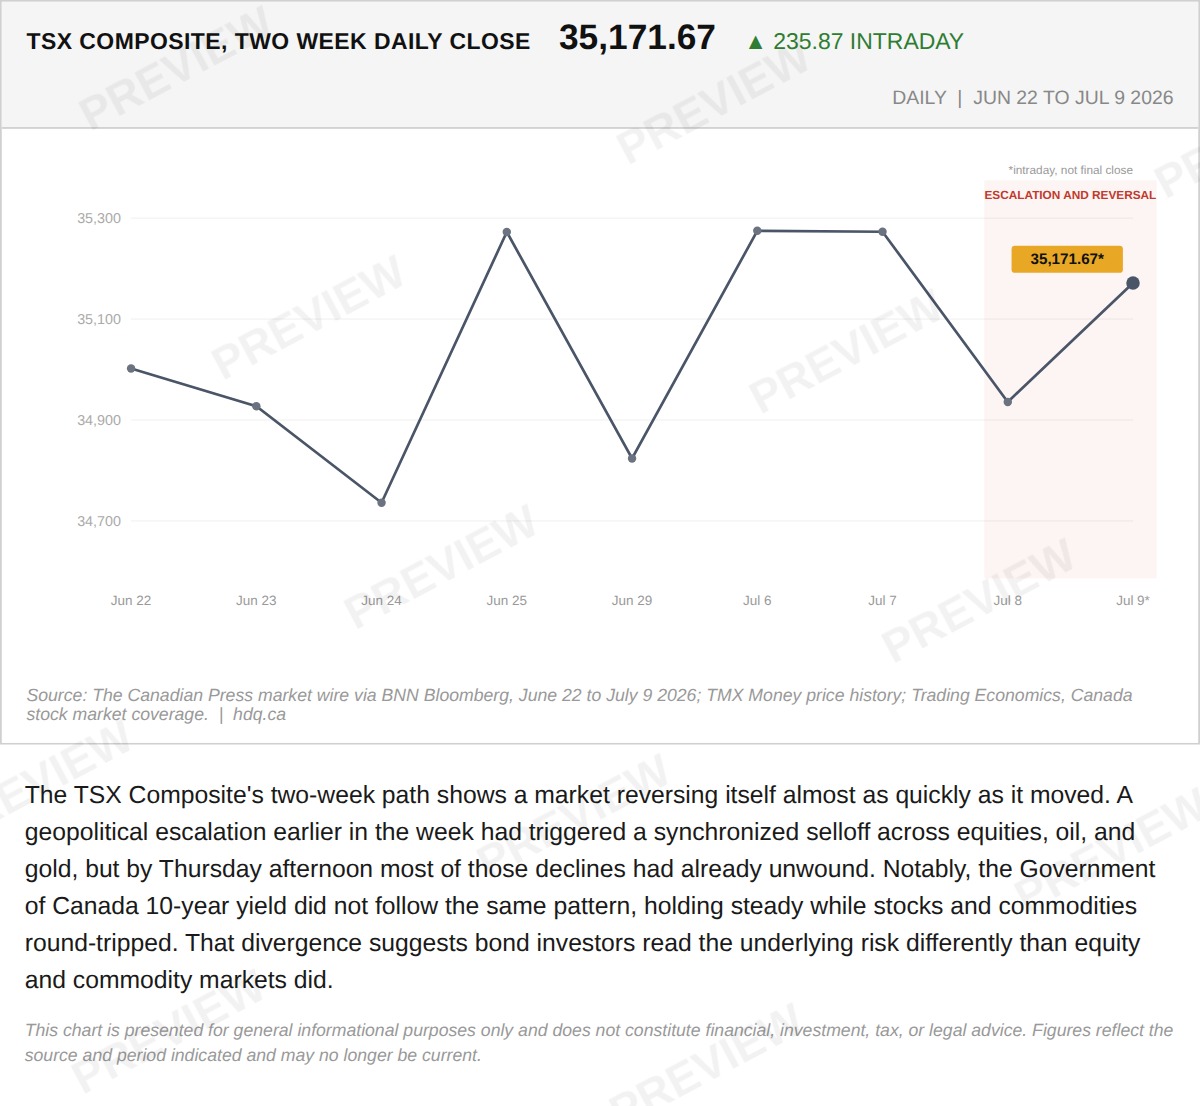
The TSX Composite's two-week path shows a market reversing itself almost as quickly as it moved.
The TSX Round Tripped in Two Days. The Bond Market Did Not.
July 9, 2026
View chart & download
Brent was the only one of the three to finish above its starting level, while the index and gold both fell.
Brent, TSX and Gold Rebased to the August 31 Close
September 30, 2026
View chart & download
The Bank of Canada held its policy rate at 2.25% for a seventh straight time, yet Canadian yields rose as United States yields surged.
Government of Canada Benchmark Yields, September 2026
September 30, 2026
View chart & download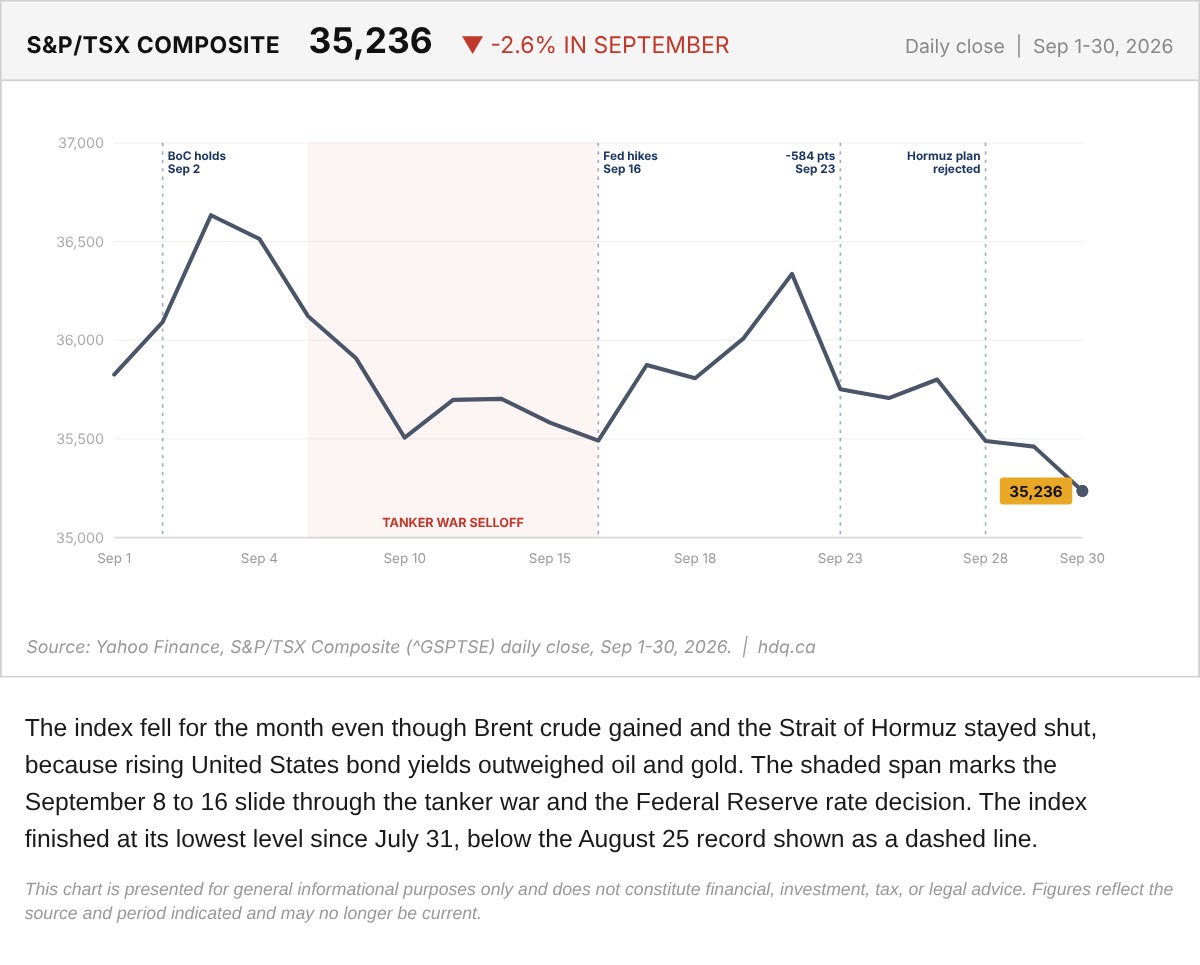
The index fell for the month even though Brent crude gained and the Strait of Hormuz stayed shut, because rising United States bond yields outweighed oil and gold.
S&P/TSX Composite Daily Close Through September 2026
September 30, 2026
View chart & download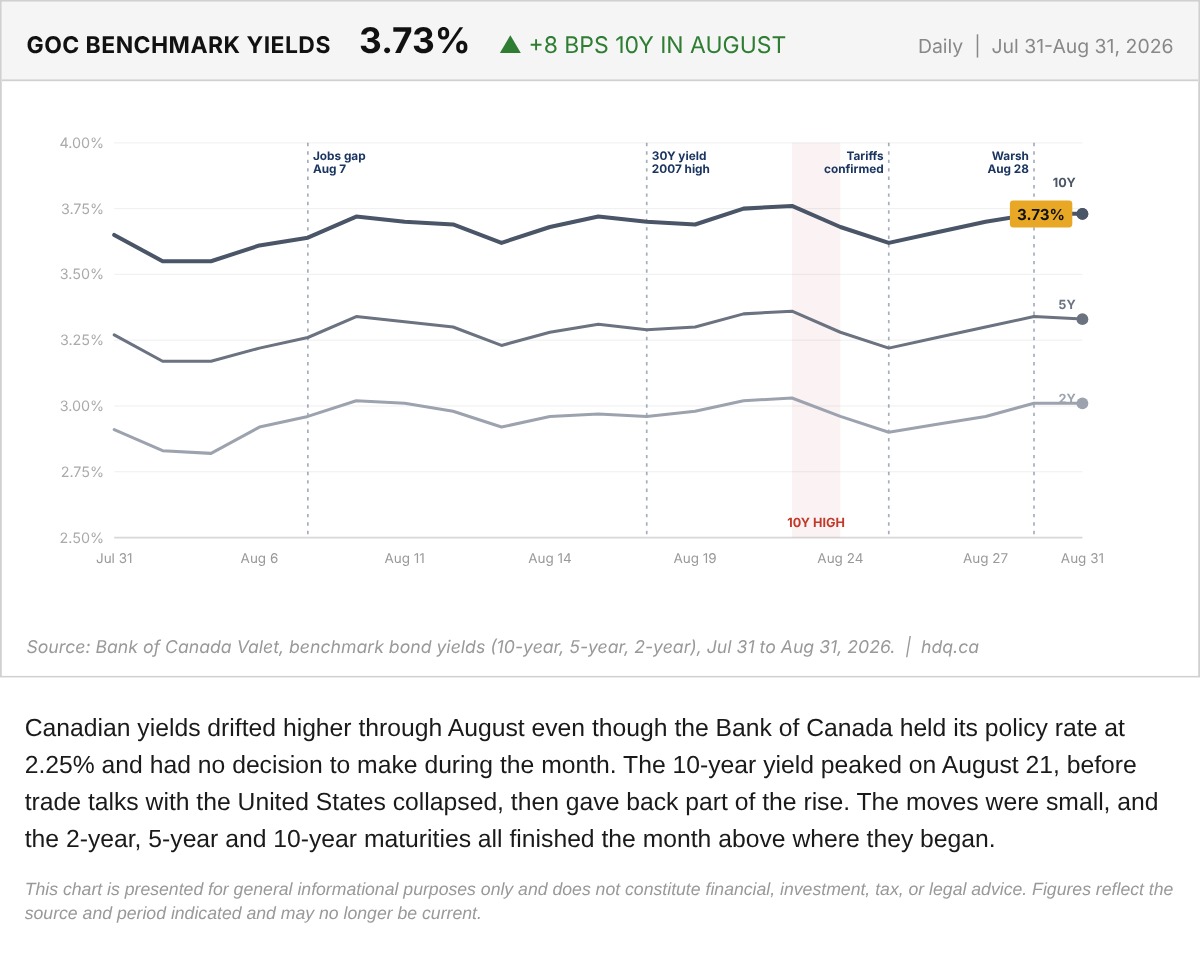
Canadian yields drifted higher through August even though the Bank of Canada held its policy rate at 2.25% and had no decision to make during the month.
Government of Canada Benchmark Yields, August 2026
August 31, 2026
View chart & download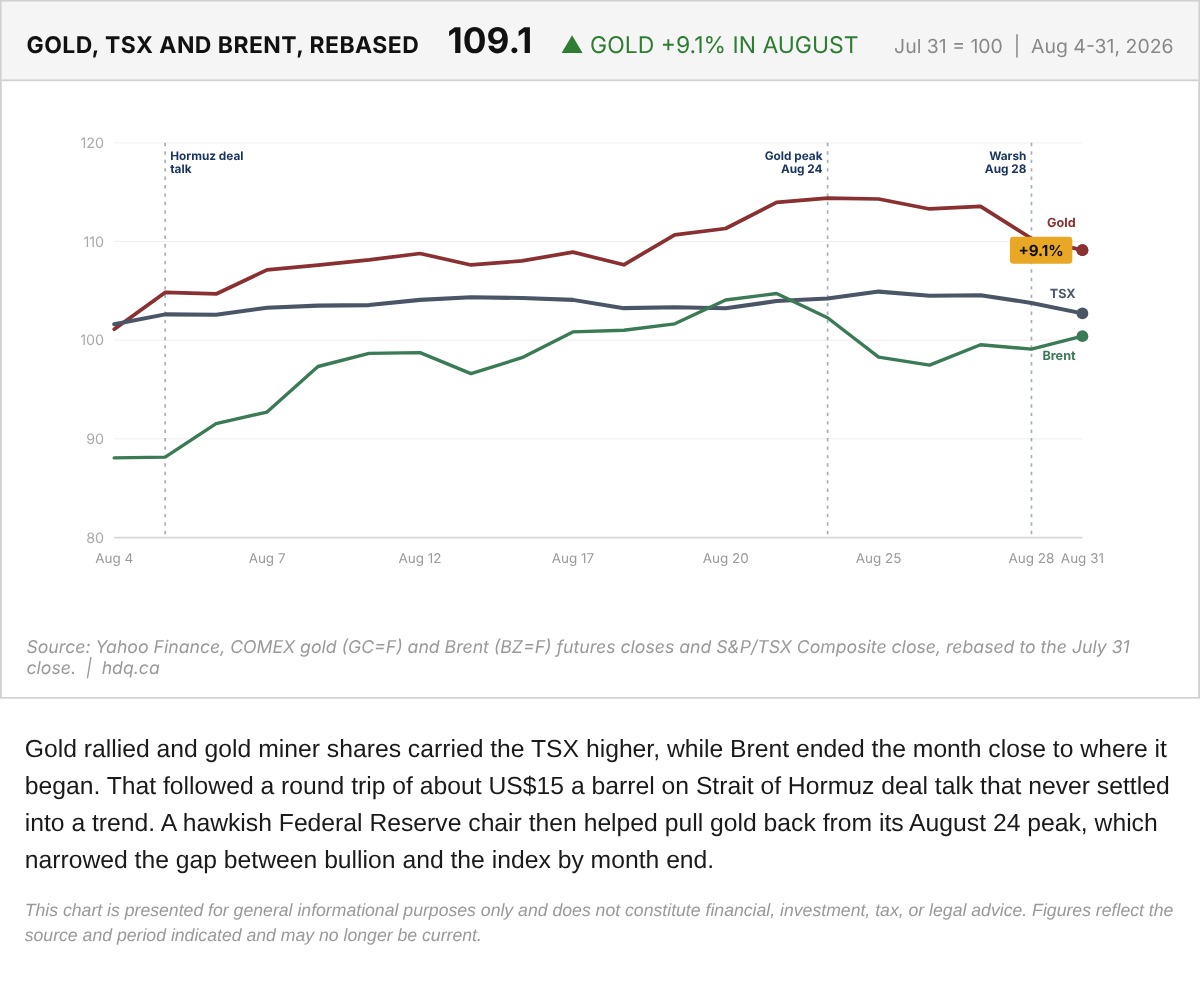
Gold rallied and gold miner shares carried the TSX higher, while Brent ended the month close to where it began.
Gold, TSX and Brent Rebased to the July 31 Close
August 31, 2026
View chart & download