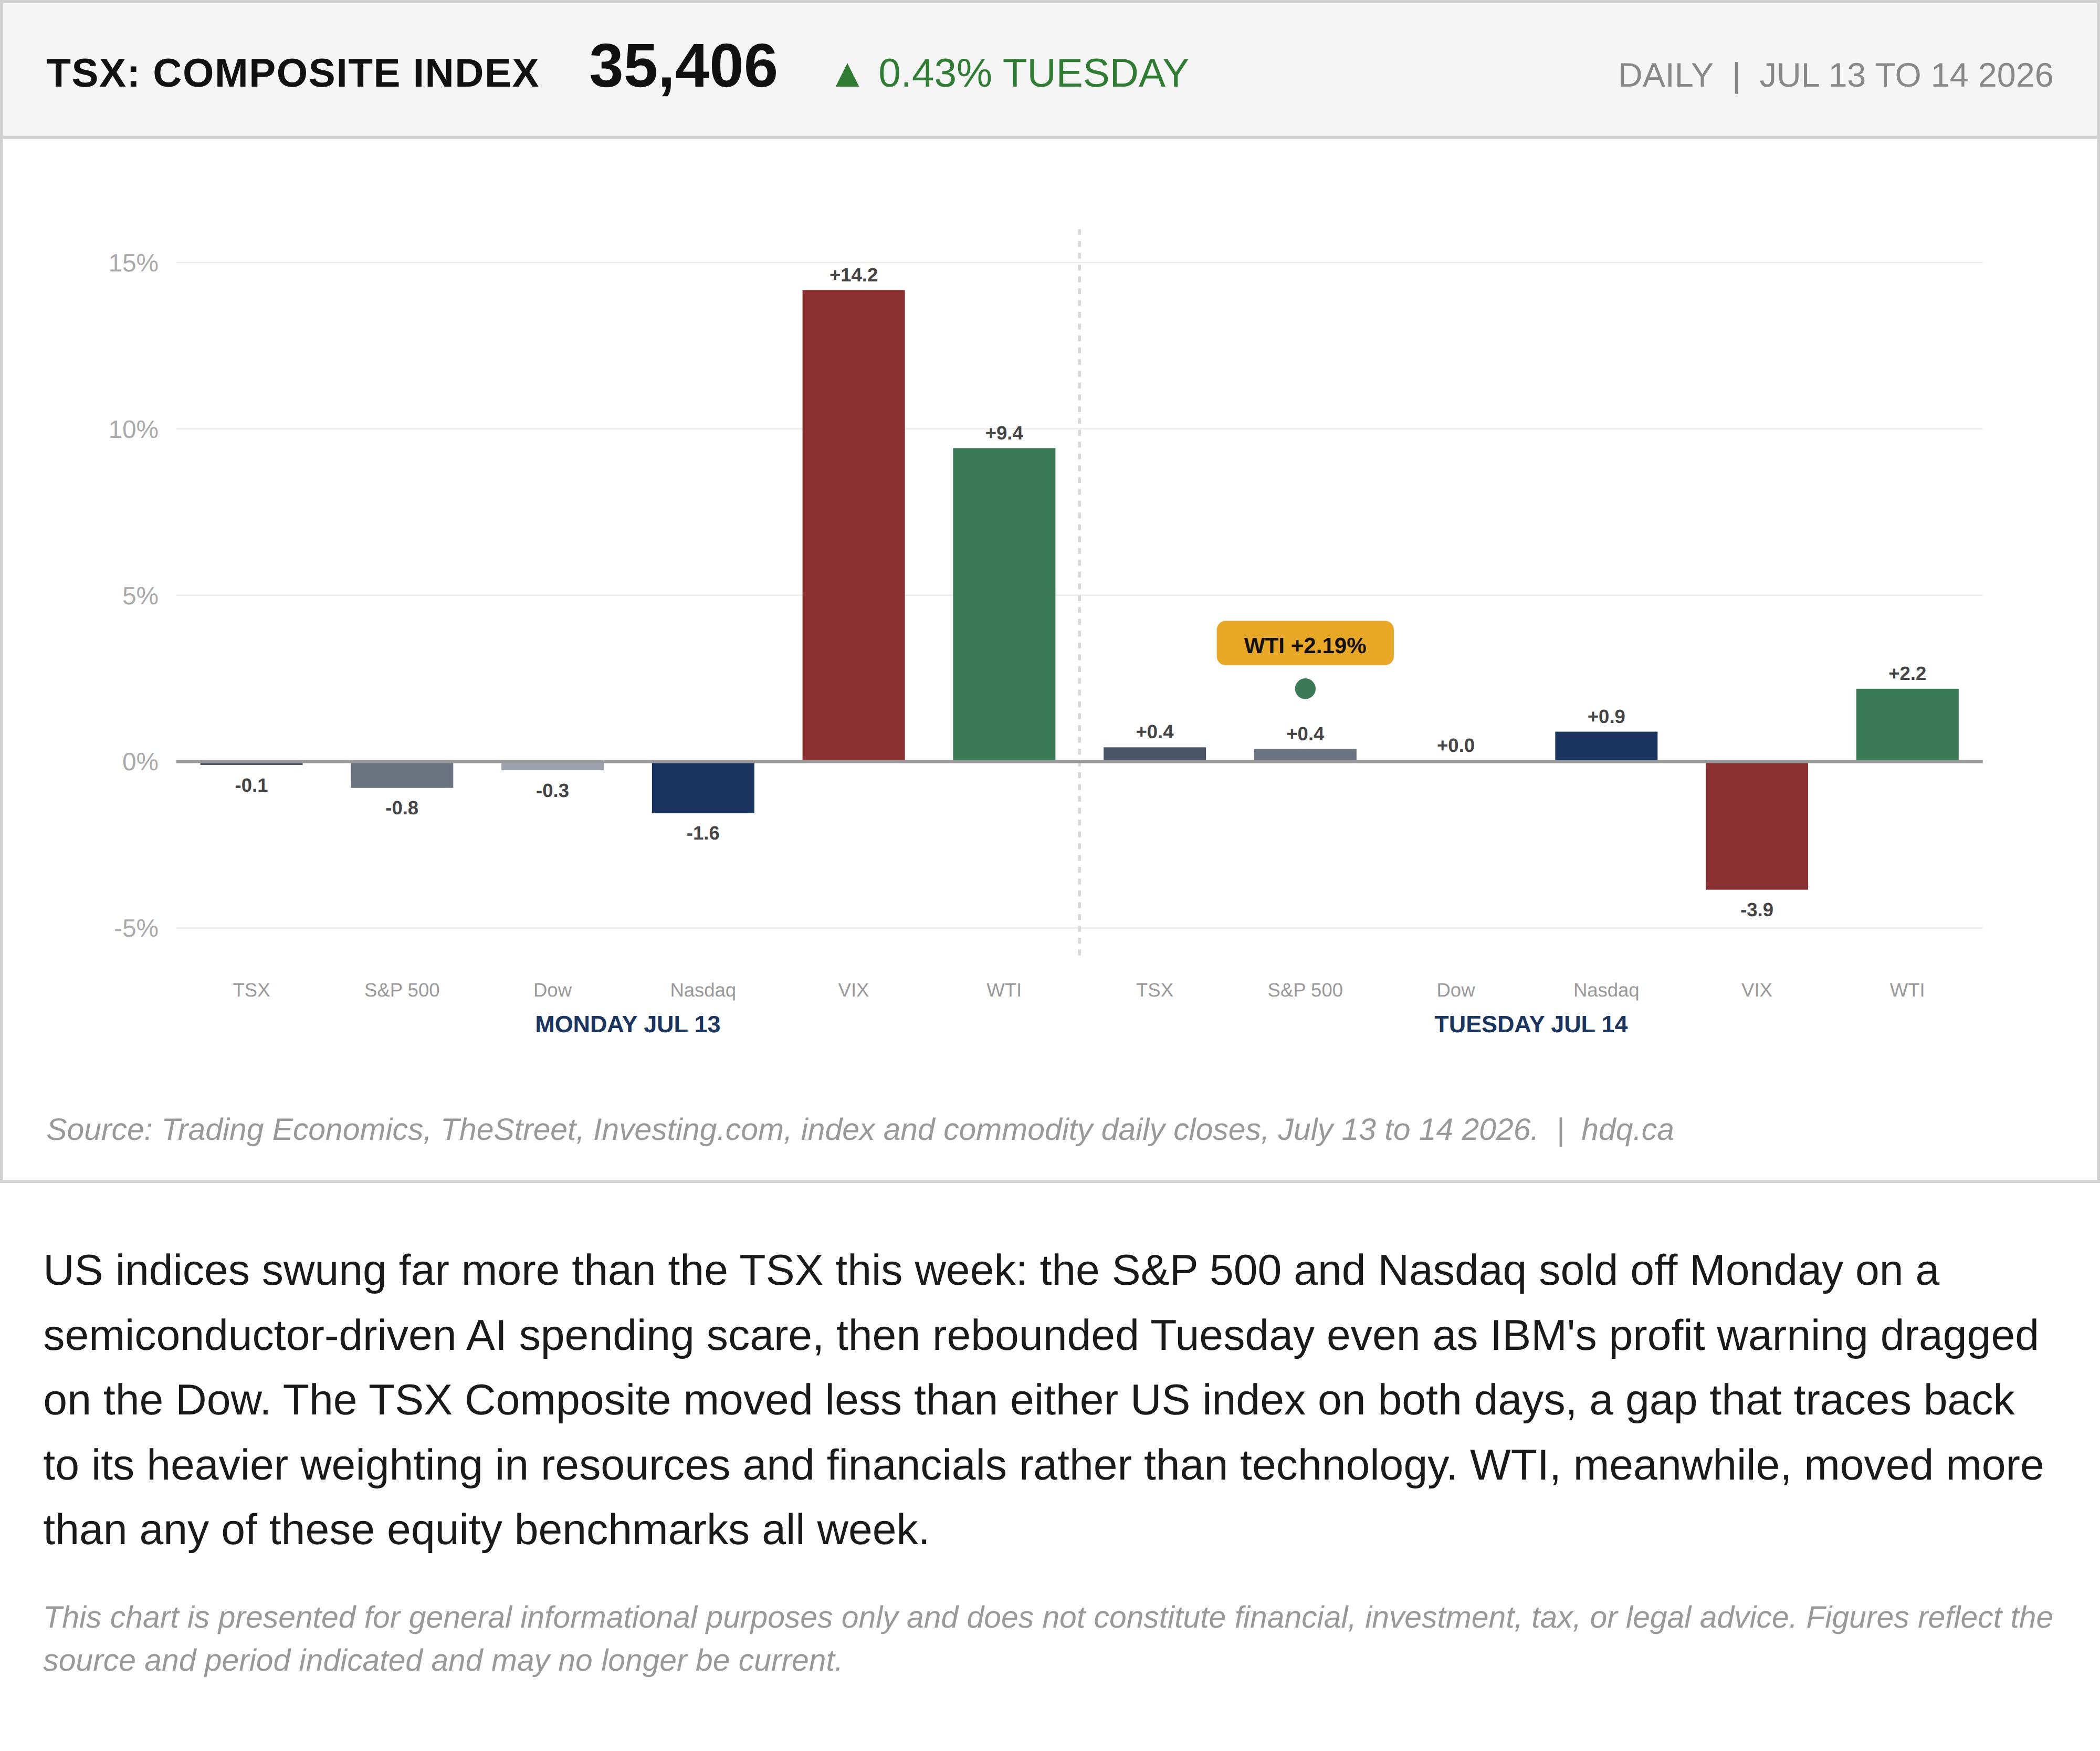
US indices swung far more than the TSX this week: the S&P 500 and Nasdaq sold off Monday on a semiconductor-driven AI spending scare, then rebounded Tuesday even as IBM's profit warning dragged on the Dow. The TSX Composite moved less than either US index on both days, a gap that traces back to its heavier weighting in resources and financials rather than technology. WTI, meanwhile, moved more than any of these equity benchmarks all week.
This chart is presented for general informational purposes only and does not constitute financial, investment, tax, or legal advice. Figures reflect the source and period indicated and may no longer be current.

Related charts
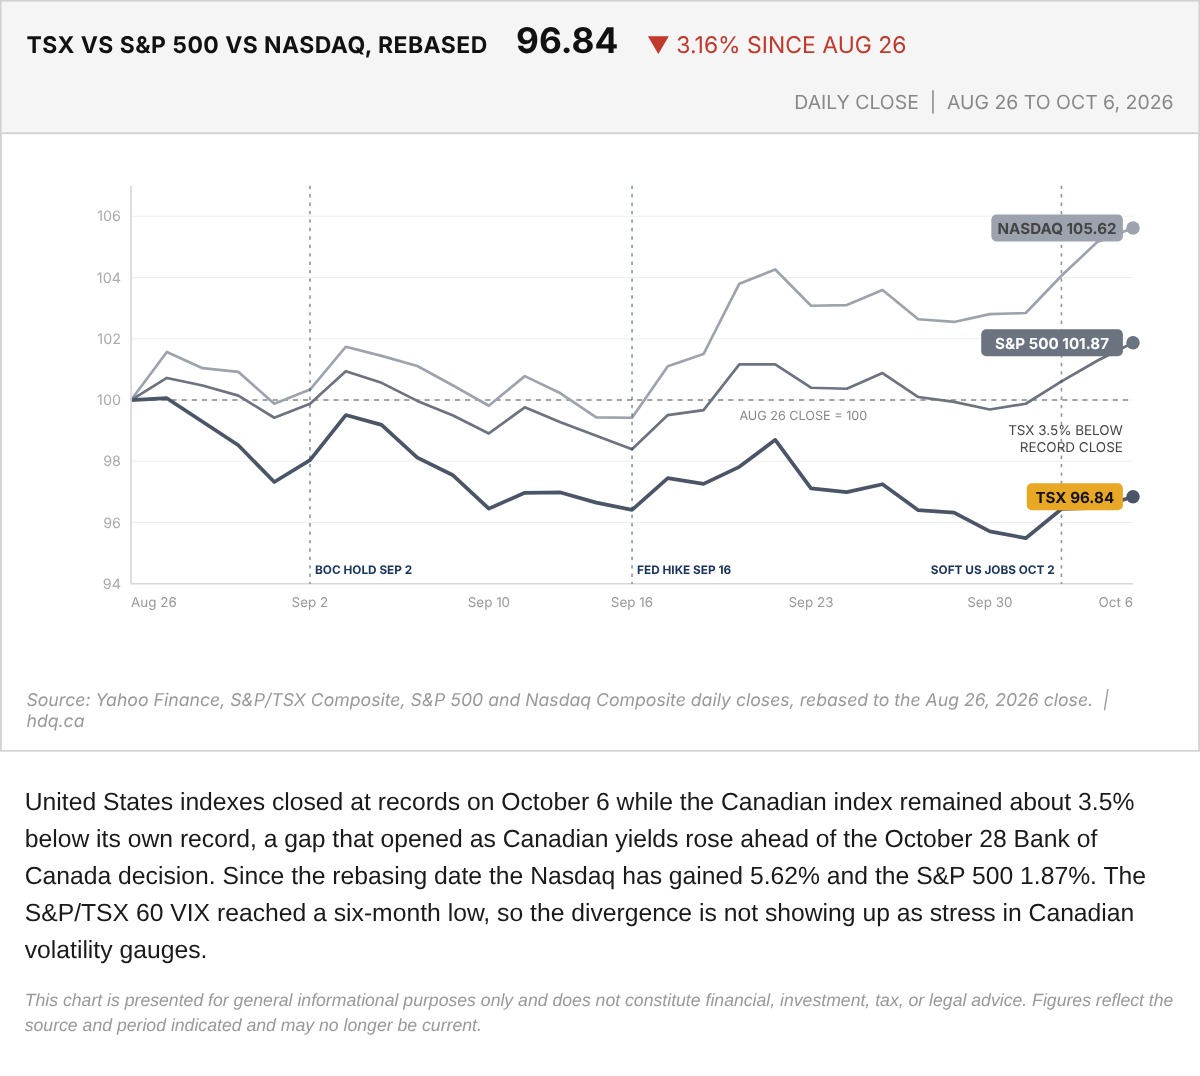
United States indexes closed at records on October 6 while the Canadian index remained about 3.5% below its own record, a gap that opened…
TSX, S&P 500 and Nasdaq Rebased to the August 26 Close
October 7, 2026
View chart & download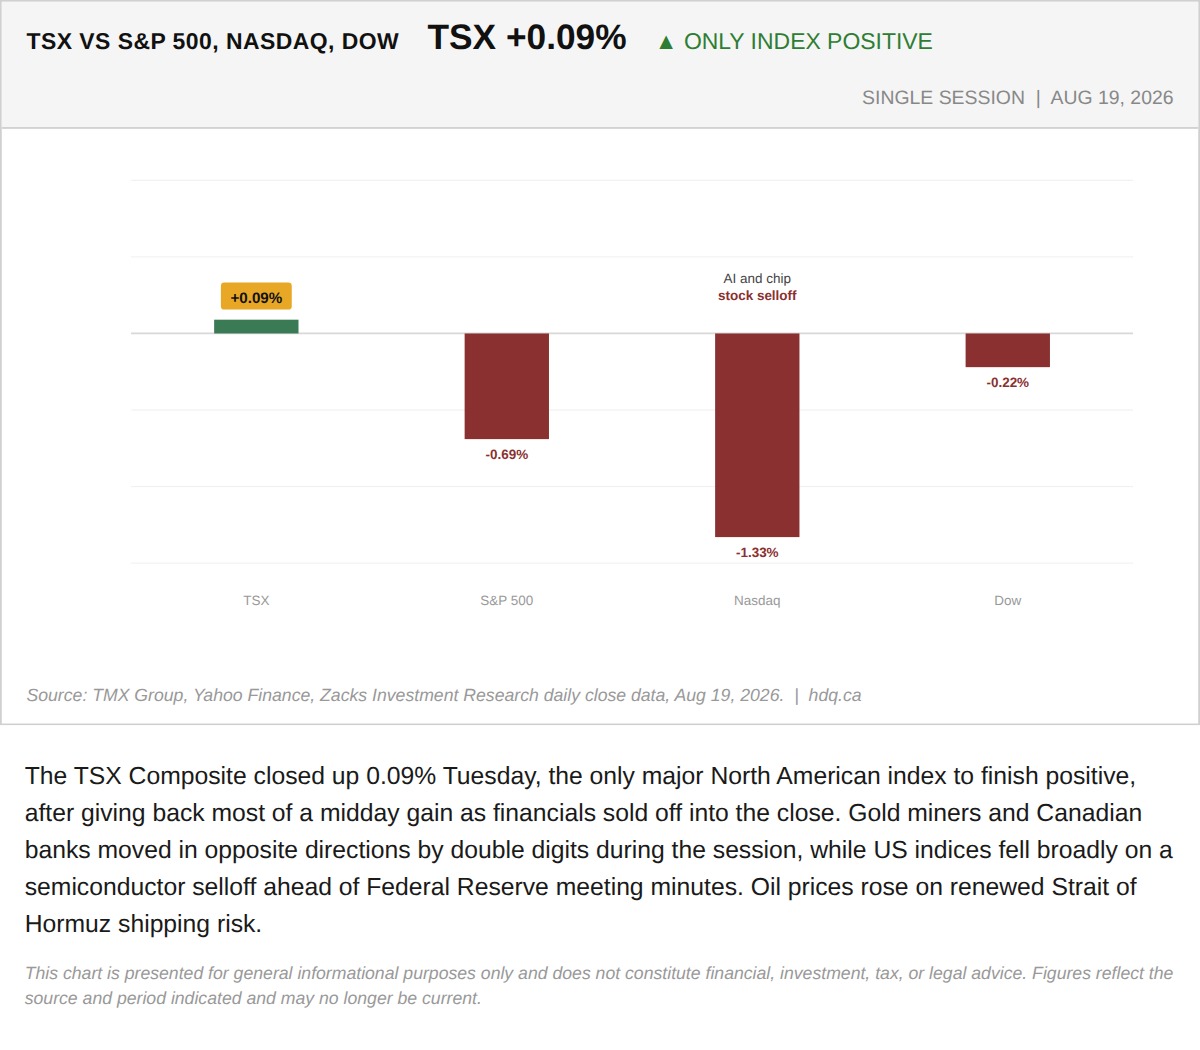
The TSX Composite closed up 0.09% Tuesday, the only major North American index to finish positive, after giving back most of a midday gain as financials sold off into the close.
The TSX Gave Back a 127-Point Tariff Rally as Financials Sold Off Into the Close
August 19, 2026
View chart & download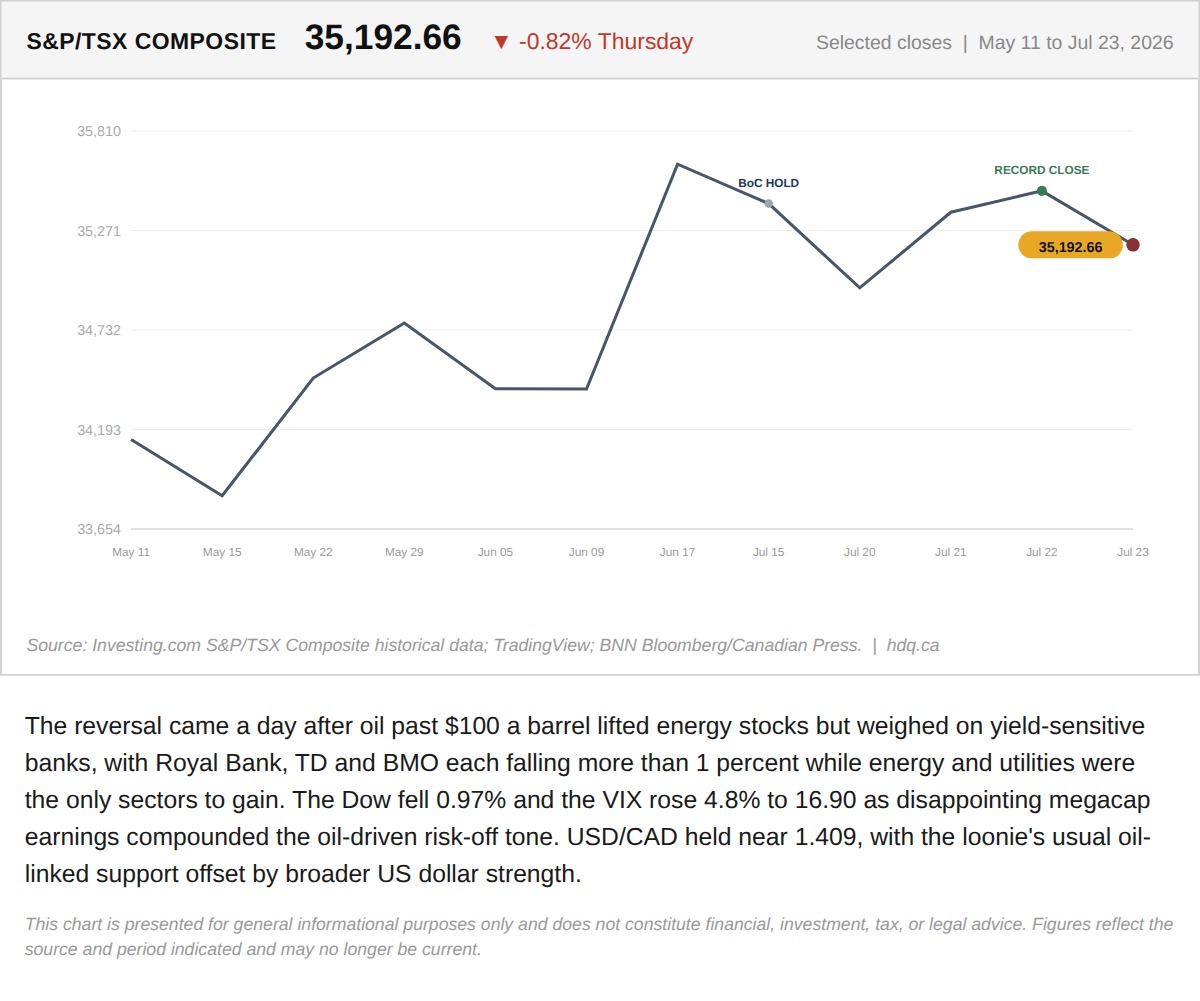
The reversal came a day after oil past $100 a barrel lifted energy stocks but weighed on yield-sensitive banks, with Royal Bank, TD and BMO…
Record High, Then a Bank-Led Reversal: Inside Thursday's TSX Split
July 24, 2026
View chart & download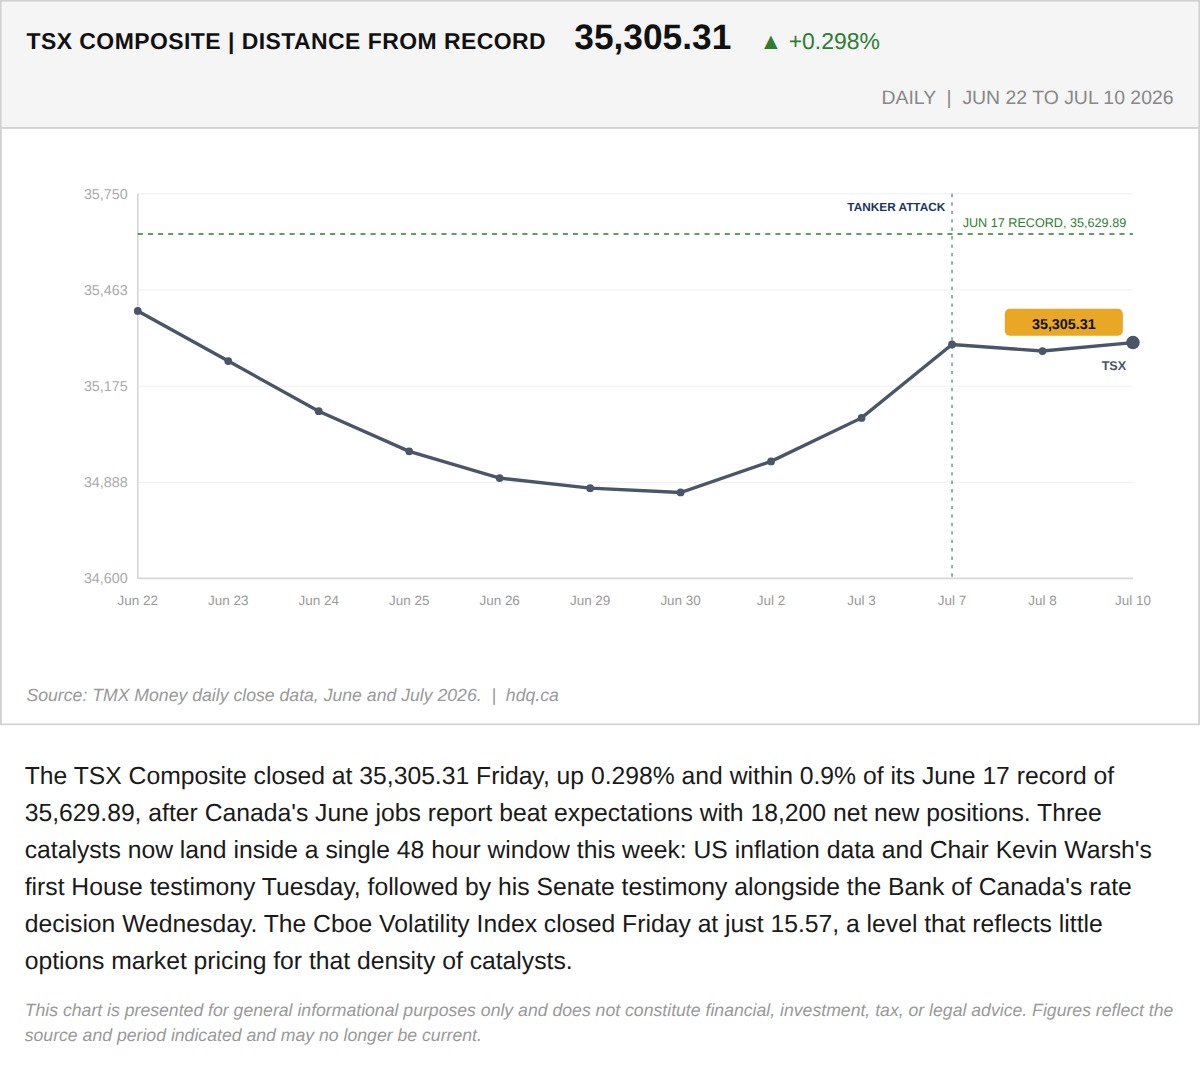
The TSX Composite closed at 35,305.31 Friday, up 0.298% and within 0.9% of its June 17 record of 35,629.89, after Canada's June jobs report…
324 Points From a Record, the TSX Heads Into Its Busiest 48 Hours of the Summer
July 13, 2026
View chart & download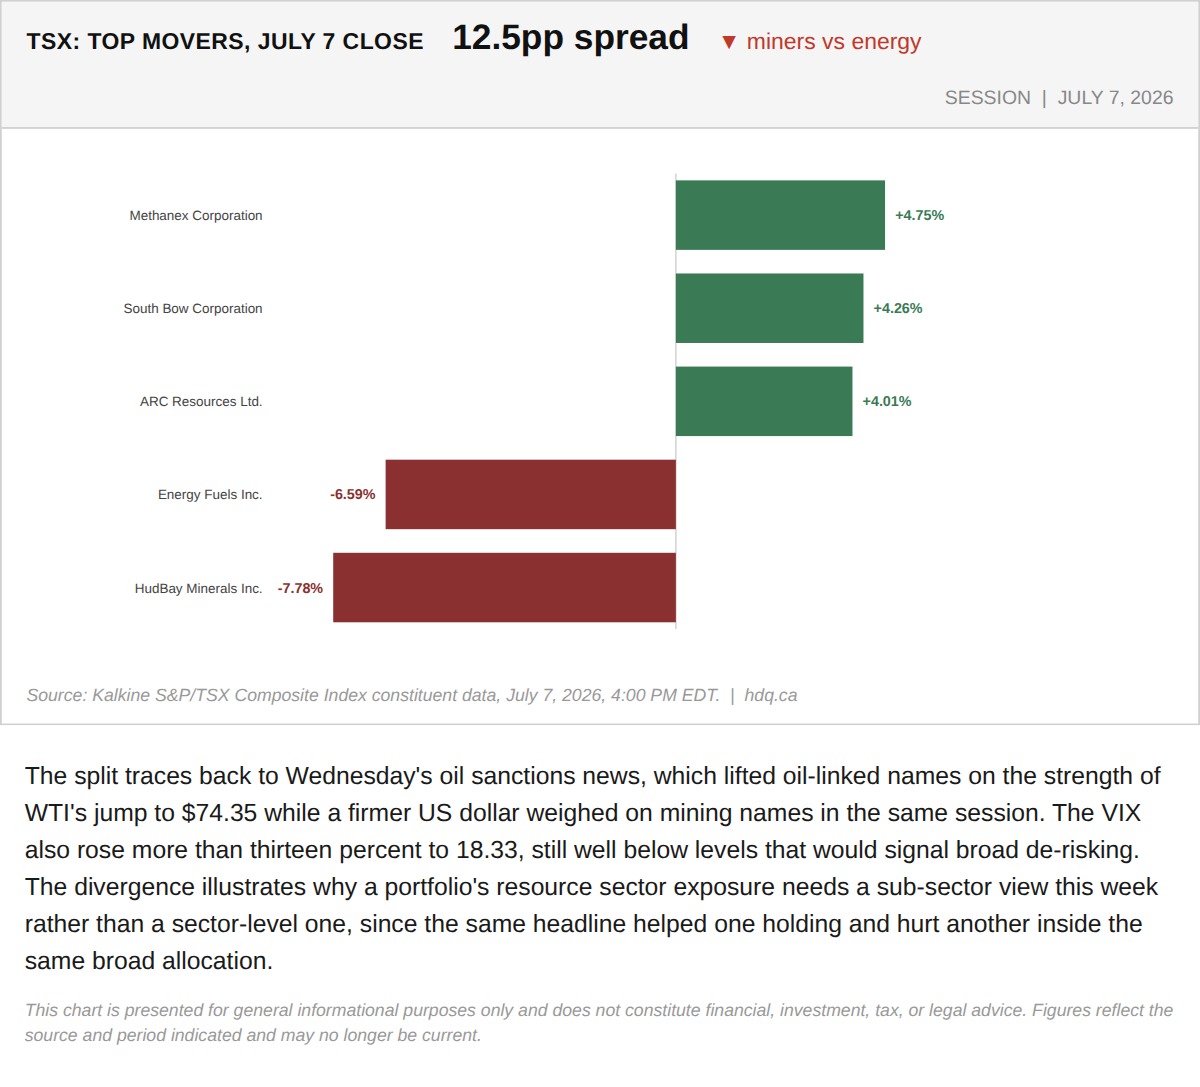
The split traces back to Wednesday's oil sanctions news, which lifted oil-linked names on the strength of WTI's jump to $74.35 while a…
July 8, 2026
View chart & download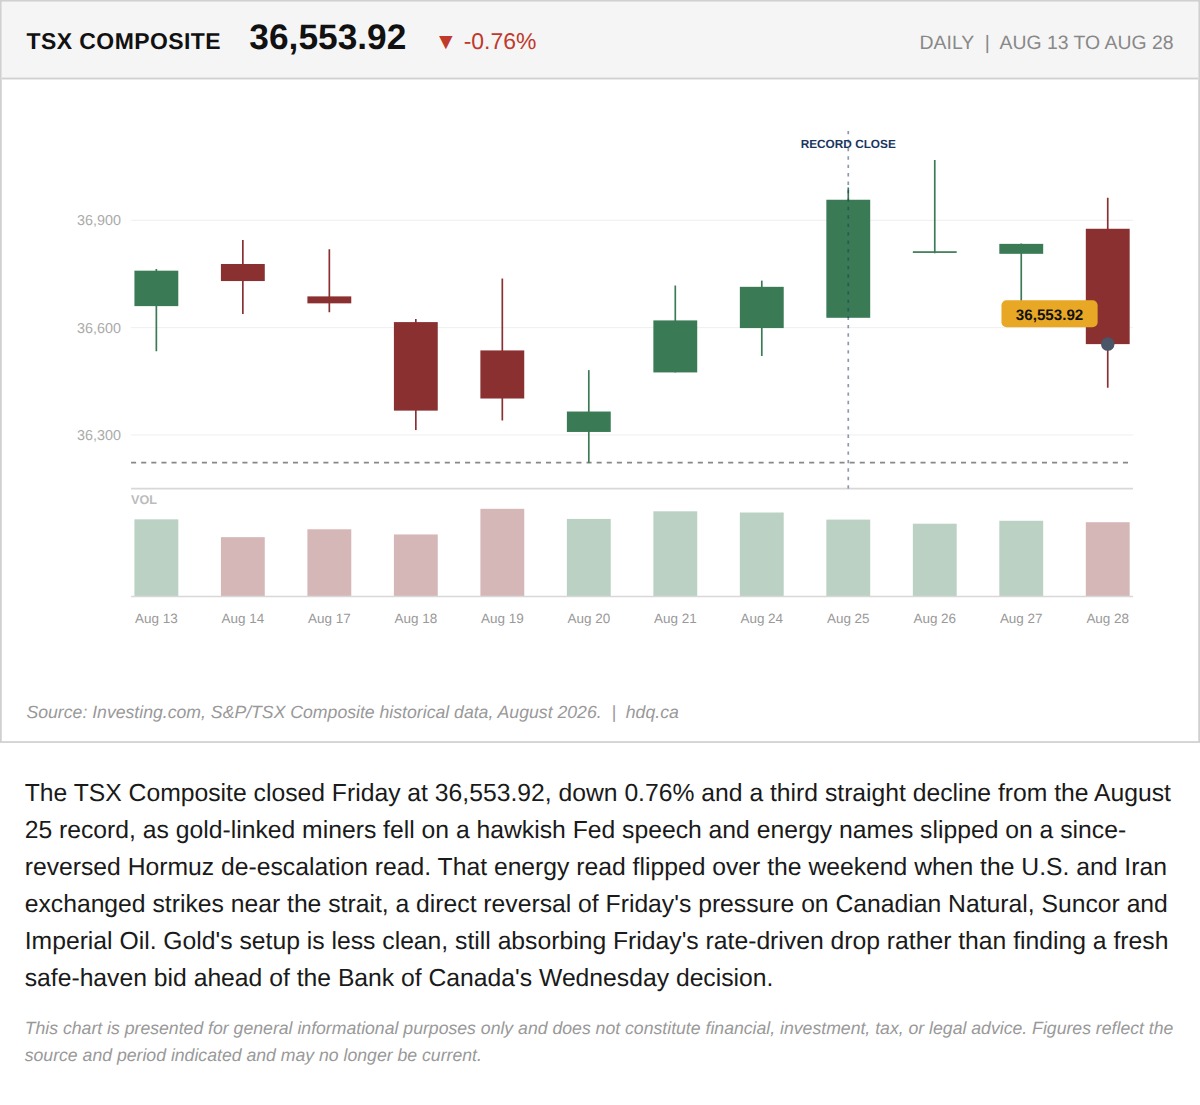
The TSX Composite closed Friday at 36,553.92, down 0.76% and a third straight decline from the August 25 record, as gold-linked miners fell…
The TSX Set a Record Close Six Sessions Ago. It Has Given Back 400 Points Since
August 31, 2026
View chart & download