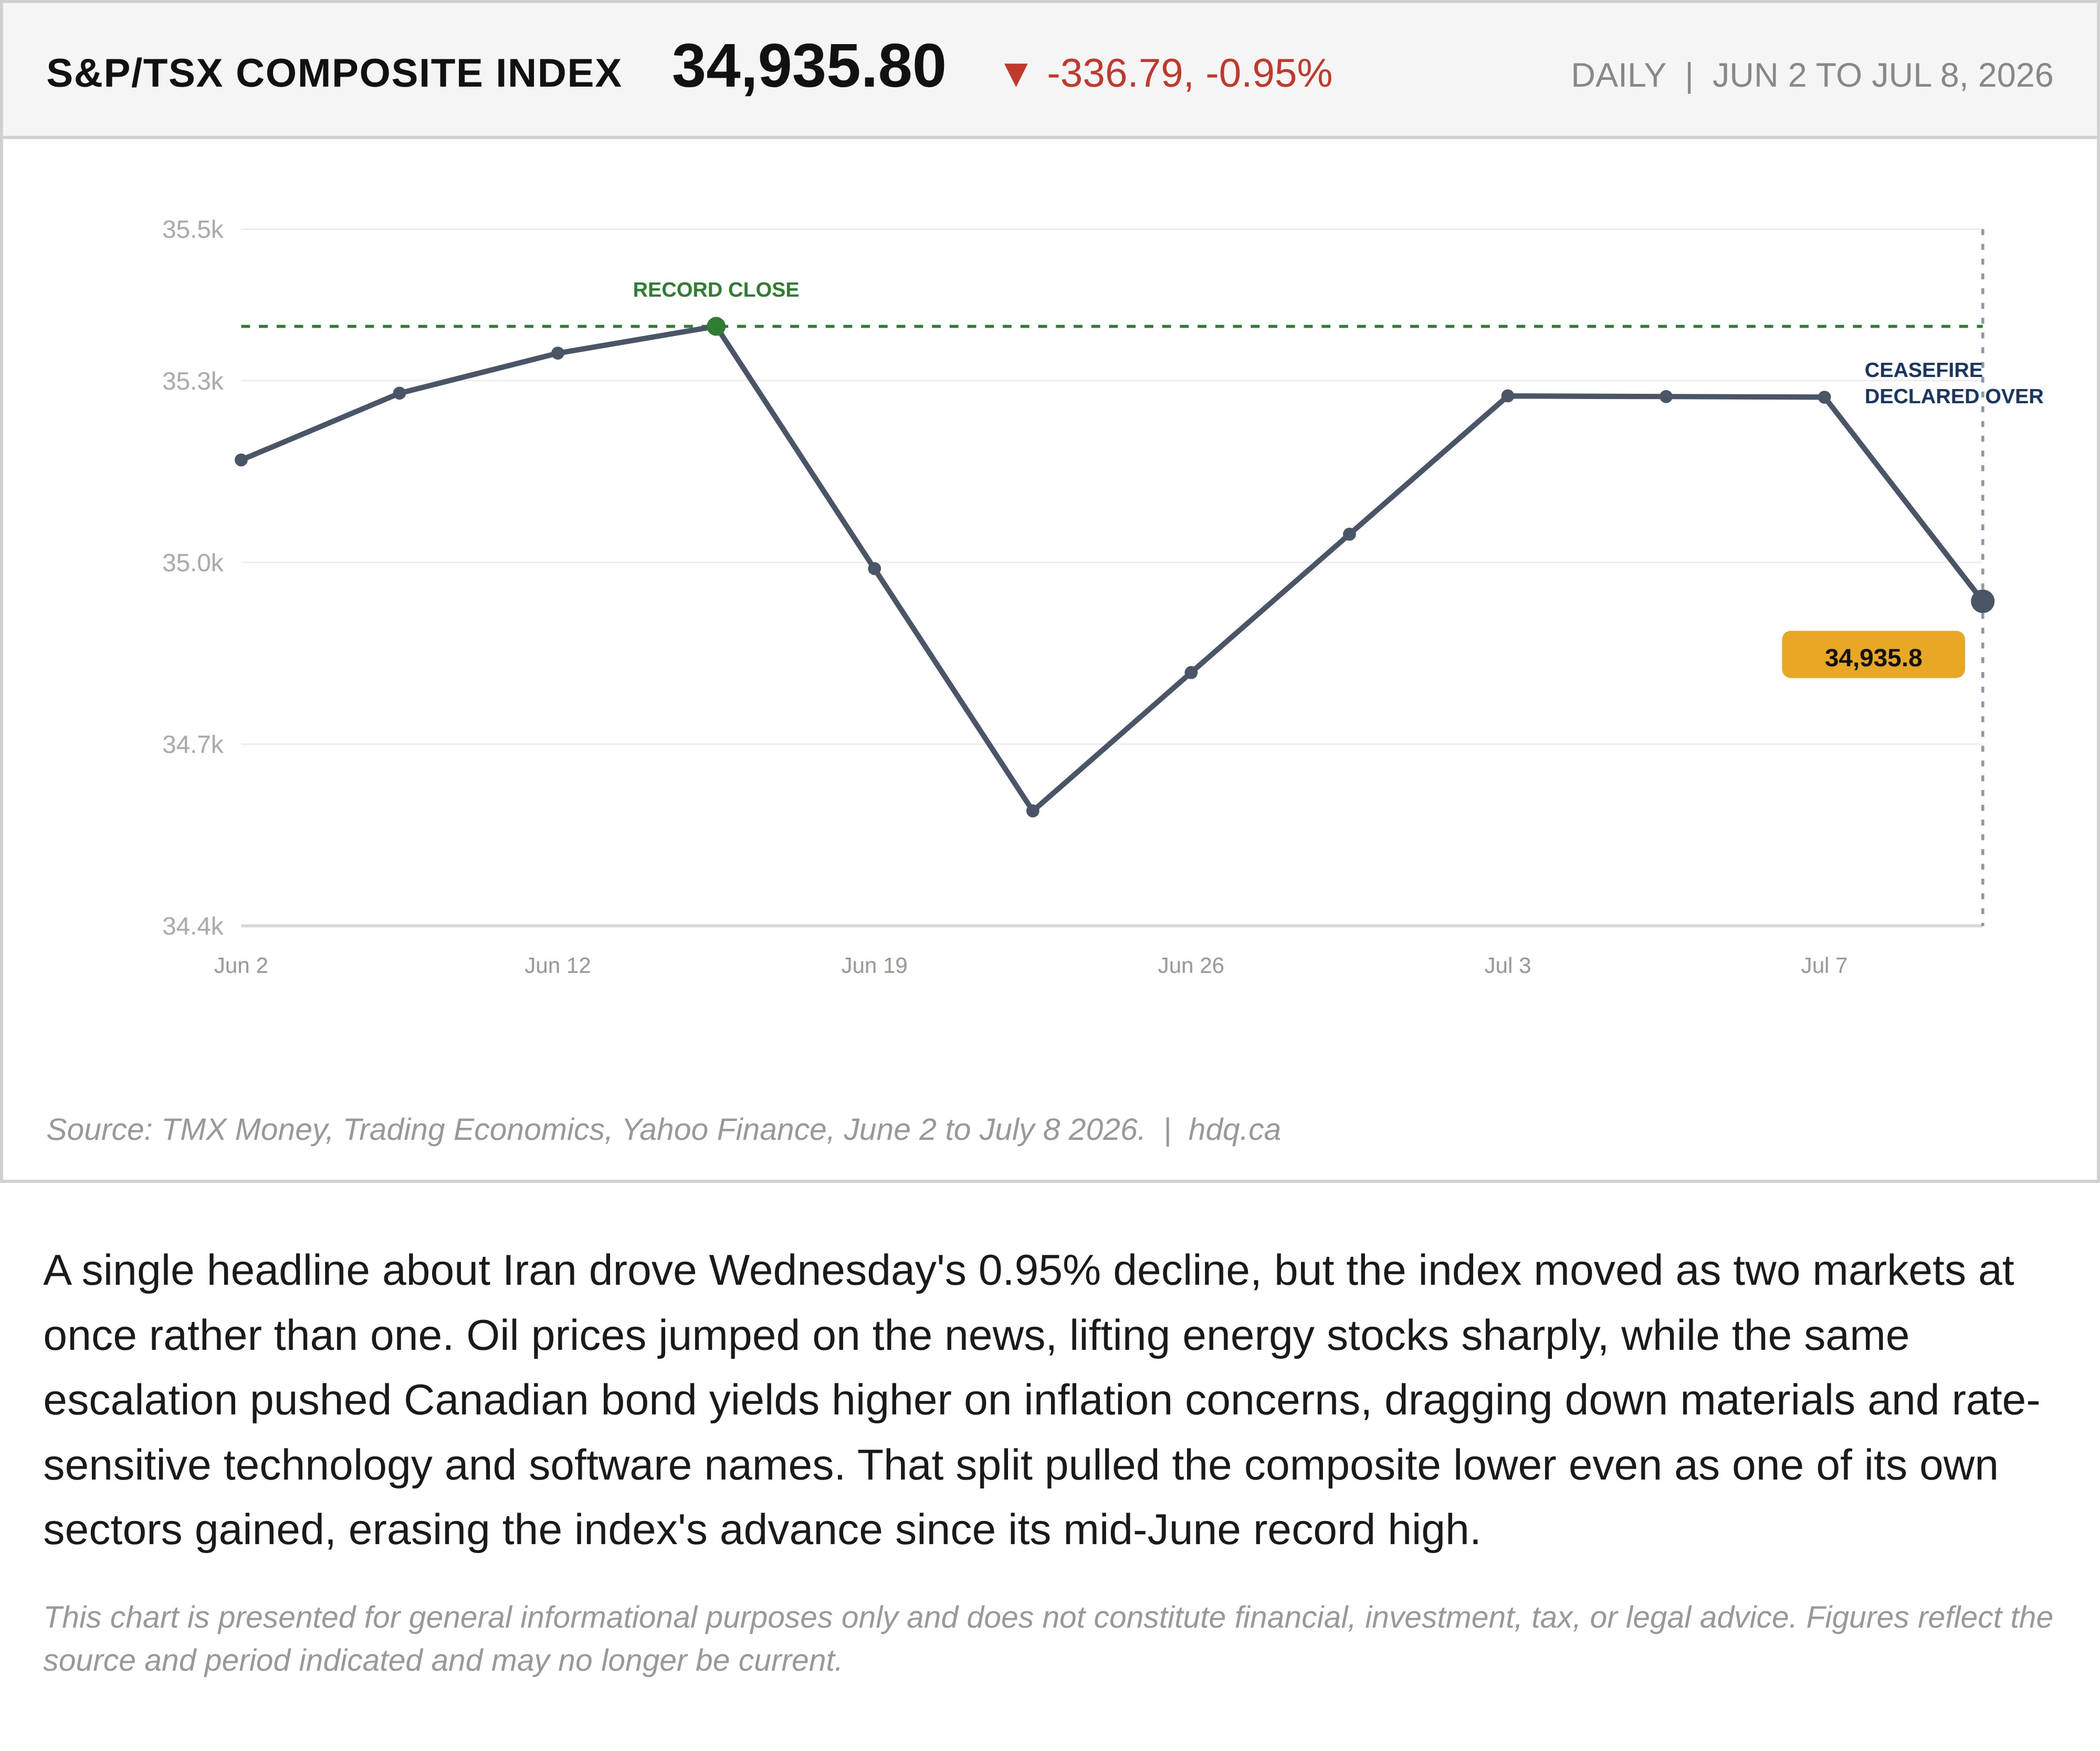
A single headline about Iran drove Wednesday's 0.95% decline, but the index moved as two markets at once rather than one. Oil prices jumped on the news, lifting energy stocks sharply, while the same escalation pushed Canadian bond yields higher on inflation concerns, dragging down materials and rate-sensitive technology and software names. That split pulled the composite lower even as one of its own sectors gained, erasing the index's advance since its mid-June record high.
This chart is presented for general informational purposes only and does not constitute financial, investment, tax, or legal advice. Figures reflect the source and period indicated and may no longer be current.

Related charts
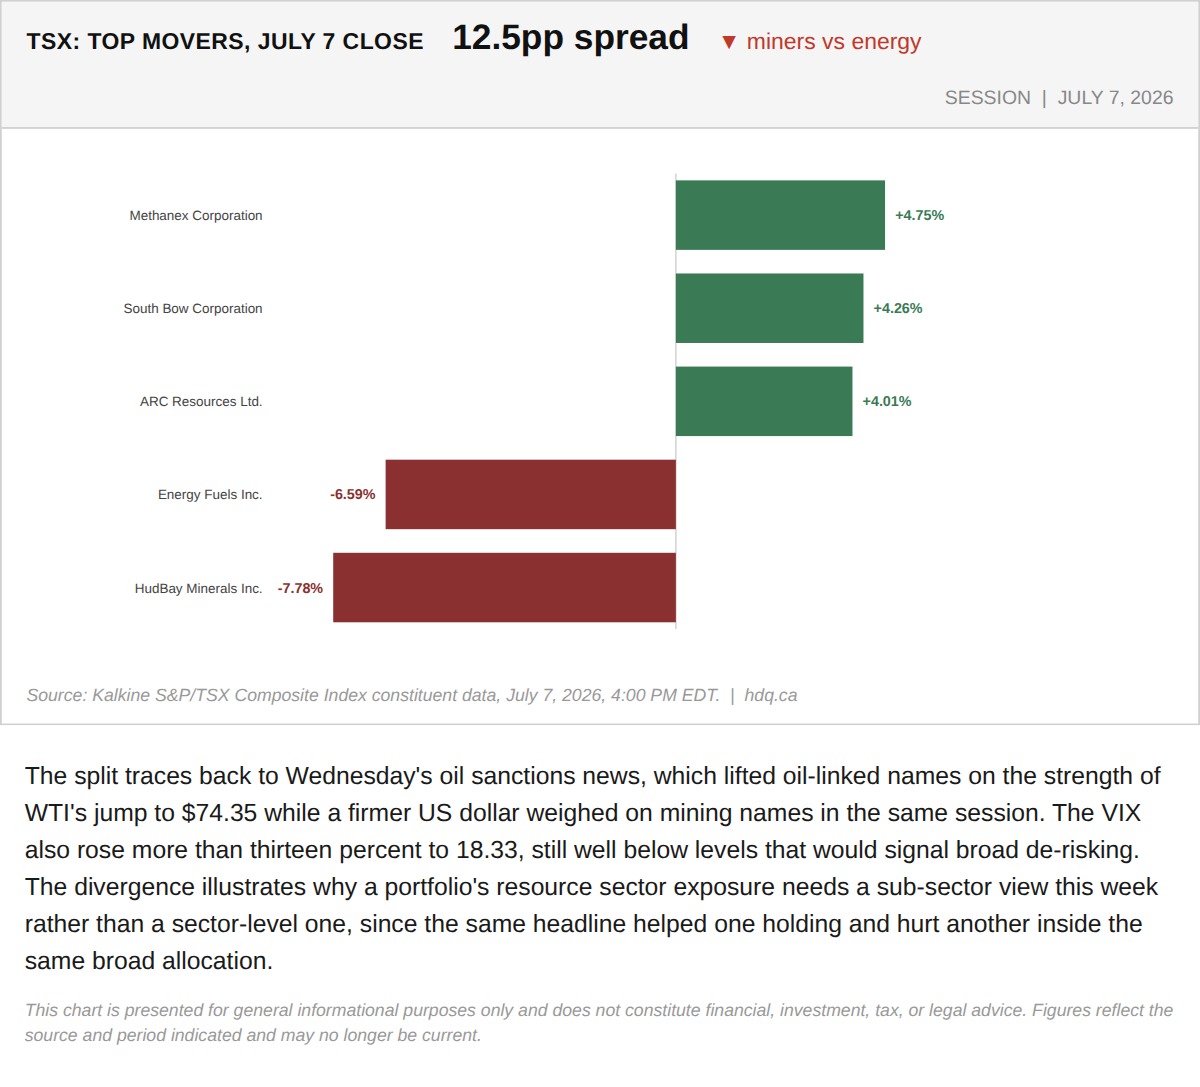
The split traces back to Wednesday's oil sanctions news, which lifted oil-linked names on the strength of WTI's jump to $74.35 while a…
July 8, 2026
View chart & download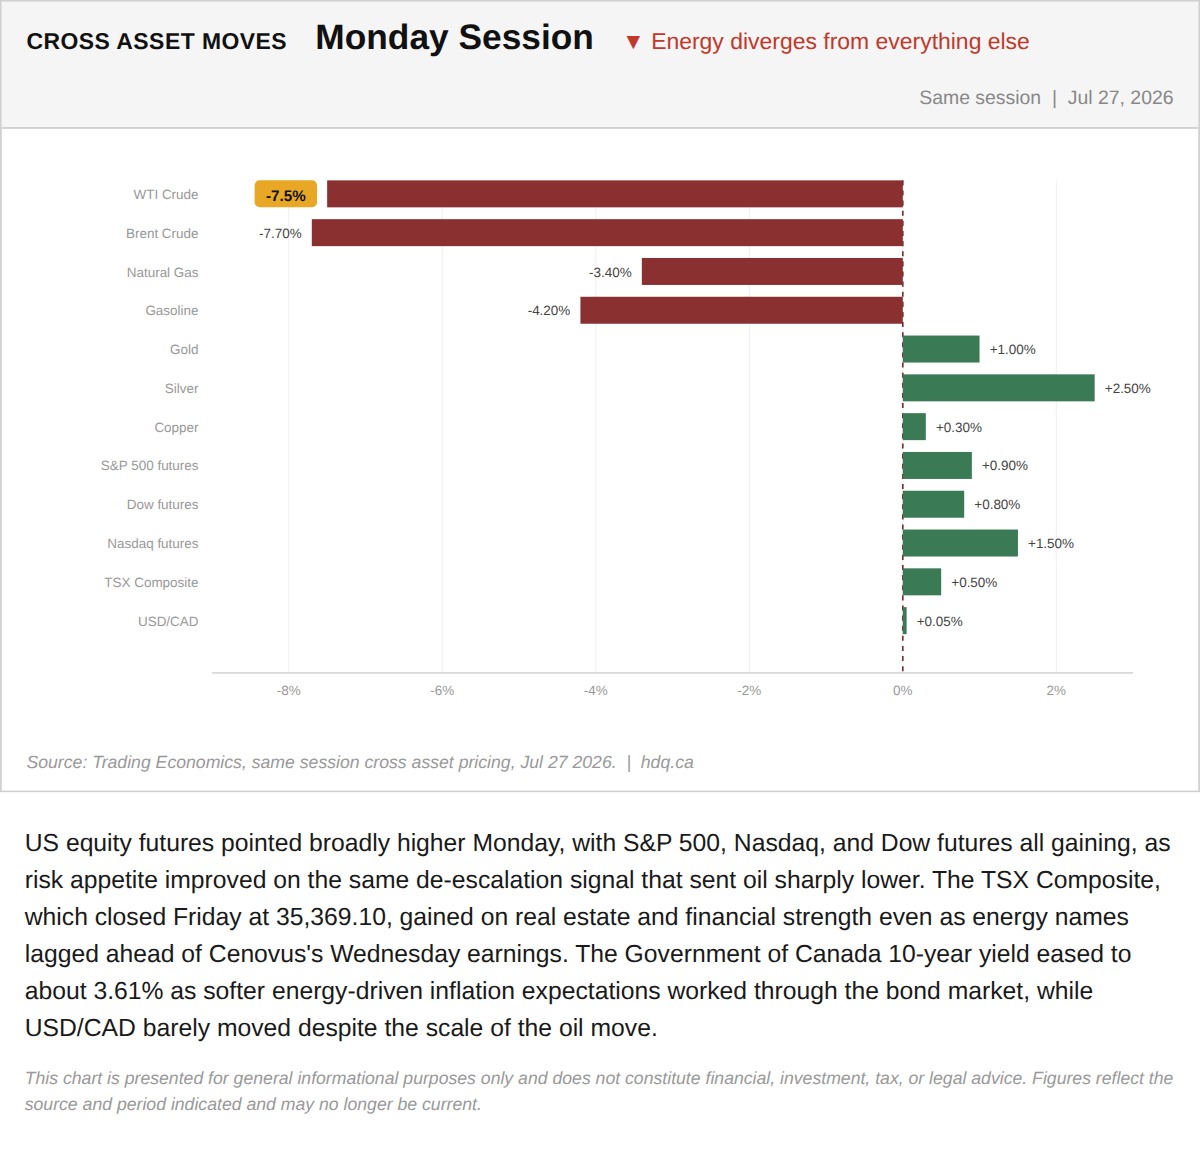
US equity futures pointed broadly higher Monday, with S&P 500, Nasdaq, and Dow futures all gaining, as risk appetite improved on the same…
Cross-Asset Moves Diverge as Energy Lags Monday's Broader Rally
July 27, 2026
View chart & download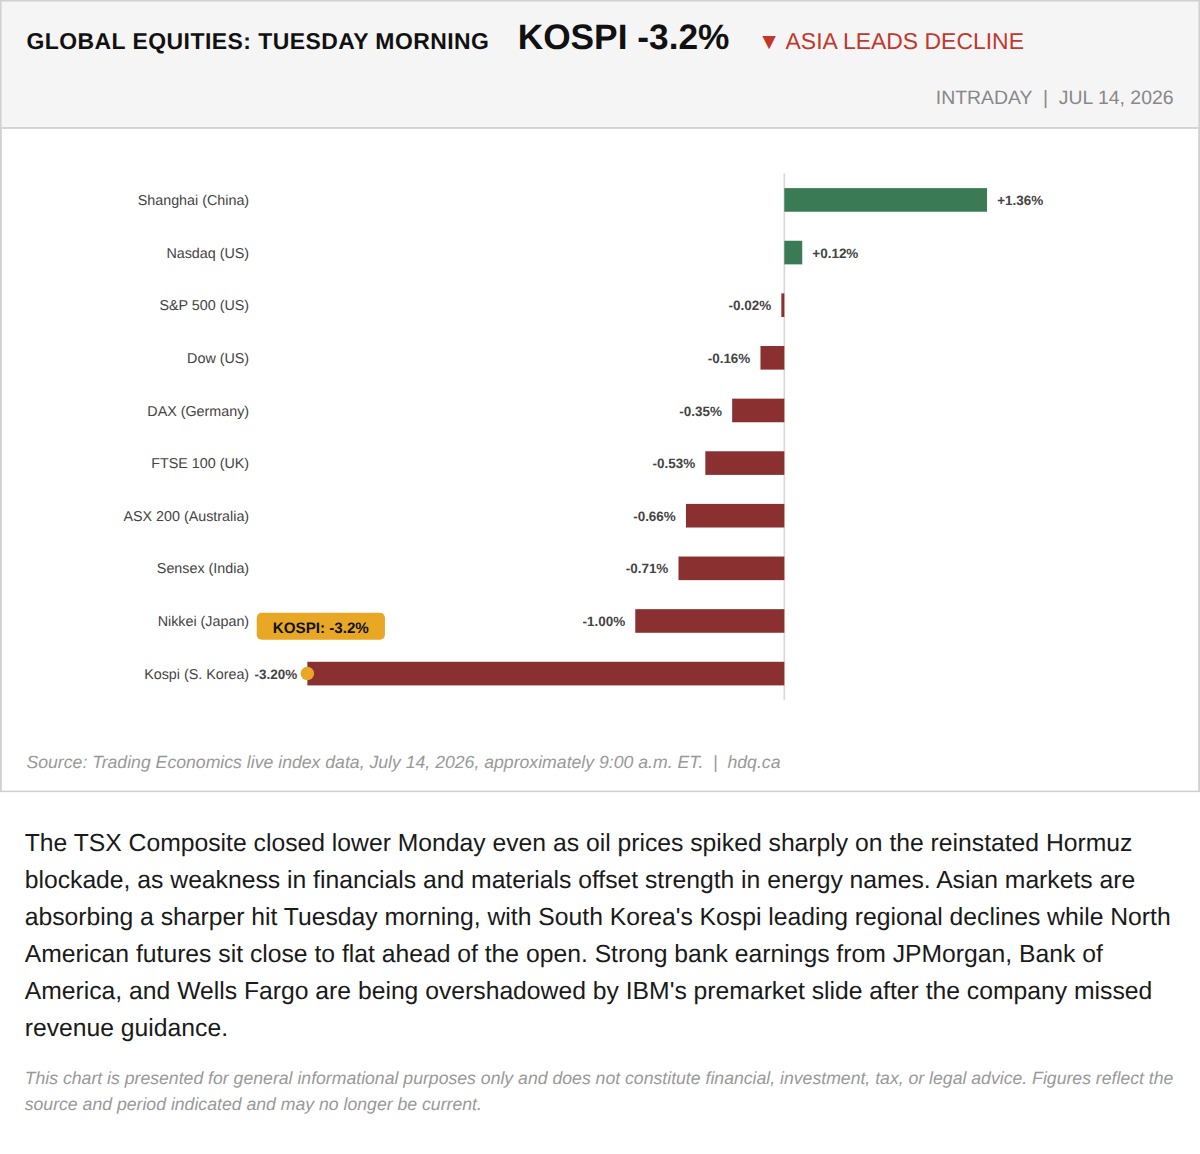
The TSX Composite closed lower Monday even as oil prices spiked sharply on the reinstated Hormuz blockade, as weakness in financials and materials offset strength in energy names.
Oil Jumped 9.6% Monday. The TSX Still Closed Lower.
July 14, 2026
View chart & download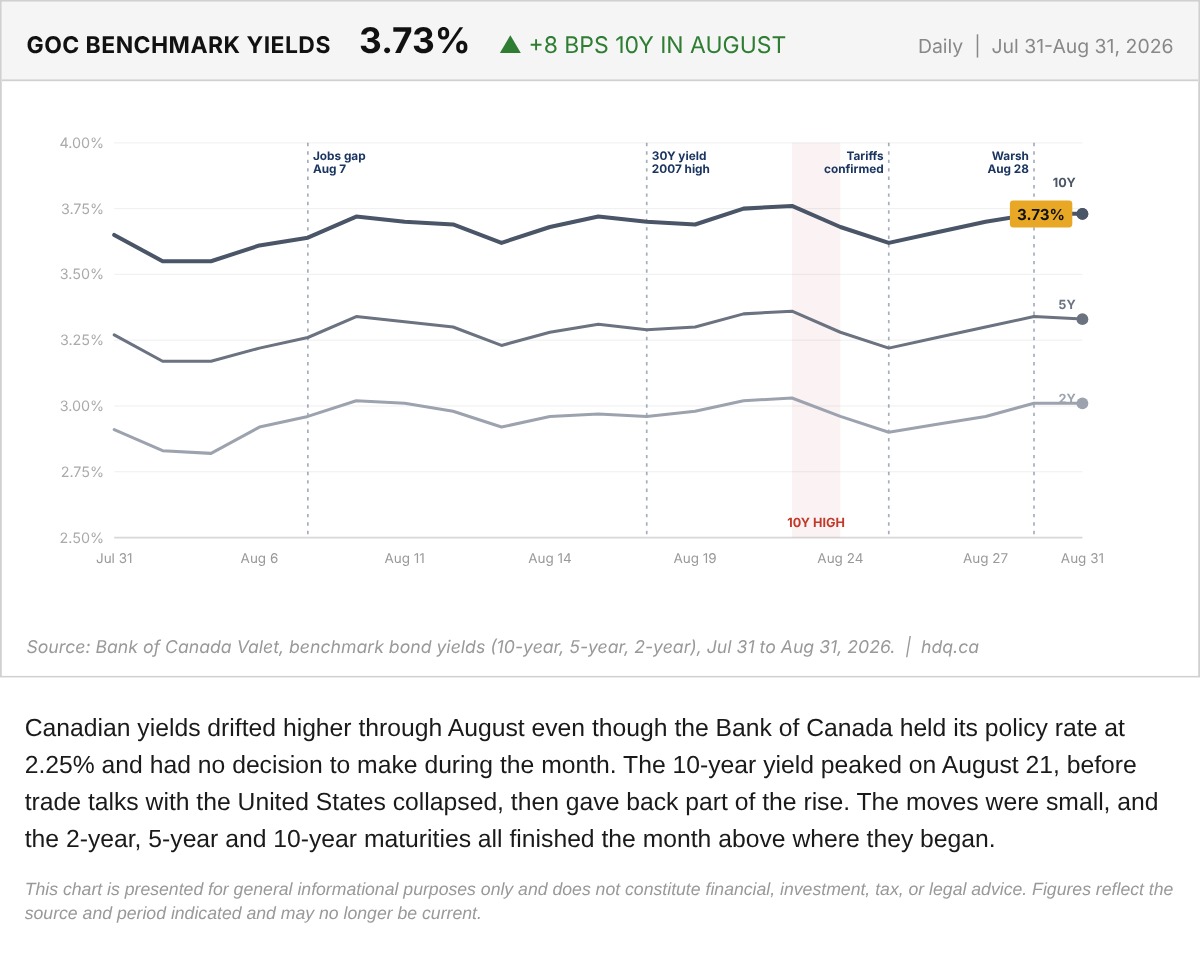
Canadian yields drifted higher through August even though the Bank of Canada held its policy rate at 2.25% and had no decision to make during the month.
Government of Canada Benchmark Yields, August 2026
August 31, 2026
View chart & download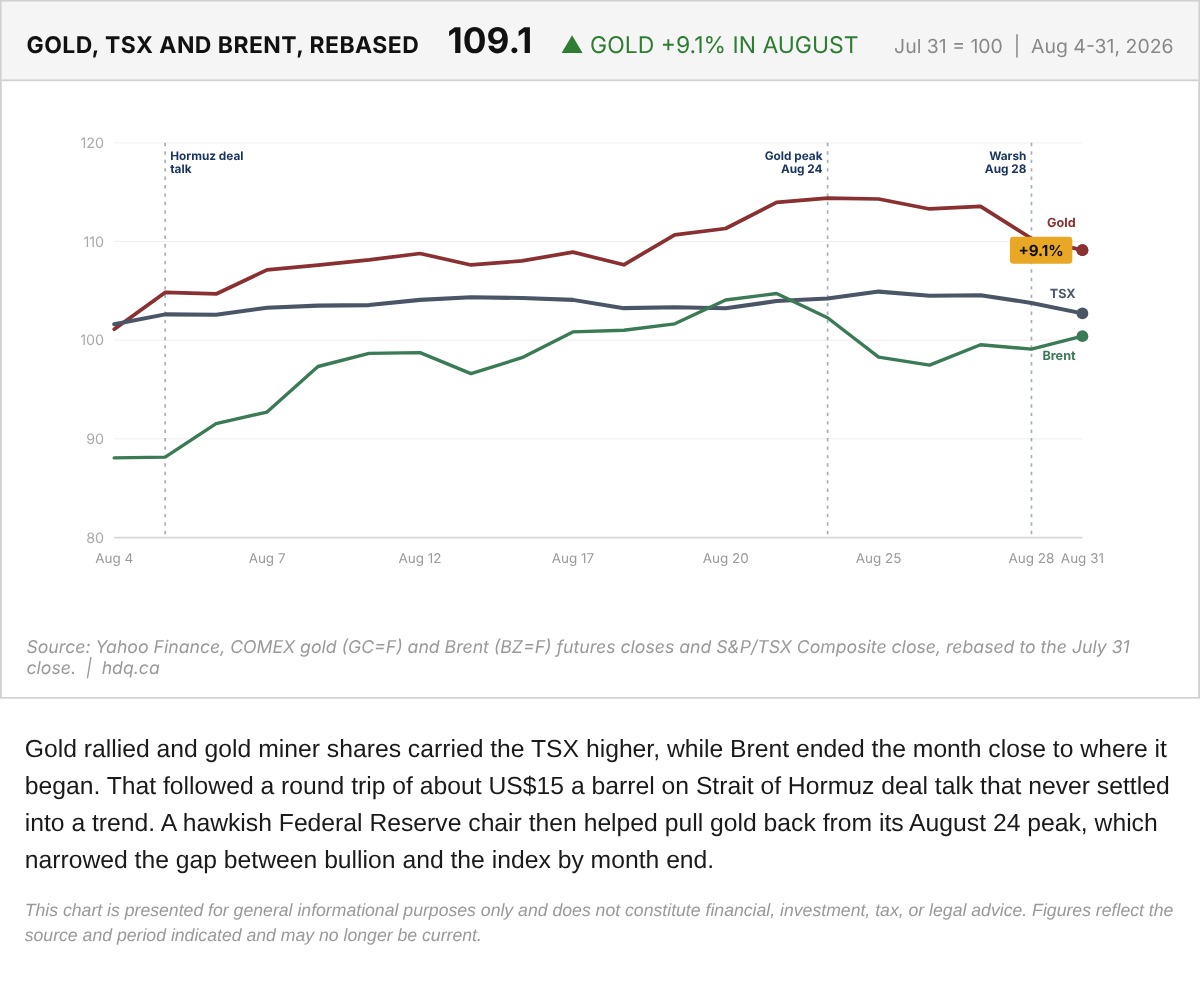
Gold rallied and gold miner shares carried the TSX higher, while Brent ended the month close to where it began.
Gold, TSX and Brent Rebased to the July 31 Close
August 31, 2026
View chart & download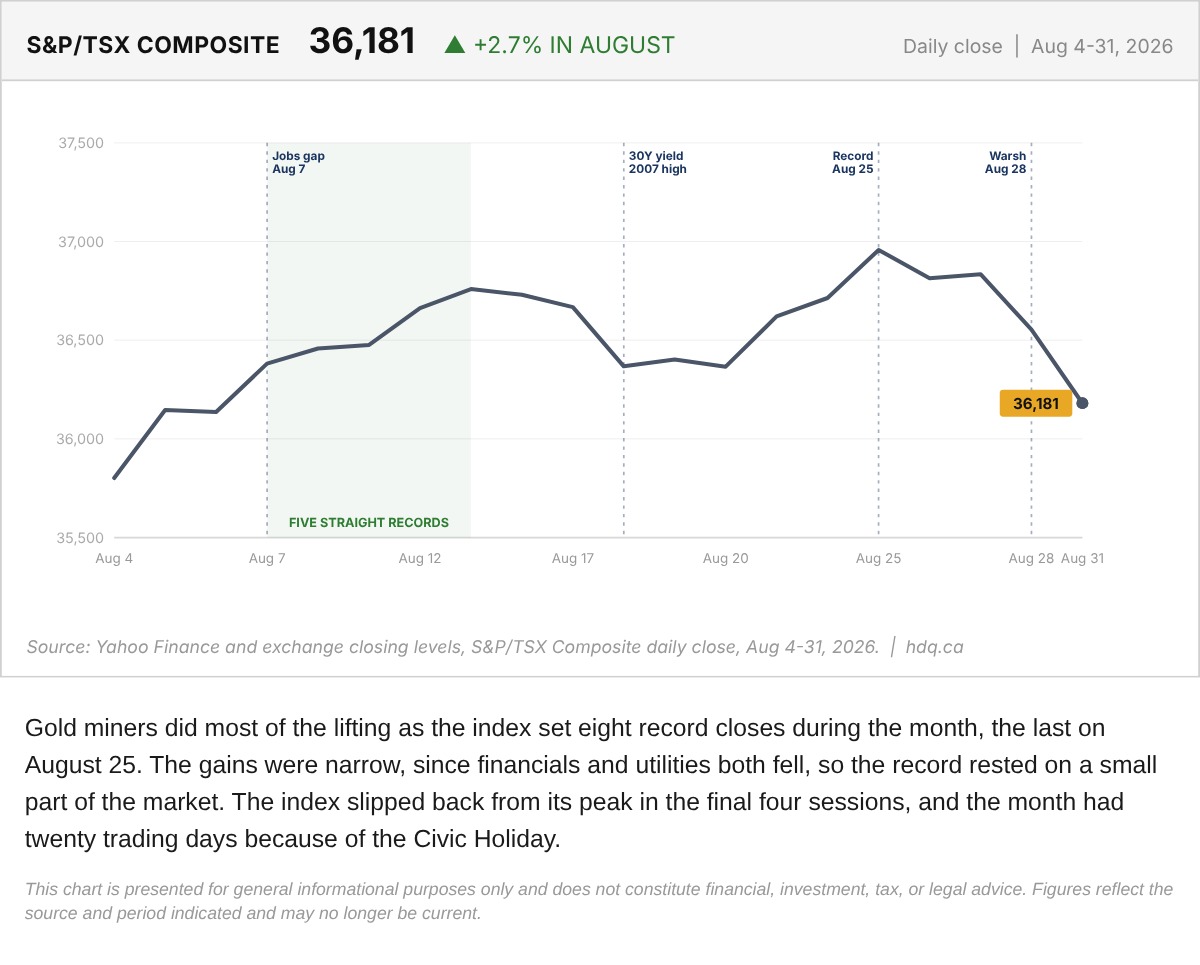
Gold miners did most of the lifting as the index set eight record closes during the month, the last on August 25.
S&P/TSX Composite Daily Close Through August 2026
August 31, 2026
View chart & download