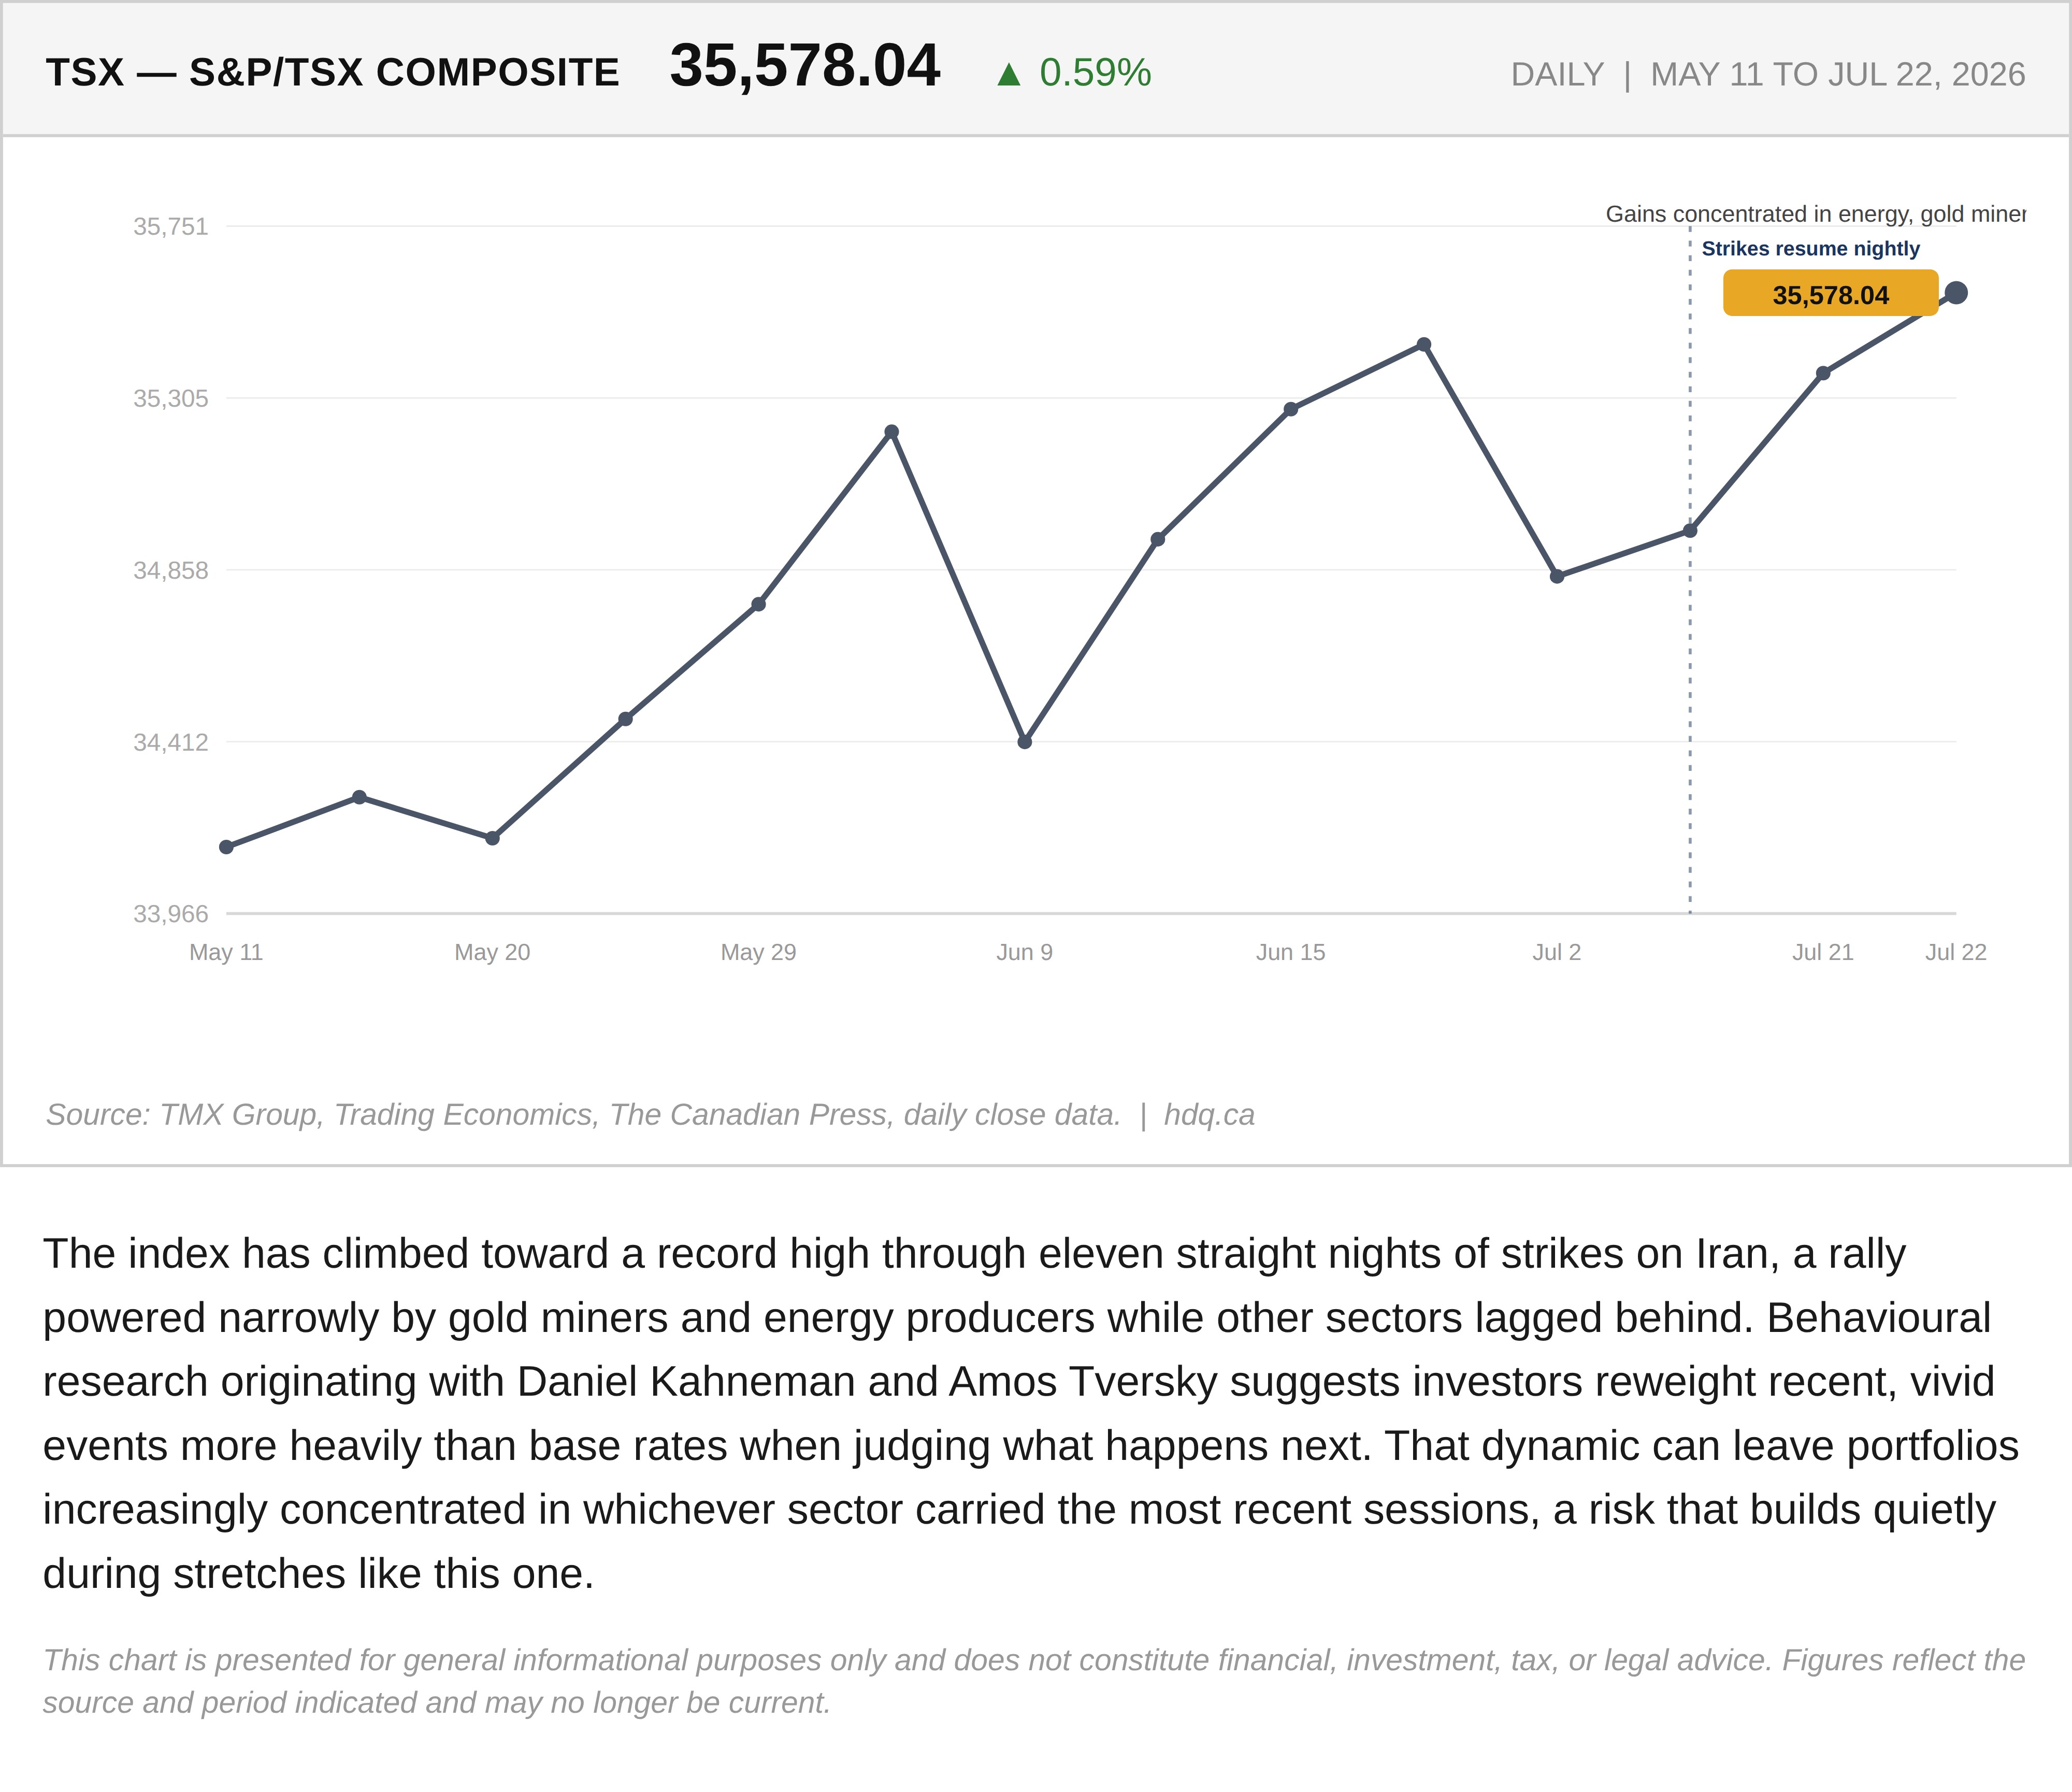
The index has climbed toward a record high through eleven straight nights of strikes on Iran, a rally powered narrowly by gold miners and energy producers while other sectors lagged behind. Behavioural research originating with Daniel Kahneman and Amos Tversky suggests investors reweight recent, vivid events more heavily than base rates when judging what happens next. That dynamic can leave portfolios increasingly concentrated in whichever sector carried the most recent sessions, a risk that builds quietly during stretches like this one.
This chart is presented for general informational purposes only and does not constitute financial, investment, tax, or legal advice. Figures reflect the source and period indicated and may no longer be current.

Related charts
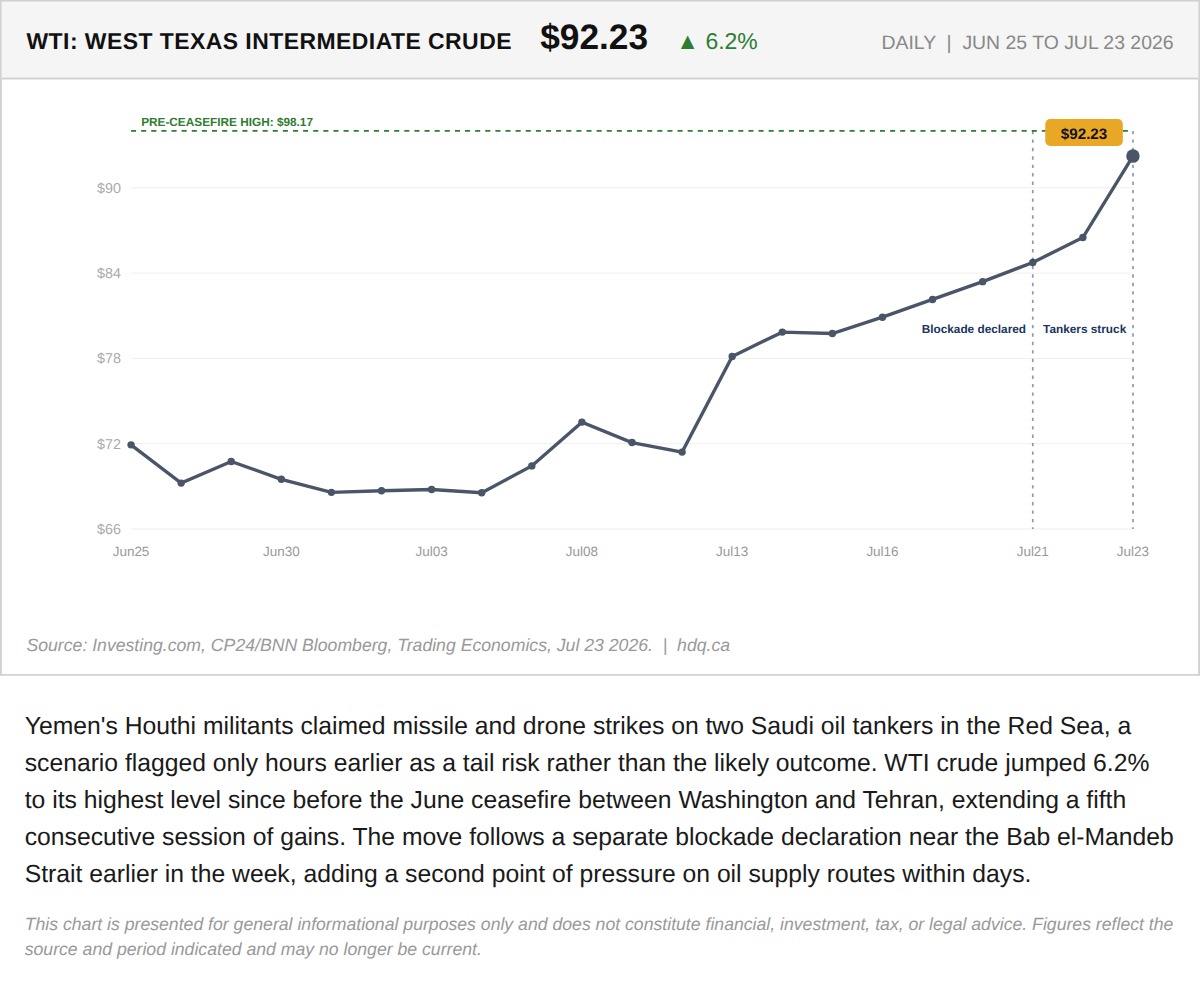
WTI crude has climbed to $74.40, up 11.1% since June 24, as the U.S.
The Strikes on Iran Got Bigger Overnight. The Market's Reaction Got Smaller.
July 9, 2026
View chart & download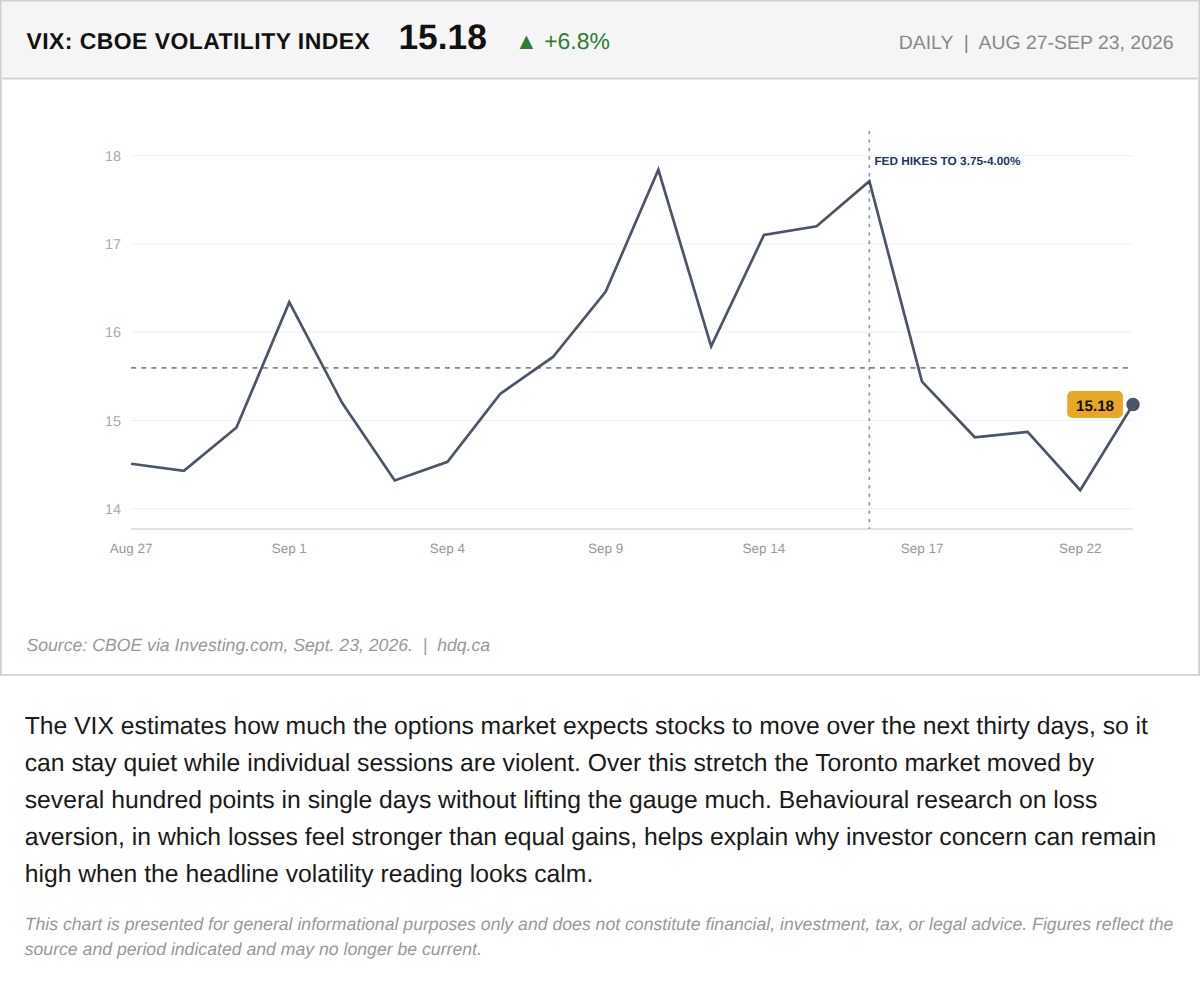
The VIX estimates how much the options market expects stocks to move over the next thirty days, so it can stay quiet while individual sessions are violent.
VIX Stays Subdued While the TSX Swings
September 24, 2026
View chart & download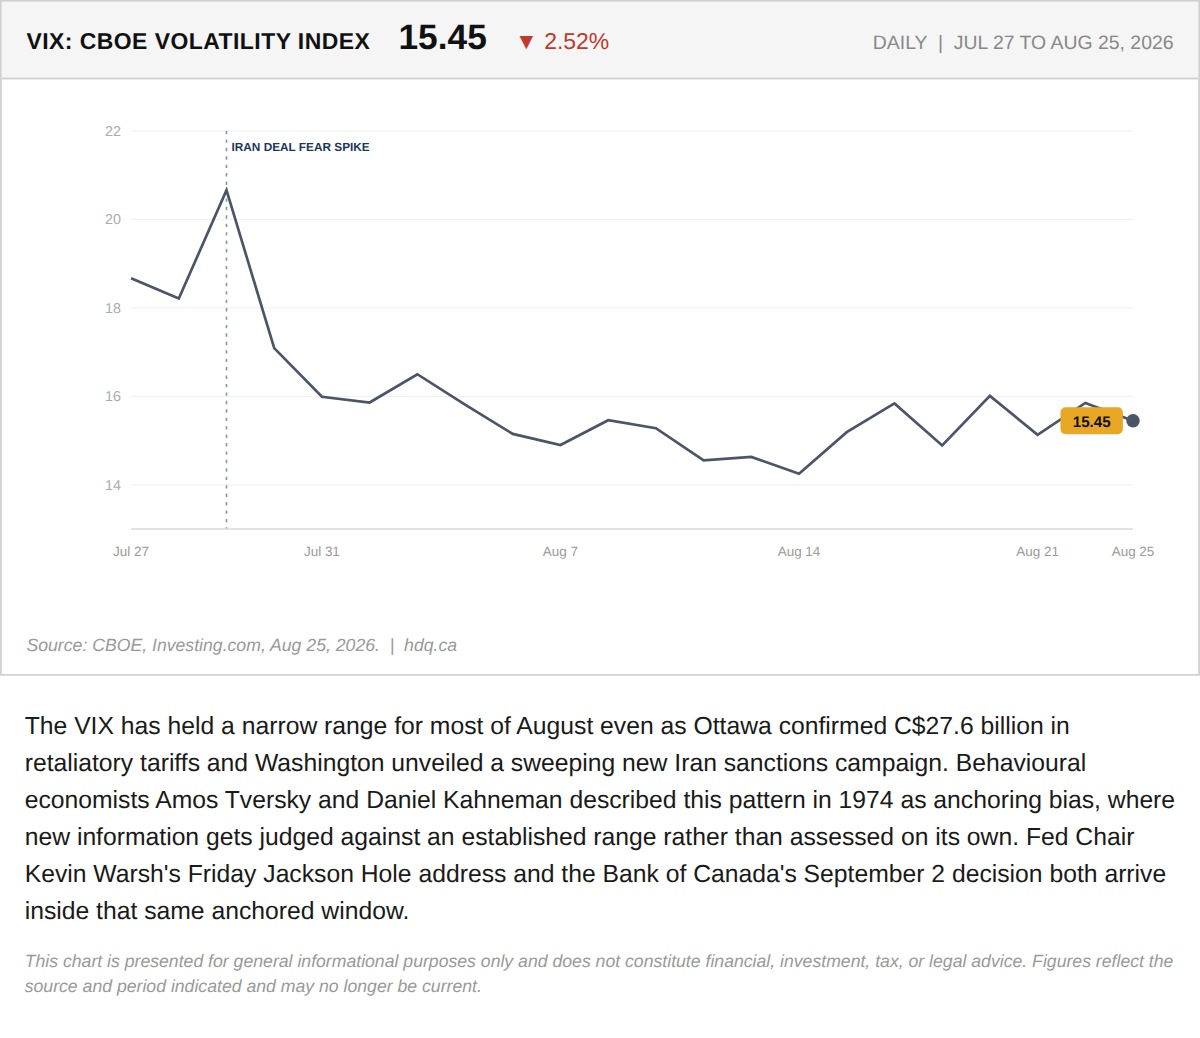
The VIX has held a narrow range for most of August even as Ottawa confirmed C$27.6 billion in retaliatory tariffs and Washington unveiled a sweeping new Iran sanctions campaign.
The VIX Has Not Moved in Three Weeks. That Is Not the Same as Markets Judging the Trade War Small.
August 26, 2026
View chart & download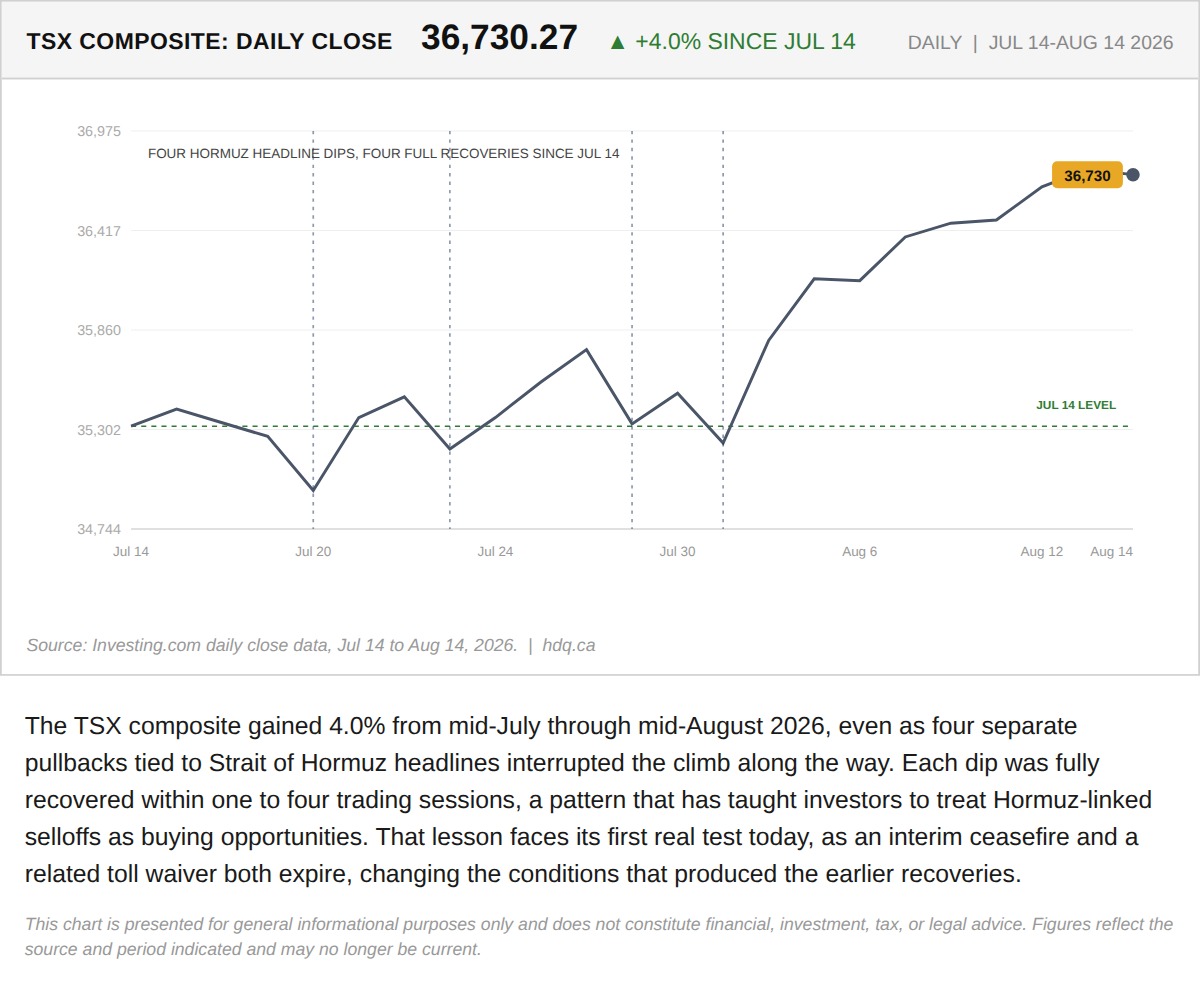
The TSX composite gained 4.0% from mid-July through mid-August 2026, even as four separate pullbacks tied to Strait of Hormuz headlines interrupted the climb along the way.
Four Hormuz Dips Recovered in a Month. Today Tests Whether the Pattern Holds.
August 17, 2026
View chart & download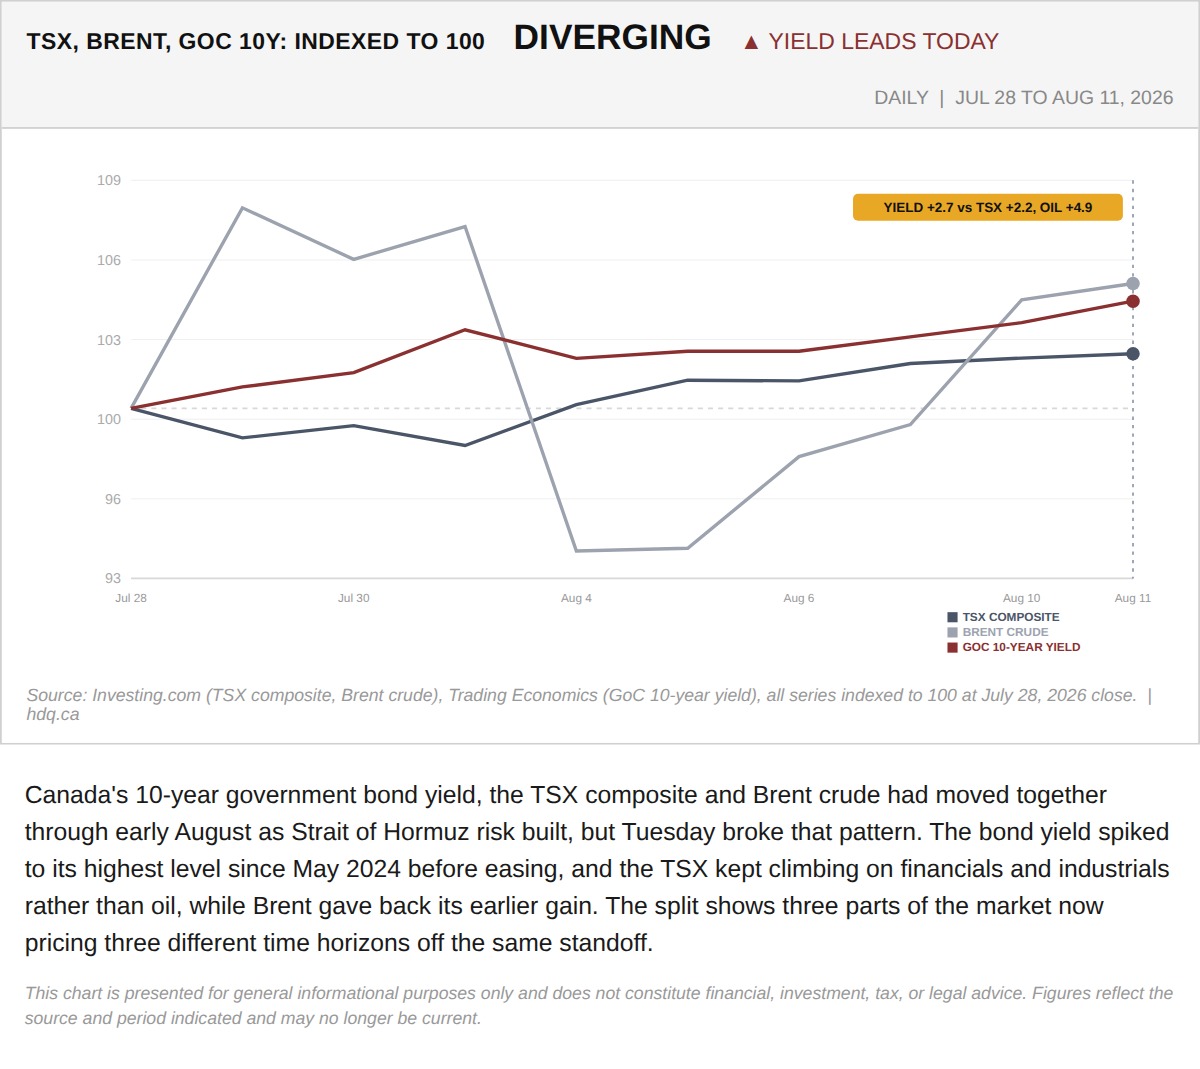
Canada's 10-year government bond yield, the TSX composite and Brent crude had moved together through early August as Strait of Hormuz risk built, but Tuesday broke that pattern.
TSX, Brent and Canada's 10-Year Yield Diverge
August 11, 2026
View chart & download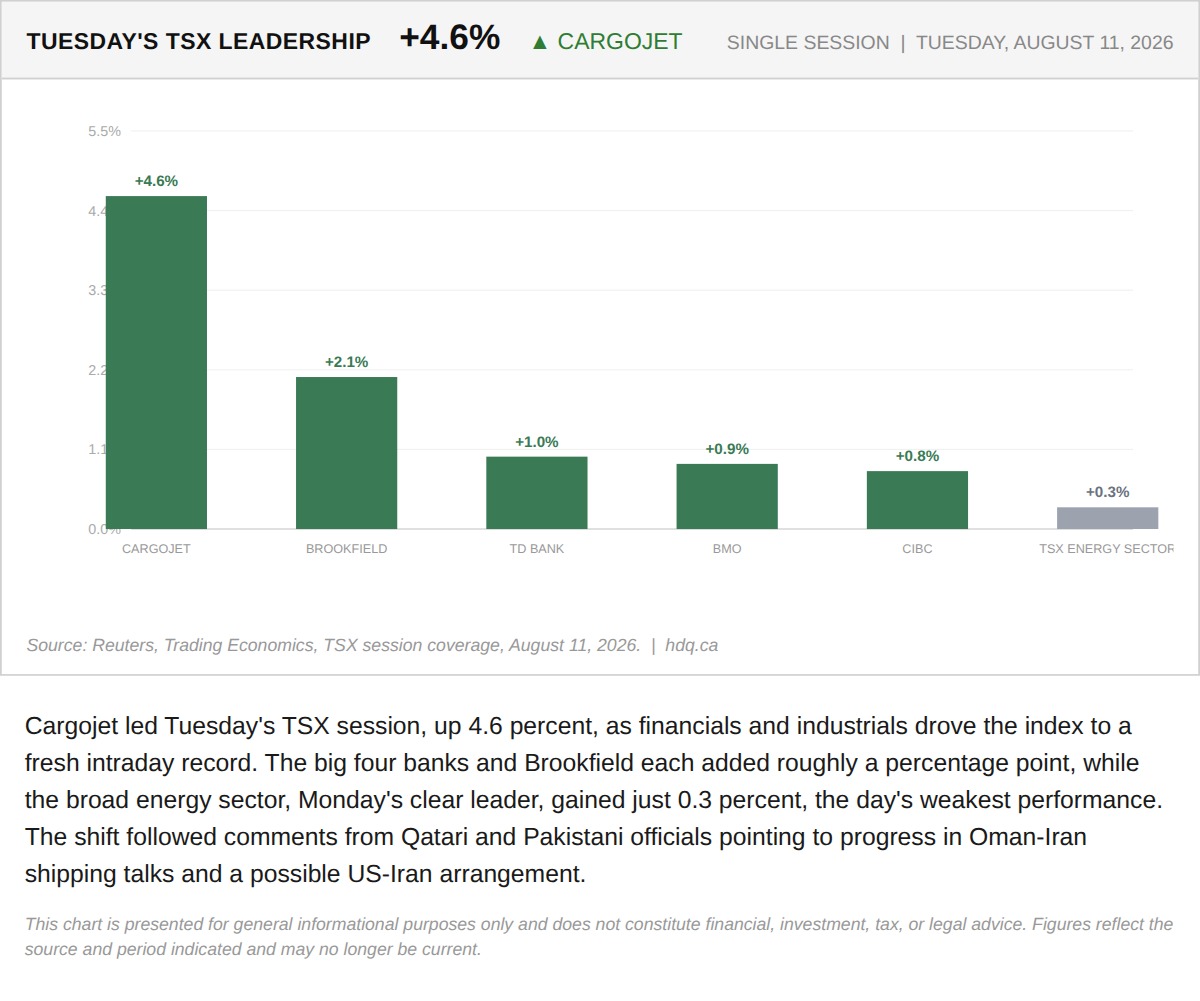
Cargojet led Tuesday's TSX session, up 4.6 percent, as financials and industrials drove the index to a fresh intraday record.
Cargojet Leads Tuesday's TSX as Energy Lags
August 11, 2026
View chart & download