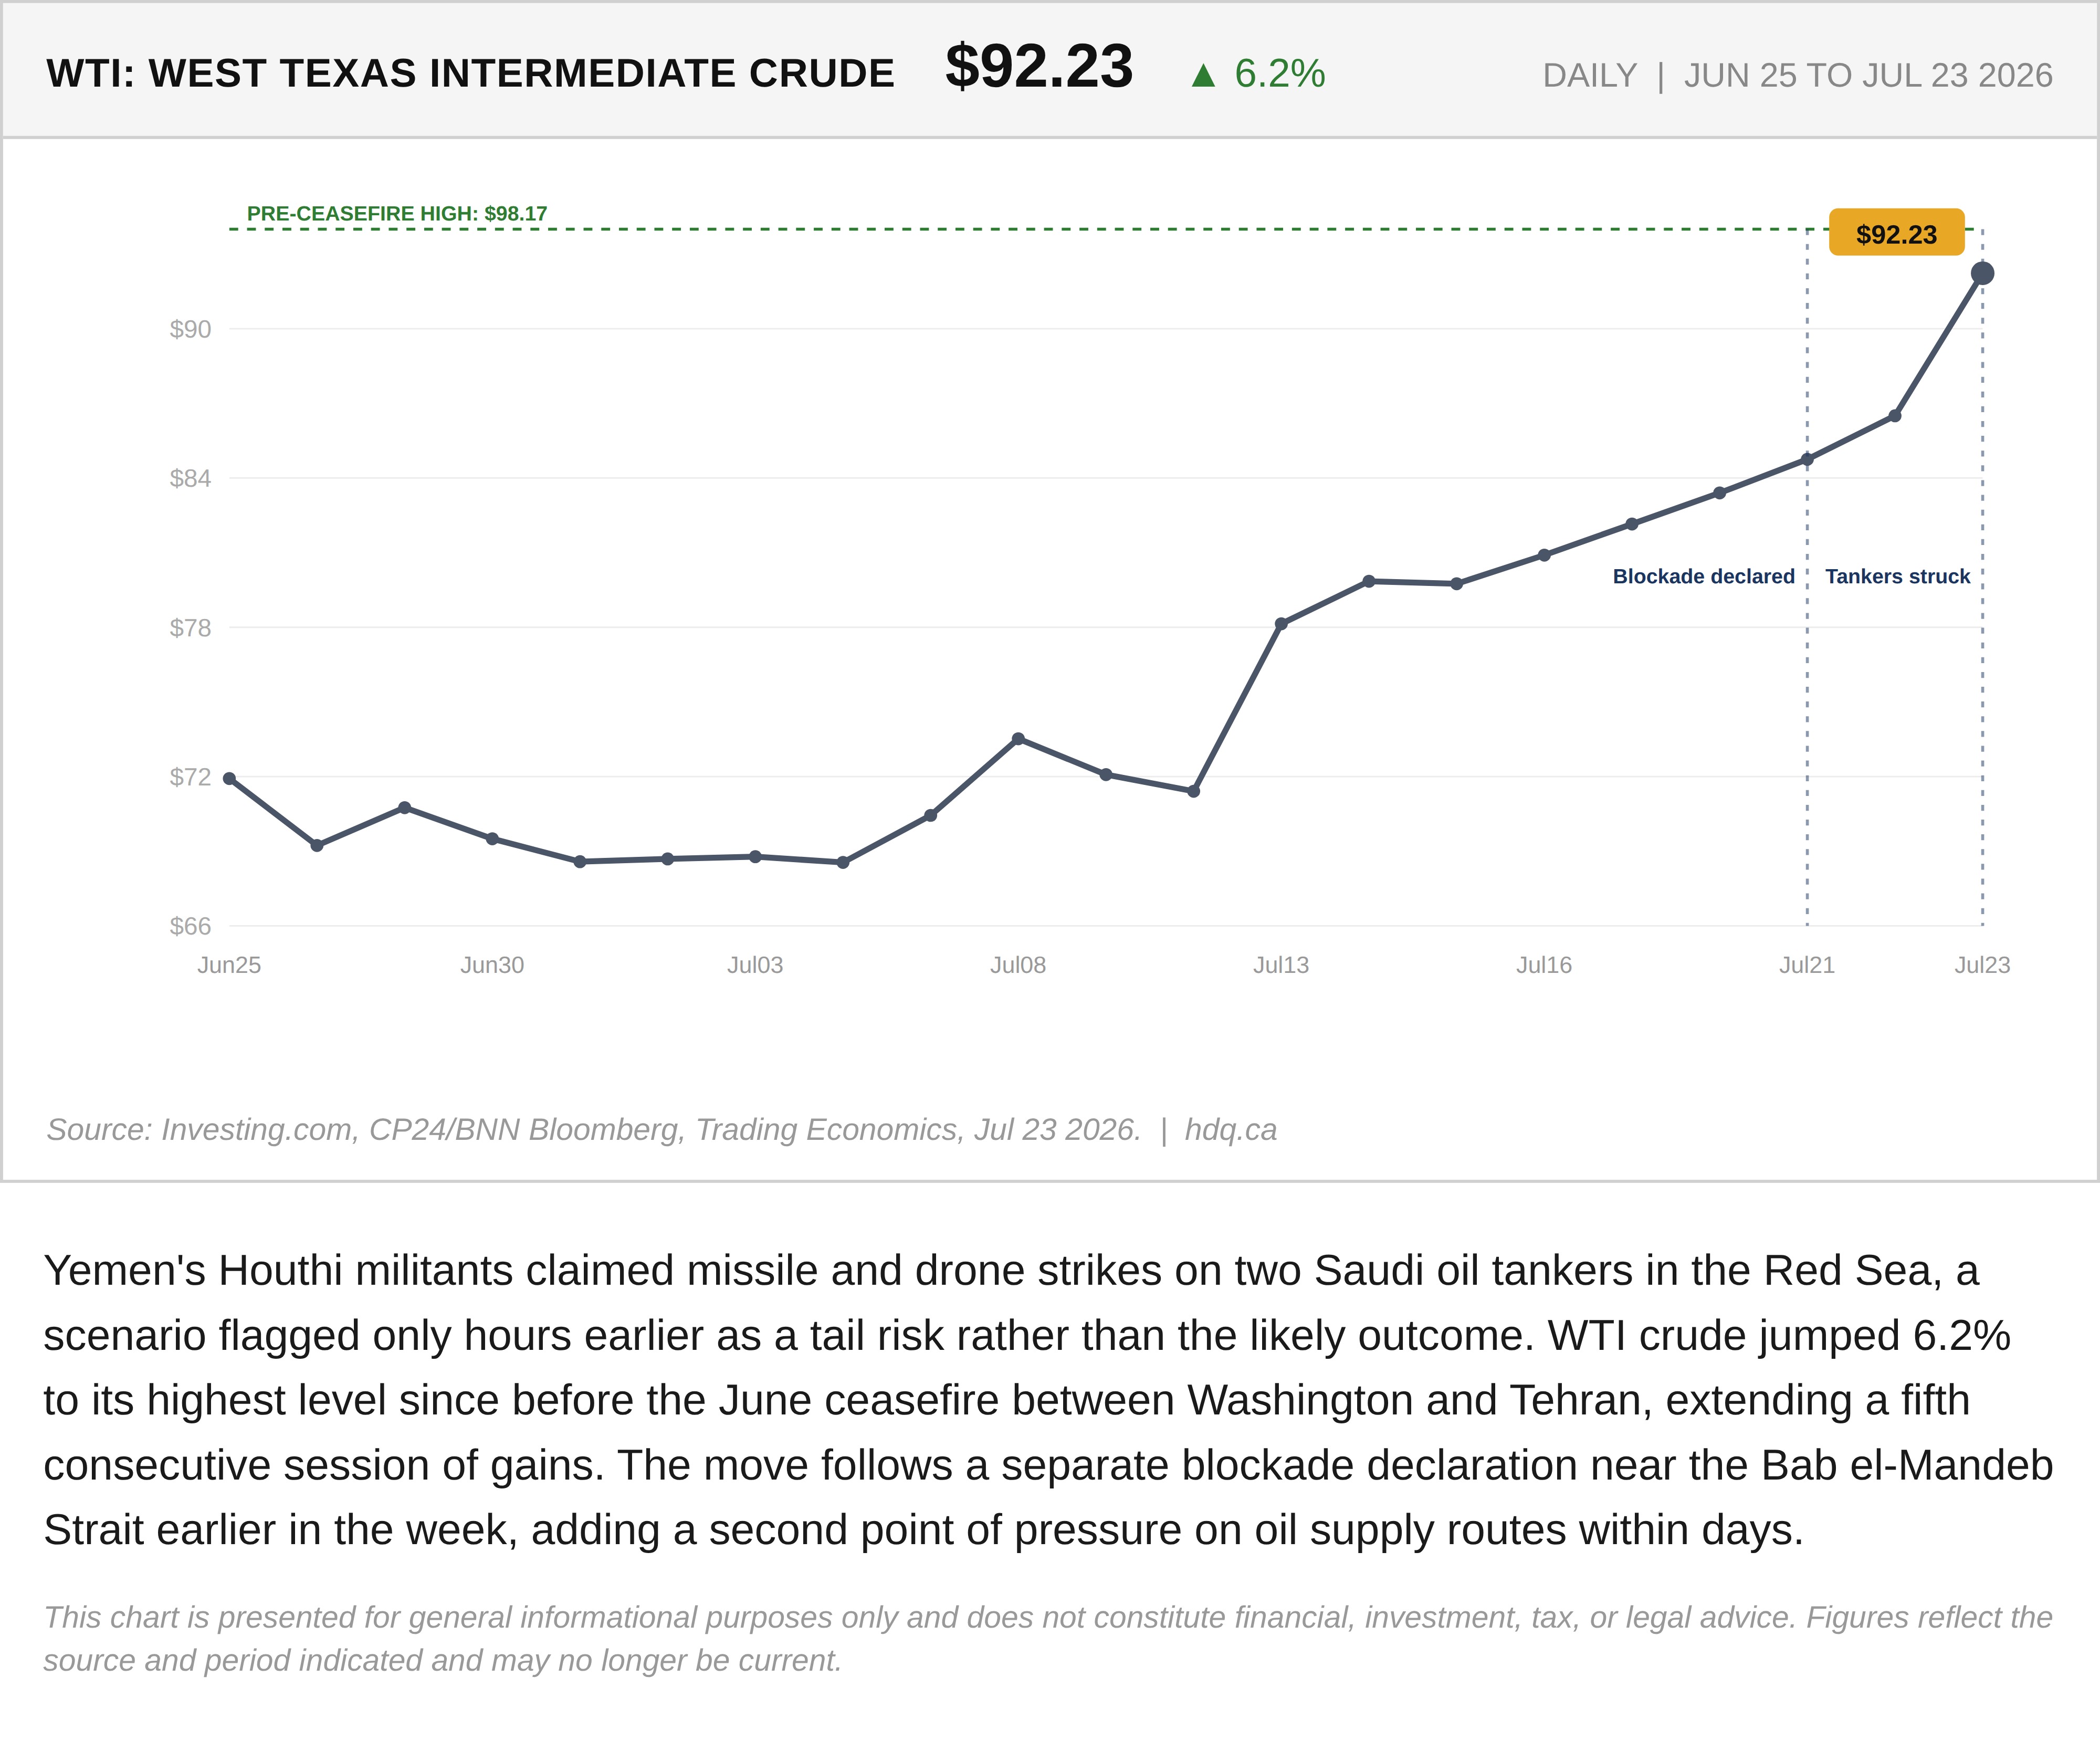
WTI crude has climbed to $74.40, up 11.1% since June 24, as the U.S. and Iran have traded escalating strikes since late February. The rise has come in uneven bursts, with the sharpest single-day jumps tied to the two most intense nights of strikes rather than steady drift. Notably, the latest escalation, a larger overnight operation followed by retaliation against three Gulf states at once, produced a smaller market reaction than the prior night's smaller strikes, even as analysts at Rystad Energy warn that confidence in the underlying truce has weakened considerably.
This chart is presented for general informational purposes only and does not constitute financial, investment, tax, or legal advice. Figures reflect the source and period indicated and may no longer be current.

Related charts
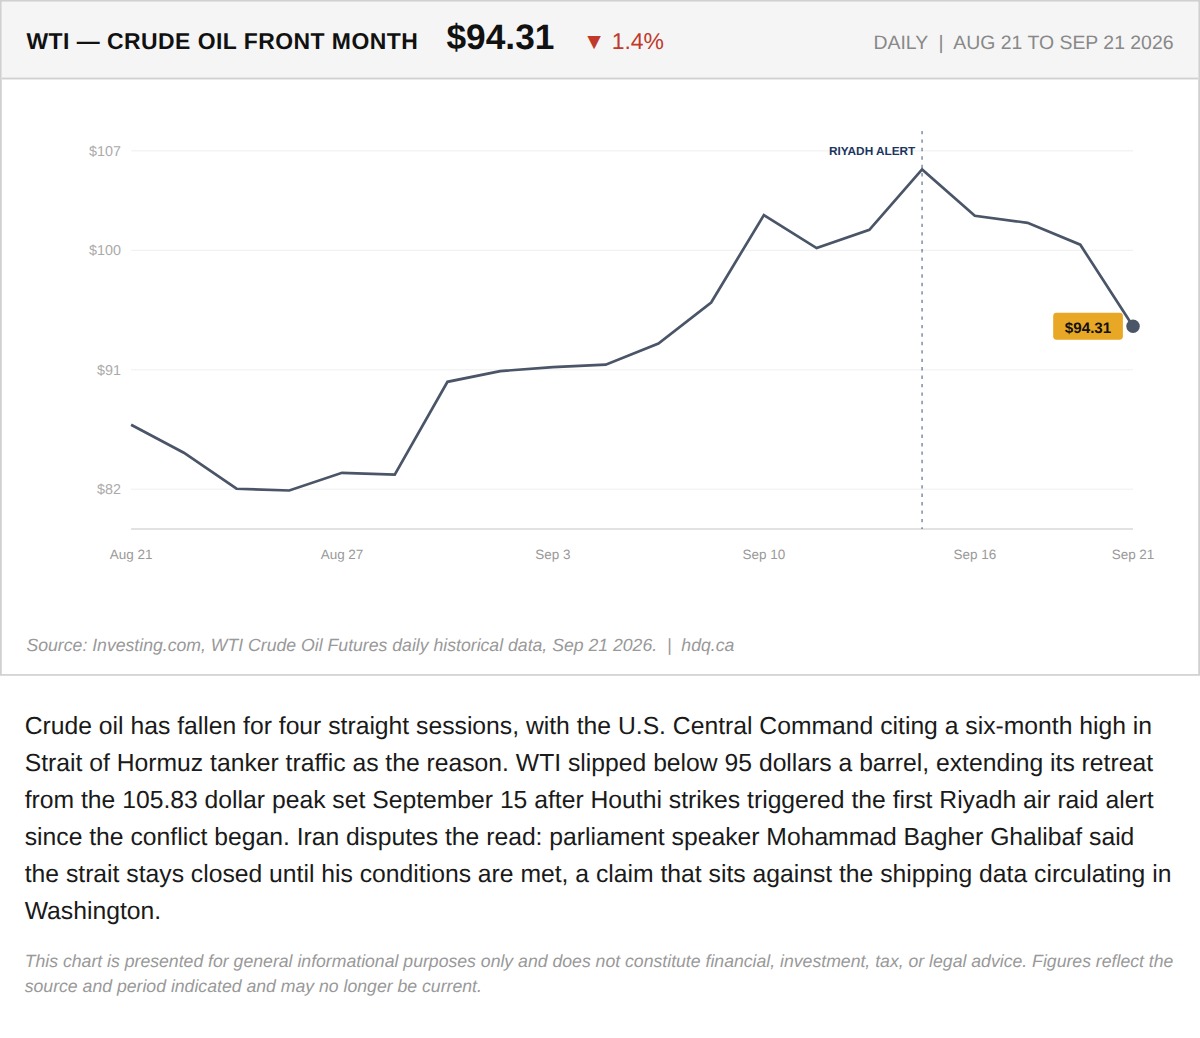
Crude oil has fallen for four straight sessions, with the U.S.
Oil Falls for a Fourth Session as Hormuz Shipping Data Is Disputed
September 21, 2026
View chart & download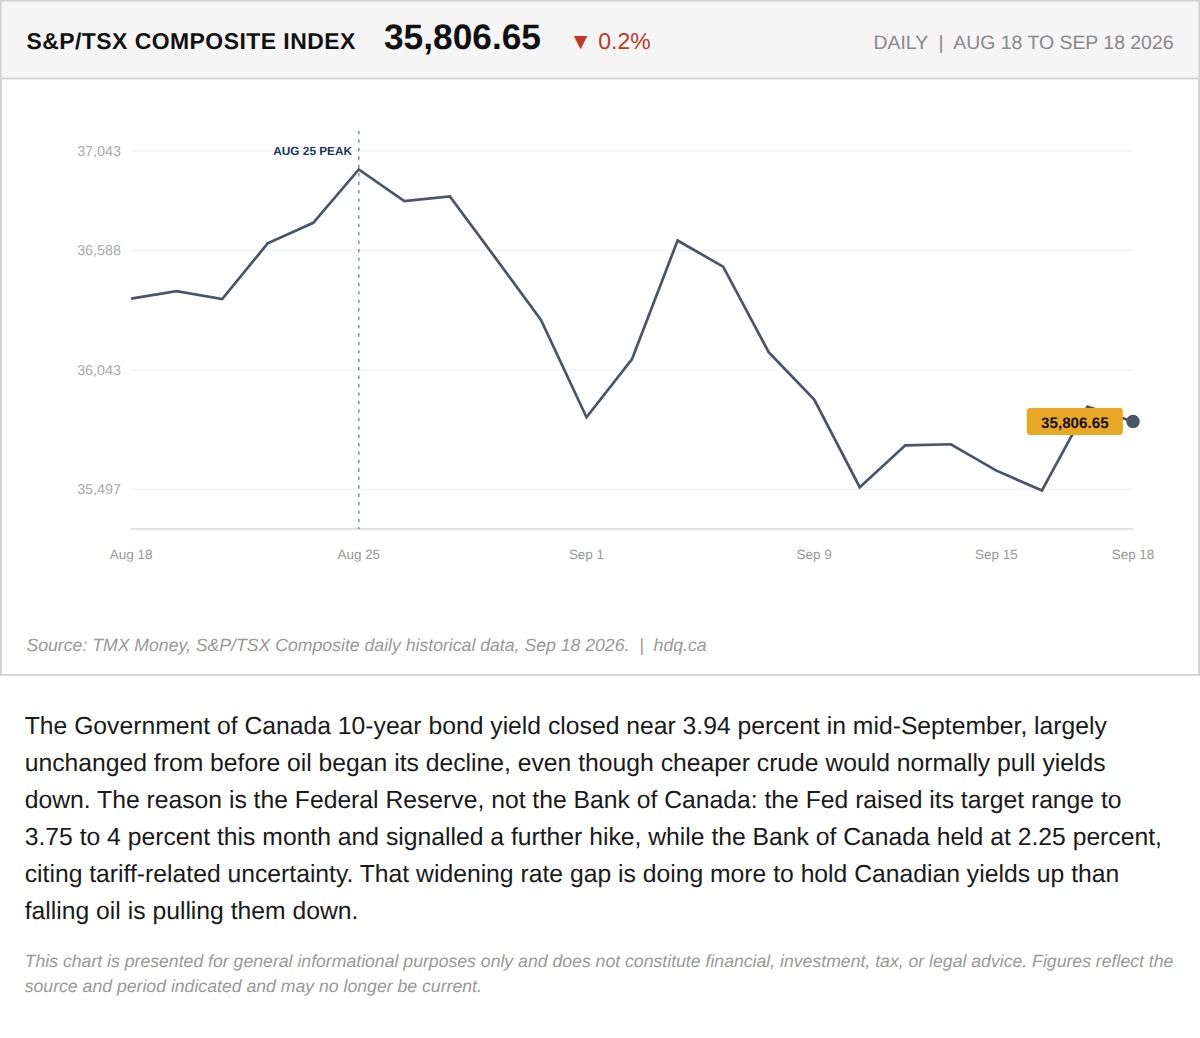
The Government of Canada 10-year bond yield closed near 3.94 percent in mid-September, largely unchanged from before oil began its decline,…
TSX Slides as Canadian Bond Yields Stay Elevated Despite Falling Oil
September 21, 2026
View chart & download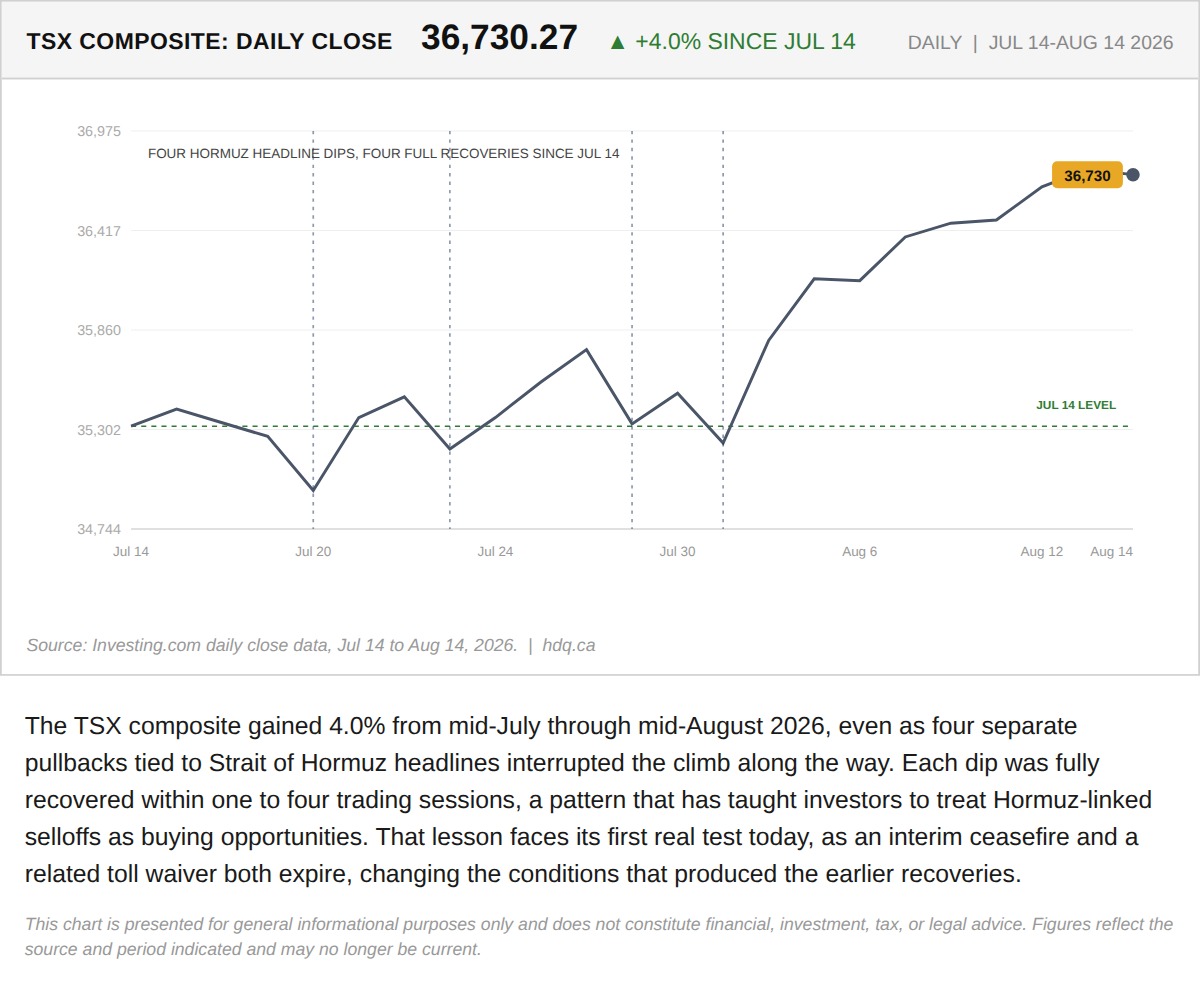
The TSX composite gained 4.0% from mid-July through mid-August 2026, even as four separate pullbacks tied to Strait of Hormuz headlines interrupted the climb along the way.
Four Hormuz Dips Recovered in a Month. Today Tests Whether the Pattern Holds.
August 17, 2026
View chart & download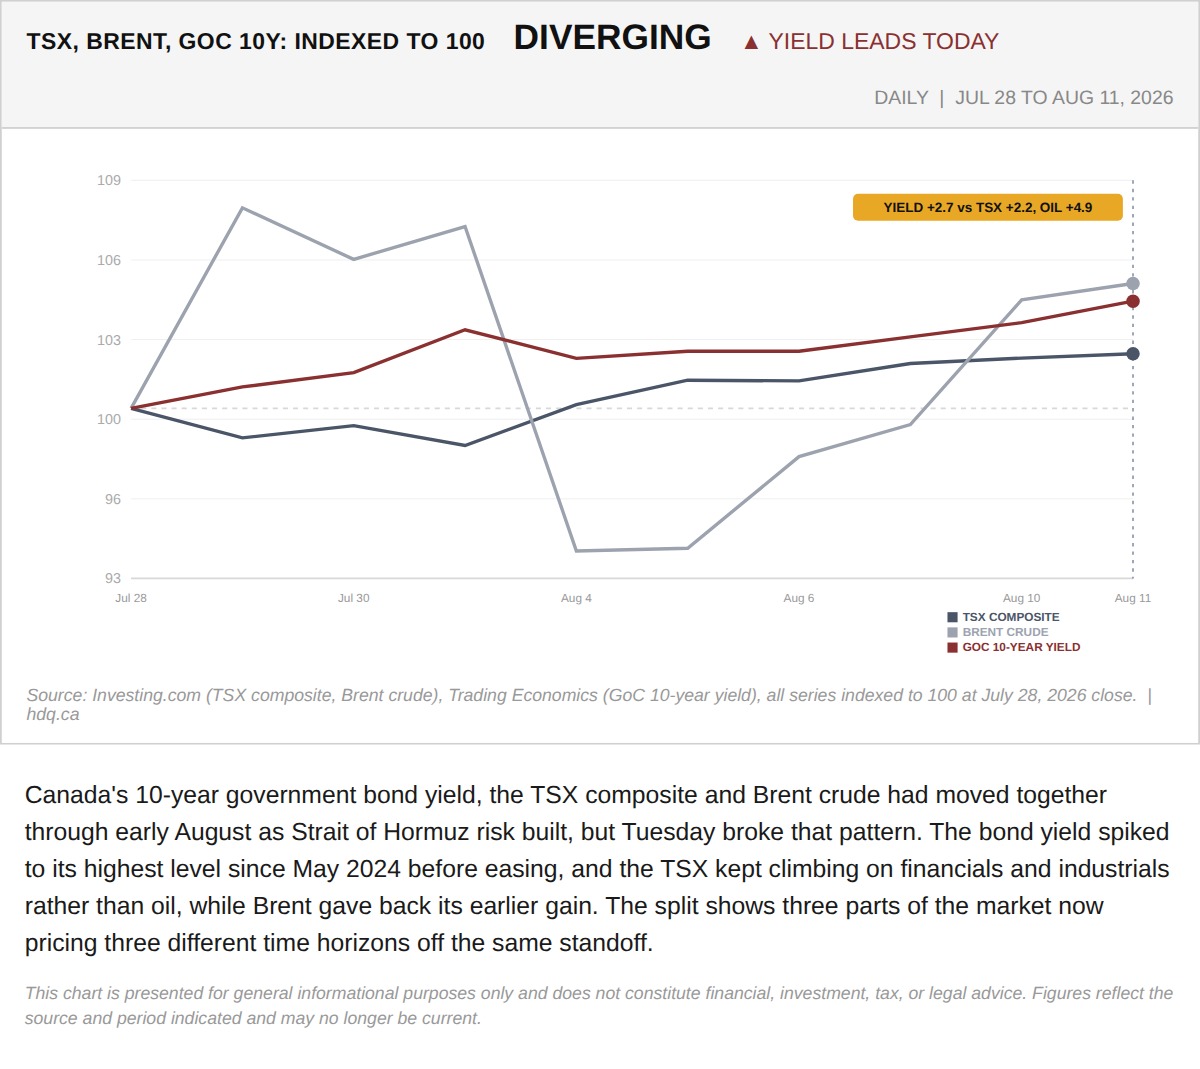
Canada's 10-year government bond yield, the TSX composite and Brent crude had moved together through early August as Strait of Hormuz risk built, but Tuesday broke that pattern.
TSX, Brent and Canada's 10-Year Yield Diverge
August 11, 2026
View chart & download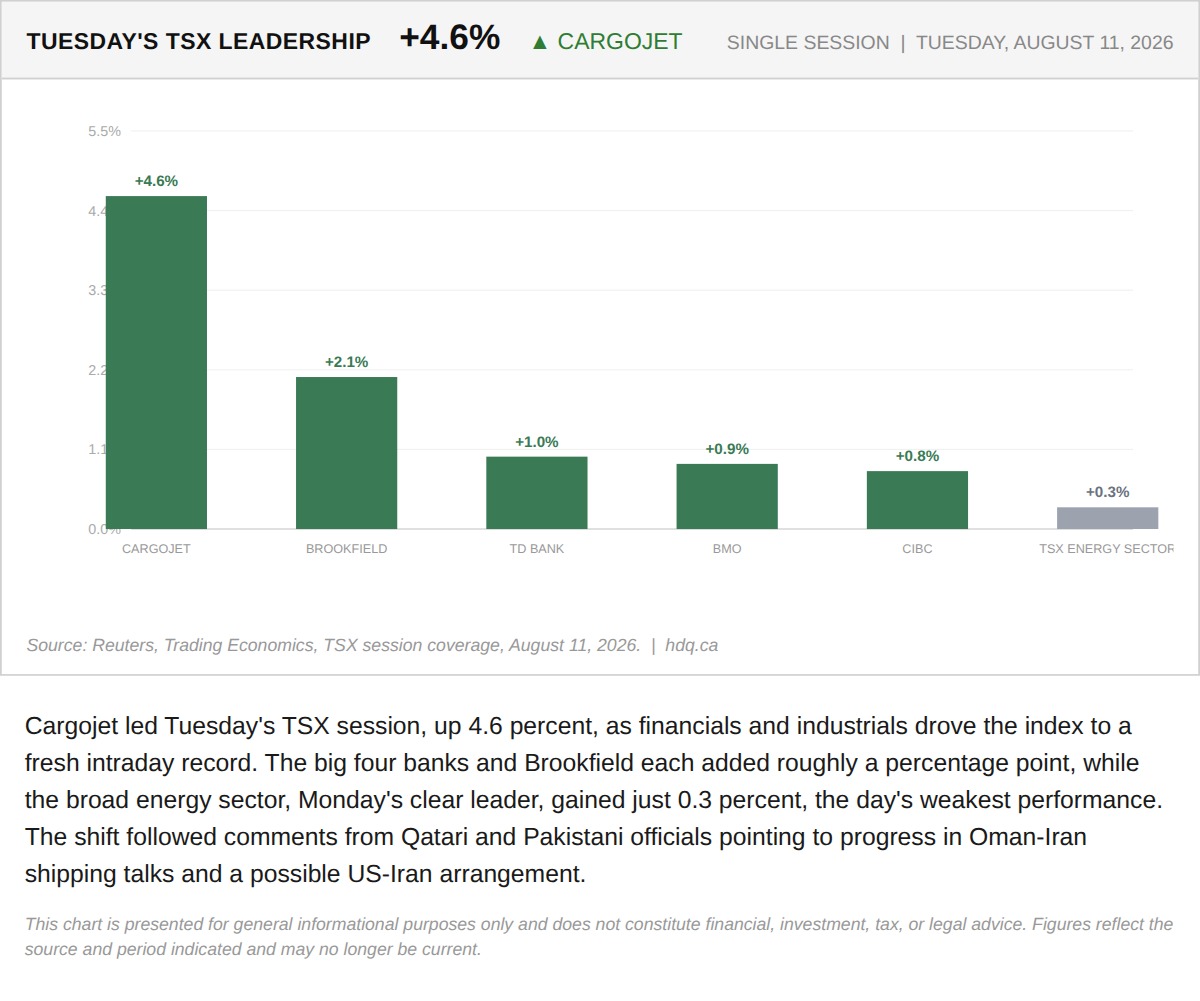
Cargojet led Tuesday's TSX session, up 4.6 percent, as financials and industrials drove the index to a fresh intraday record.
Cargojet Leads Tuesday's TSX as Energy Lags
August 11, 2026
View chart & download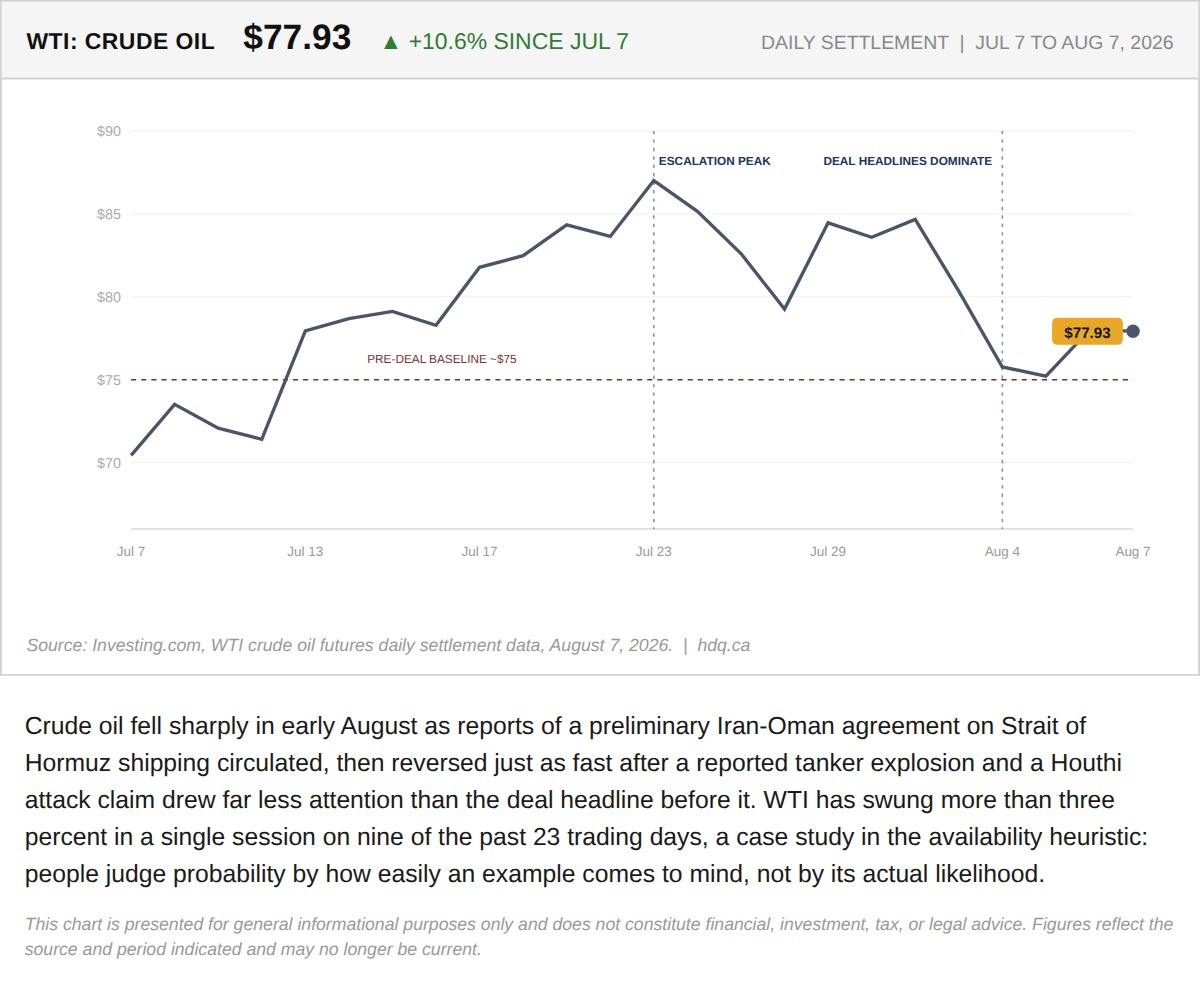
Crude oil fell sharply in early August as reports of a preliminary Iran-Oman agreement on Strait of Hormuz shipping circulated, then…
WTI Swung More Than 10% in a Week on Headlines the Availability Heuristic Explains
August 7, 2026
View chart & download