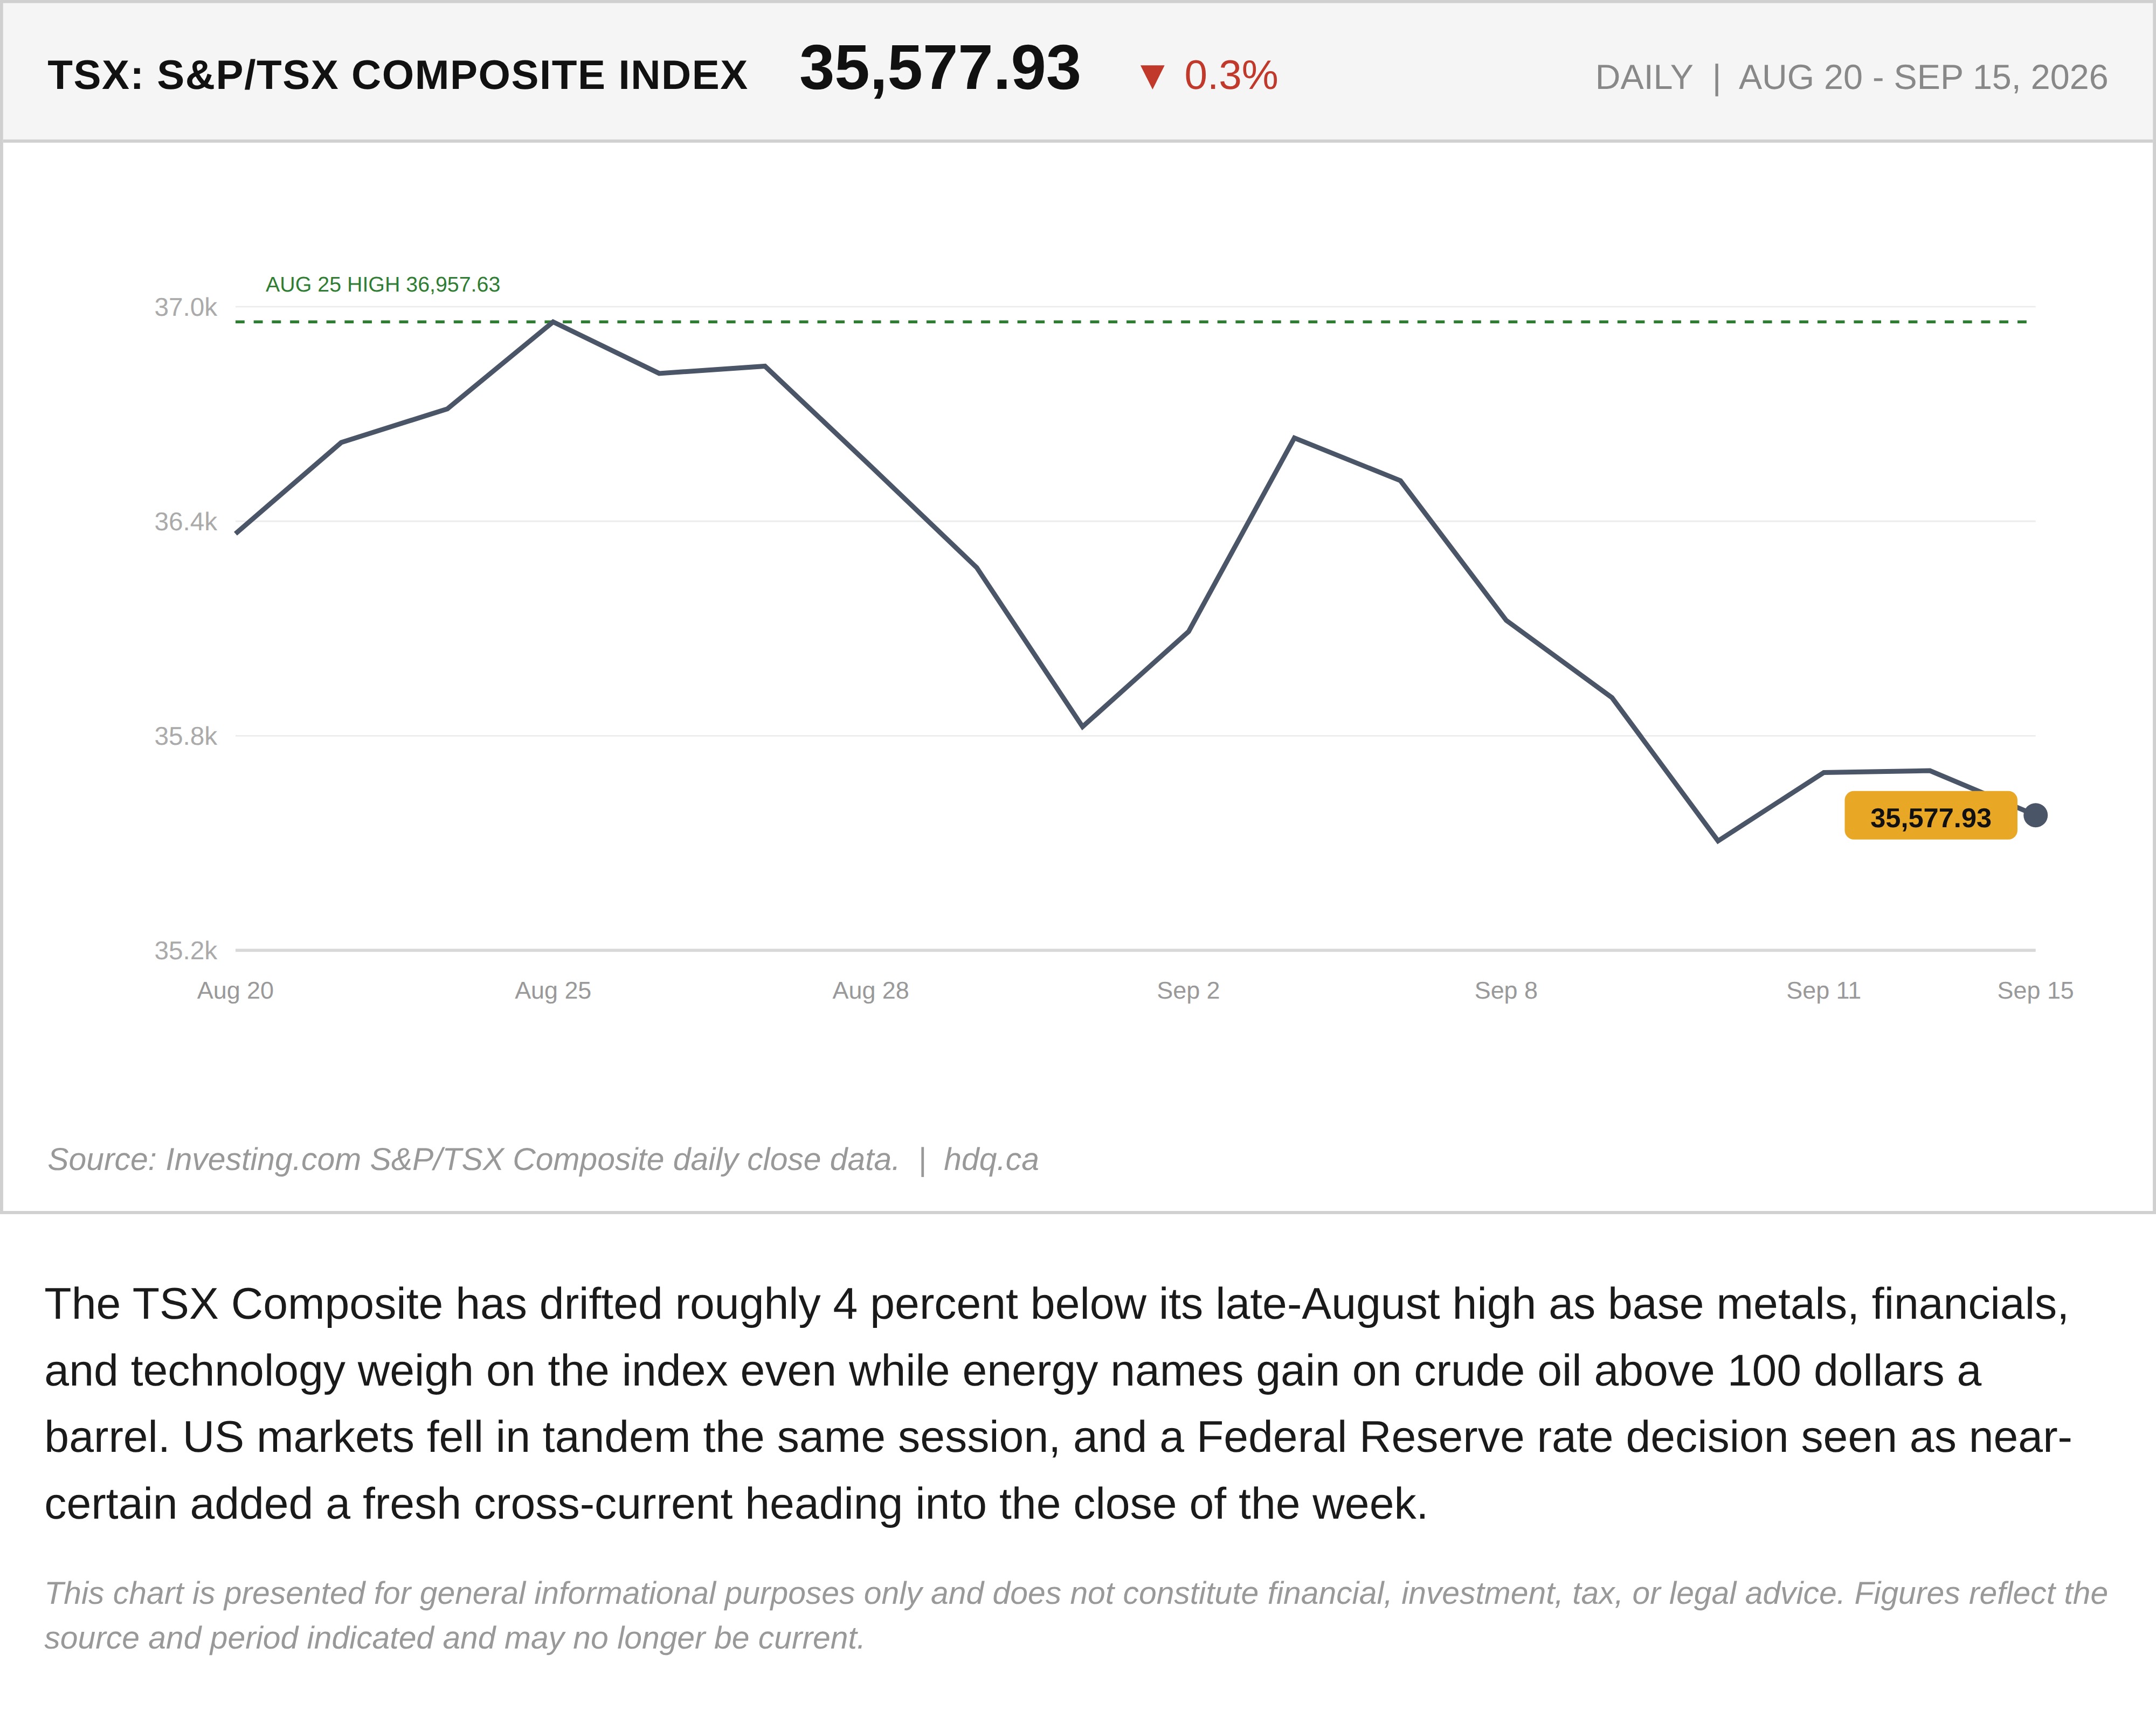
The TSX Composite has drifted roughly 4 percent below its late-August high as base metals, financials, and technology weigh on the index even while energy names gain on crude oil above 100 dollars a barrel. US markets fell in tandem the same session, and a Federal Reserve rate decision seen as near-certain added a fresh cross-current heading into the close of the week.
This chart is presented for general informational purposes only and does not constitute financial, investment, tax, or legal advice. Figures reflect the source and period indicated and may no longer be current.
Related charts
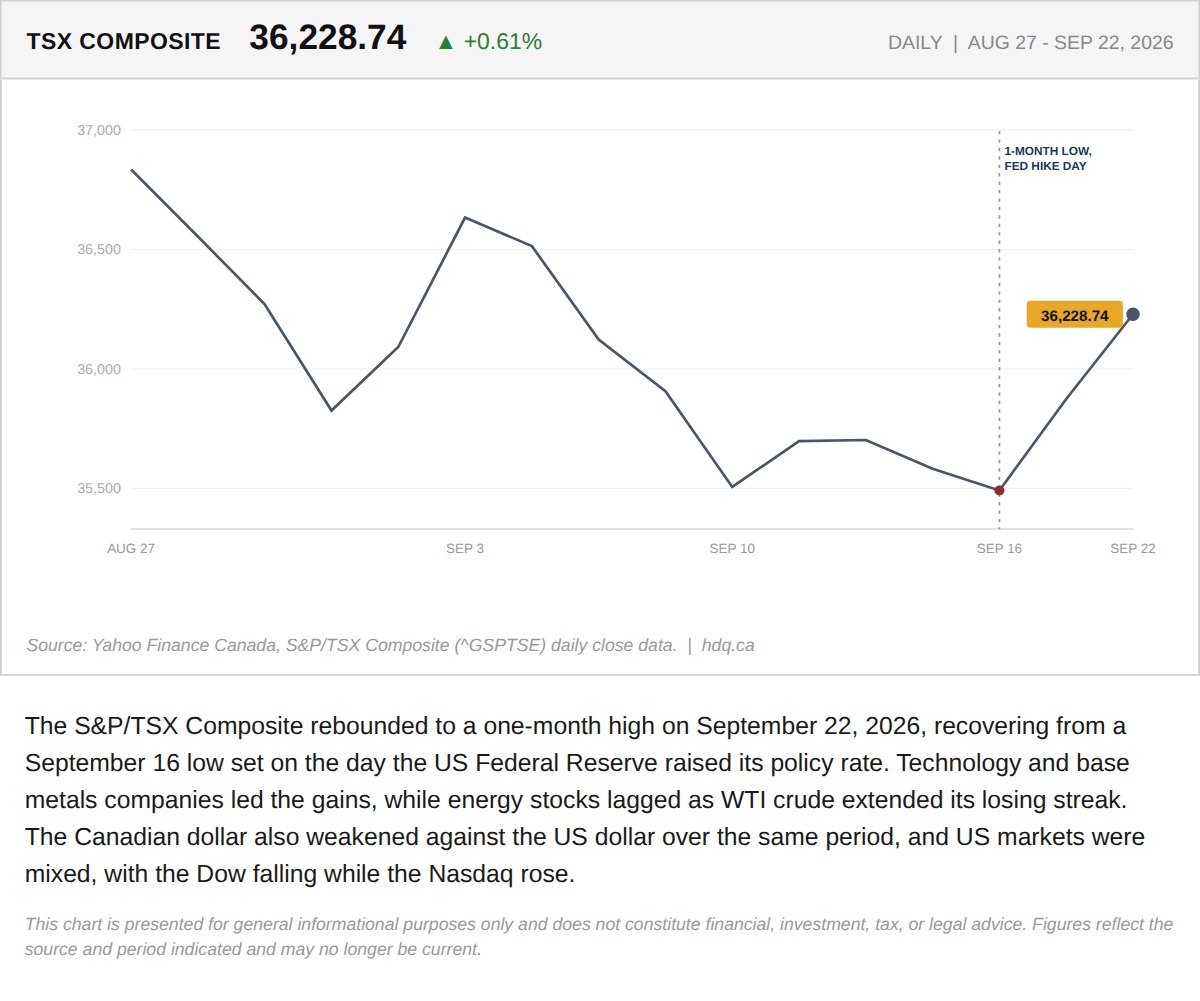
The S&P/TSX Composite rebounded to a one-month high on September 22, 2026, recovering from a September 16 low set on the day the US Federal Reserve raised its policy rate.
The TSX Hit a One-Month High on Tech and Base Metals While Energy Keeps Falling
September 23, 2026
View chart & download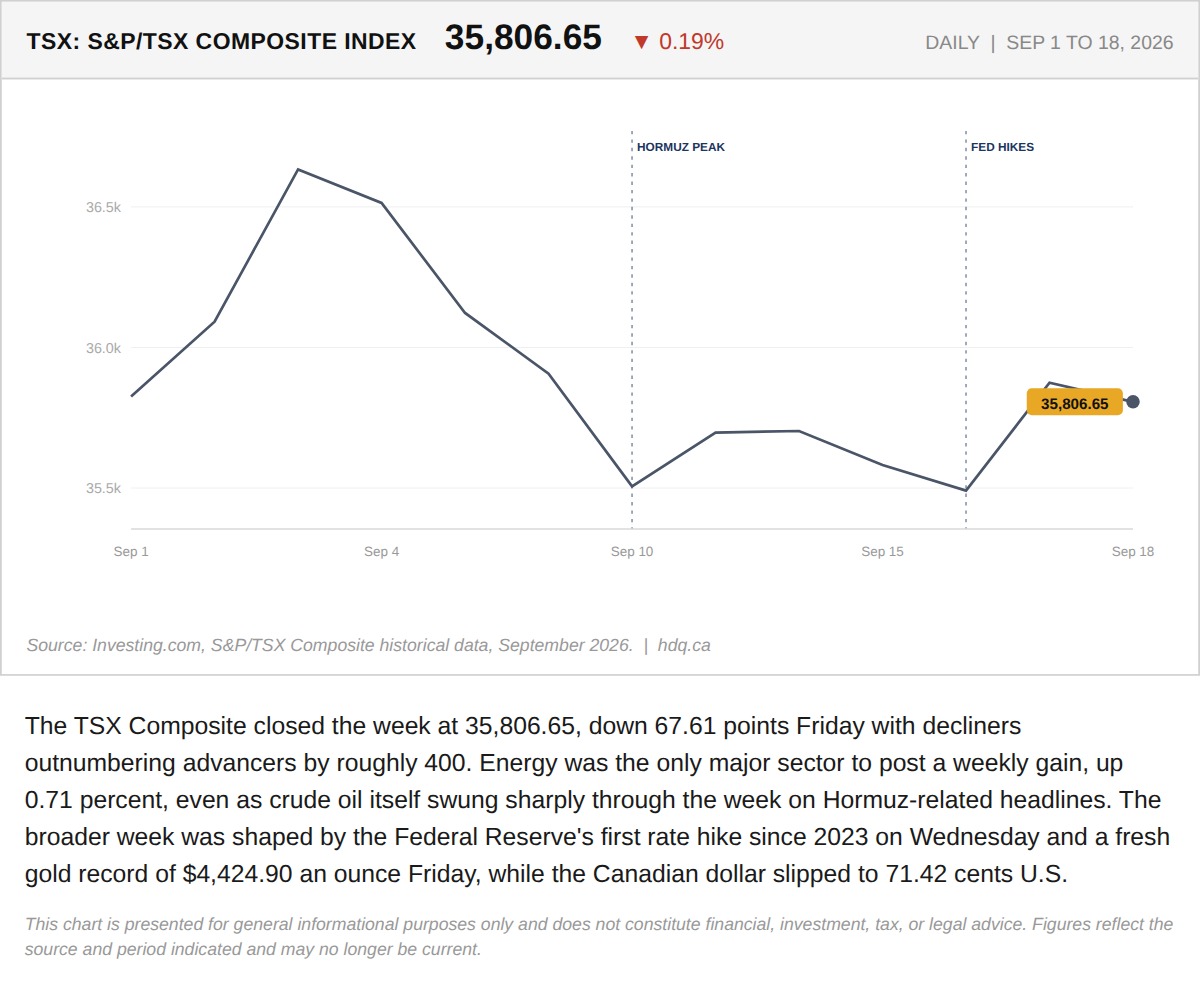
The TSX Composite closed the week at 35,806.65, down 67.61 points Friday with decliners outnumbering advancers by roughly 400.
The TSX Closed a Volatile Week at 35,806.65. Energy Was the Only Sector That Actually Held.
September 21, 2026
View chart & download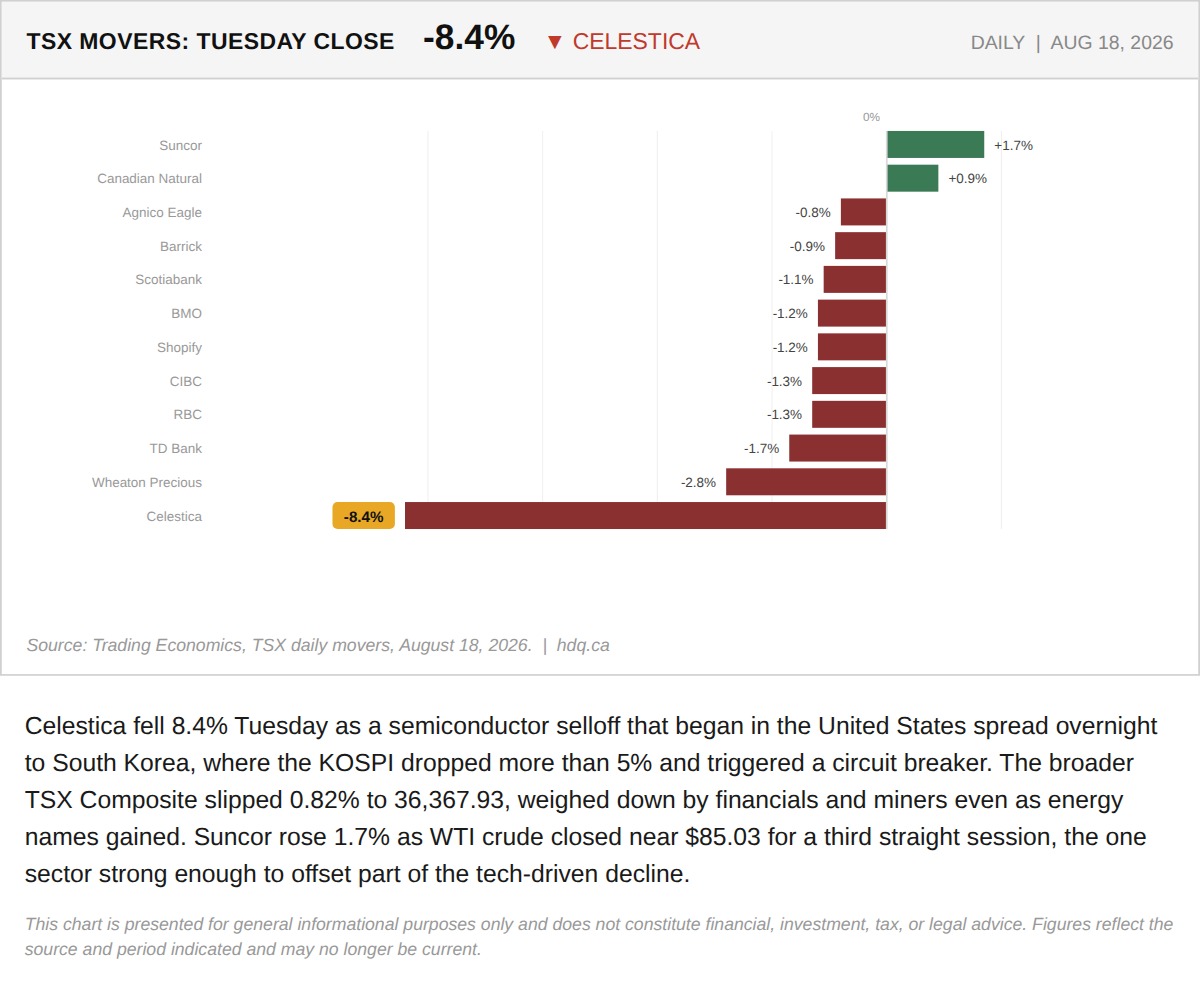
Celestica fell 8.4% Tuesday as a semiconductor selloff that began in the United States spread overnight to South Korea, where the KOSPI…
The TSX Fell 0.82 Percent Tuesday. Celestica Fell 8.4 Percent. That Gap Is the Real Story.
August 19, 2026
View chart & download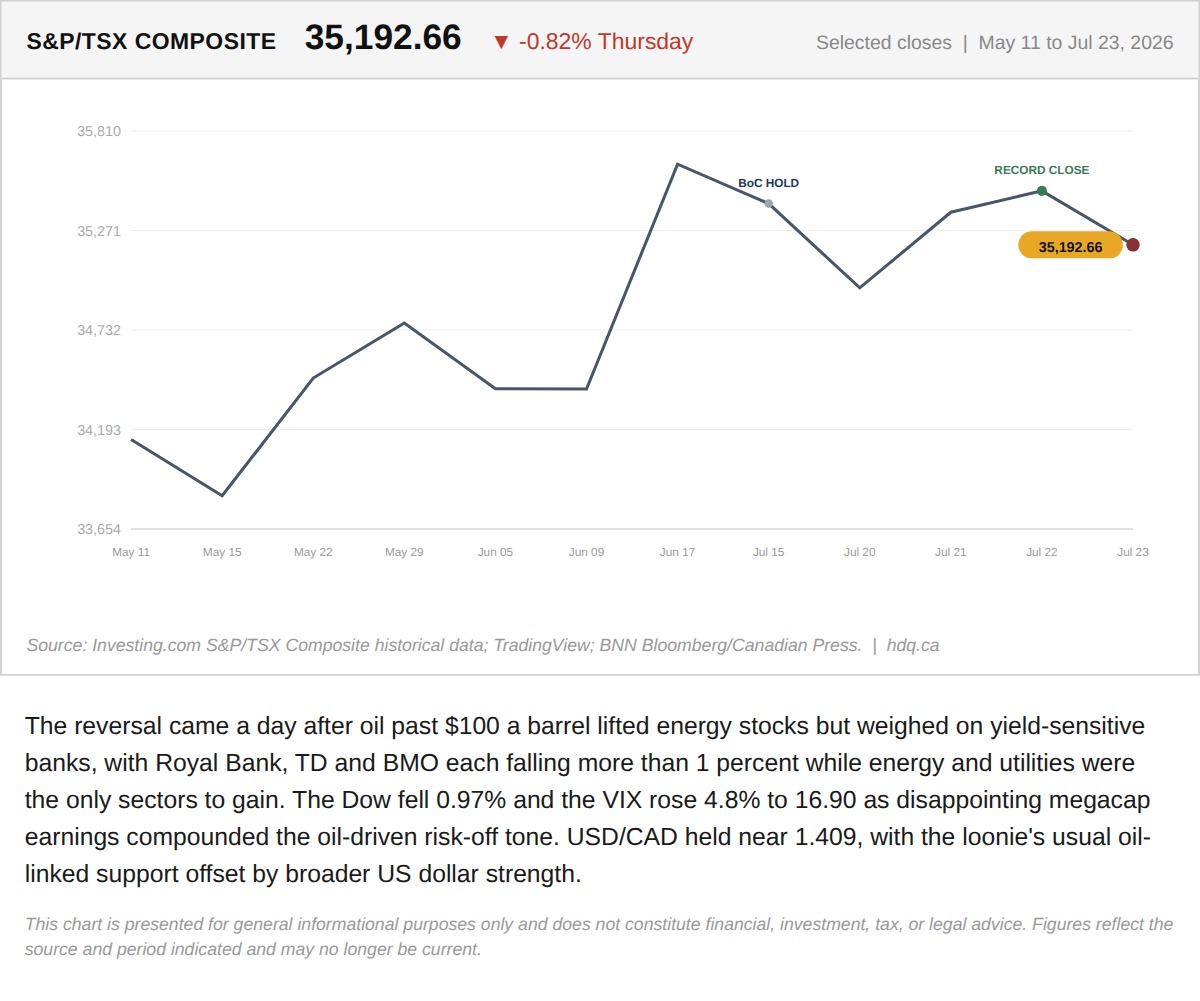
The reversal came a day after oil past $100 a barrel lifted energy stocks but weighed on yield-sensitive banks, with Royal Bank, TD and BMO…
Record High, Then a Bank-Led Reversal: Inside Thursday's TSX Split
July 24, 2026
View chart & download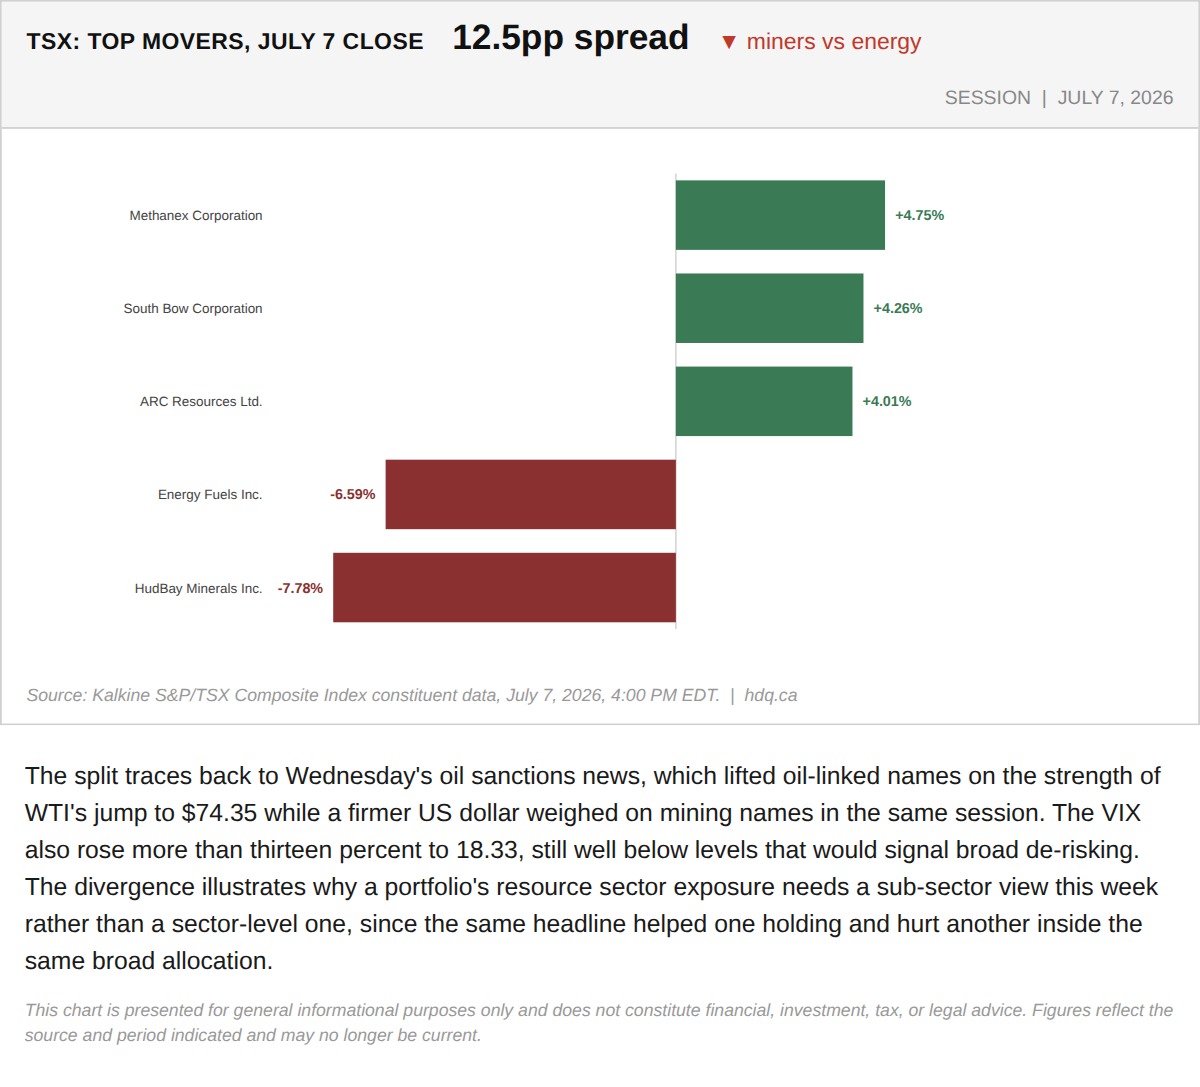
The split traces back to Wednesday's oil sanctions news, which lifted oil-linked names on the strength of WTI's jump to $74.35 while a…
July 8, 2026
View chart & download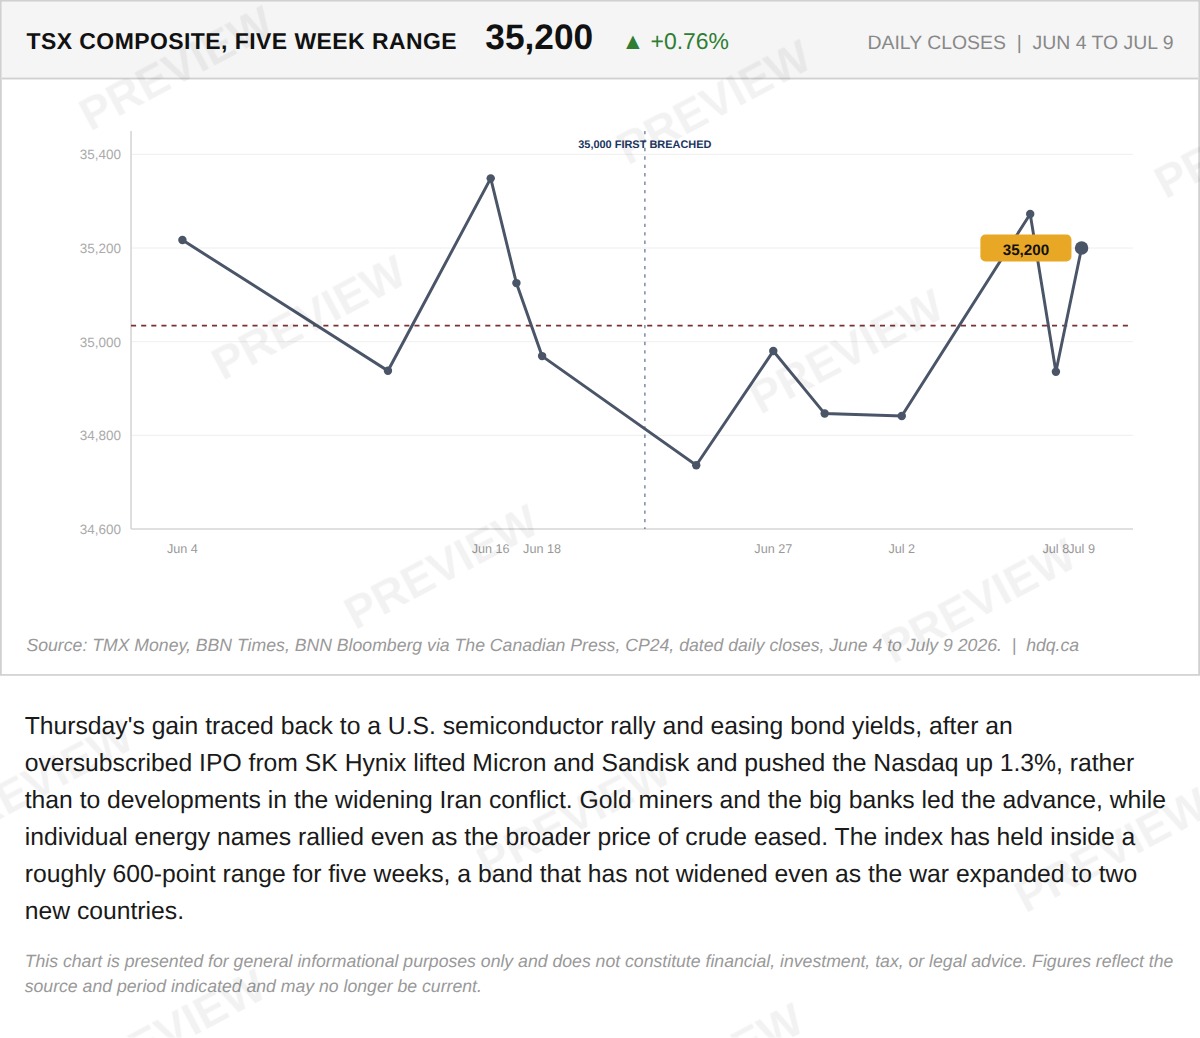
Thursday's gain traced back to a U.S.
The TSX Closed Near a Five-Week High. The War Had Little to Do With It.
July 10, 2026
View chart & download