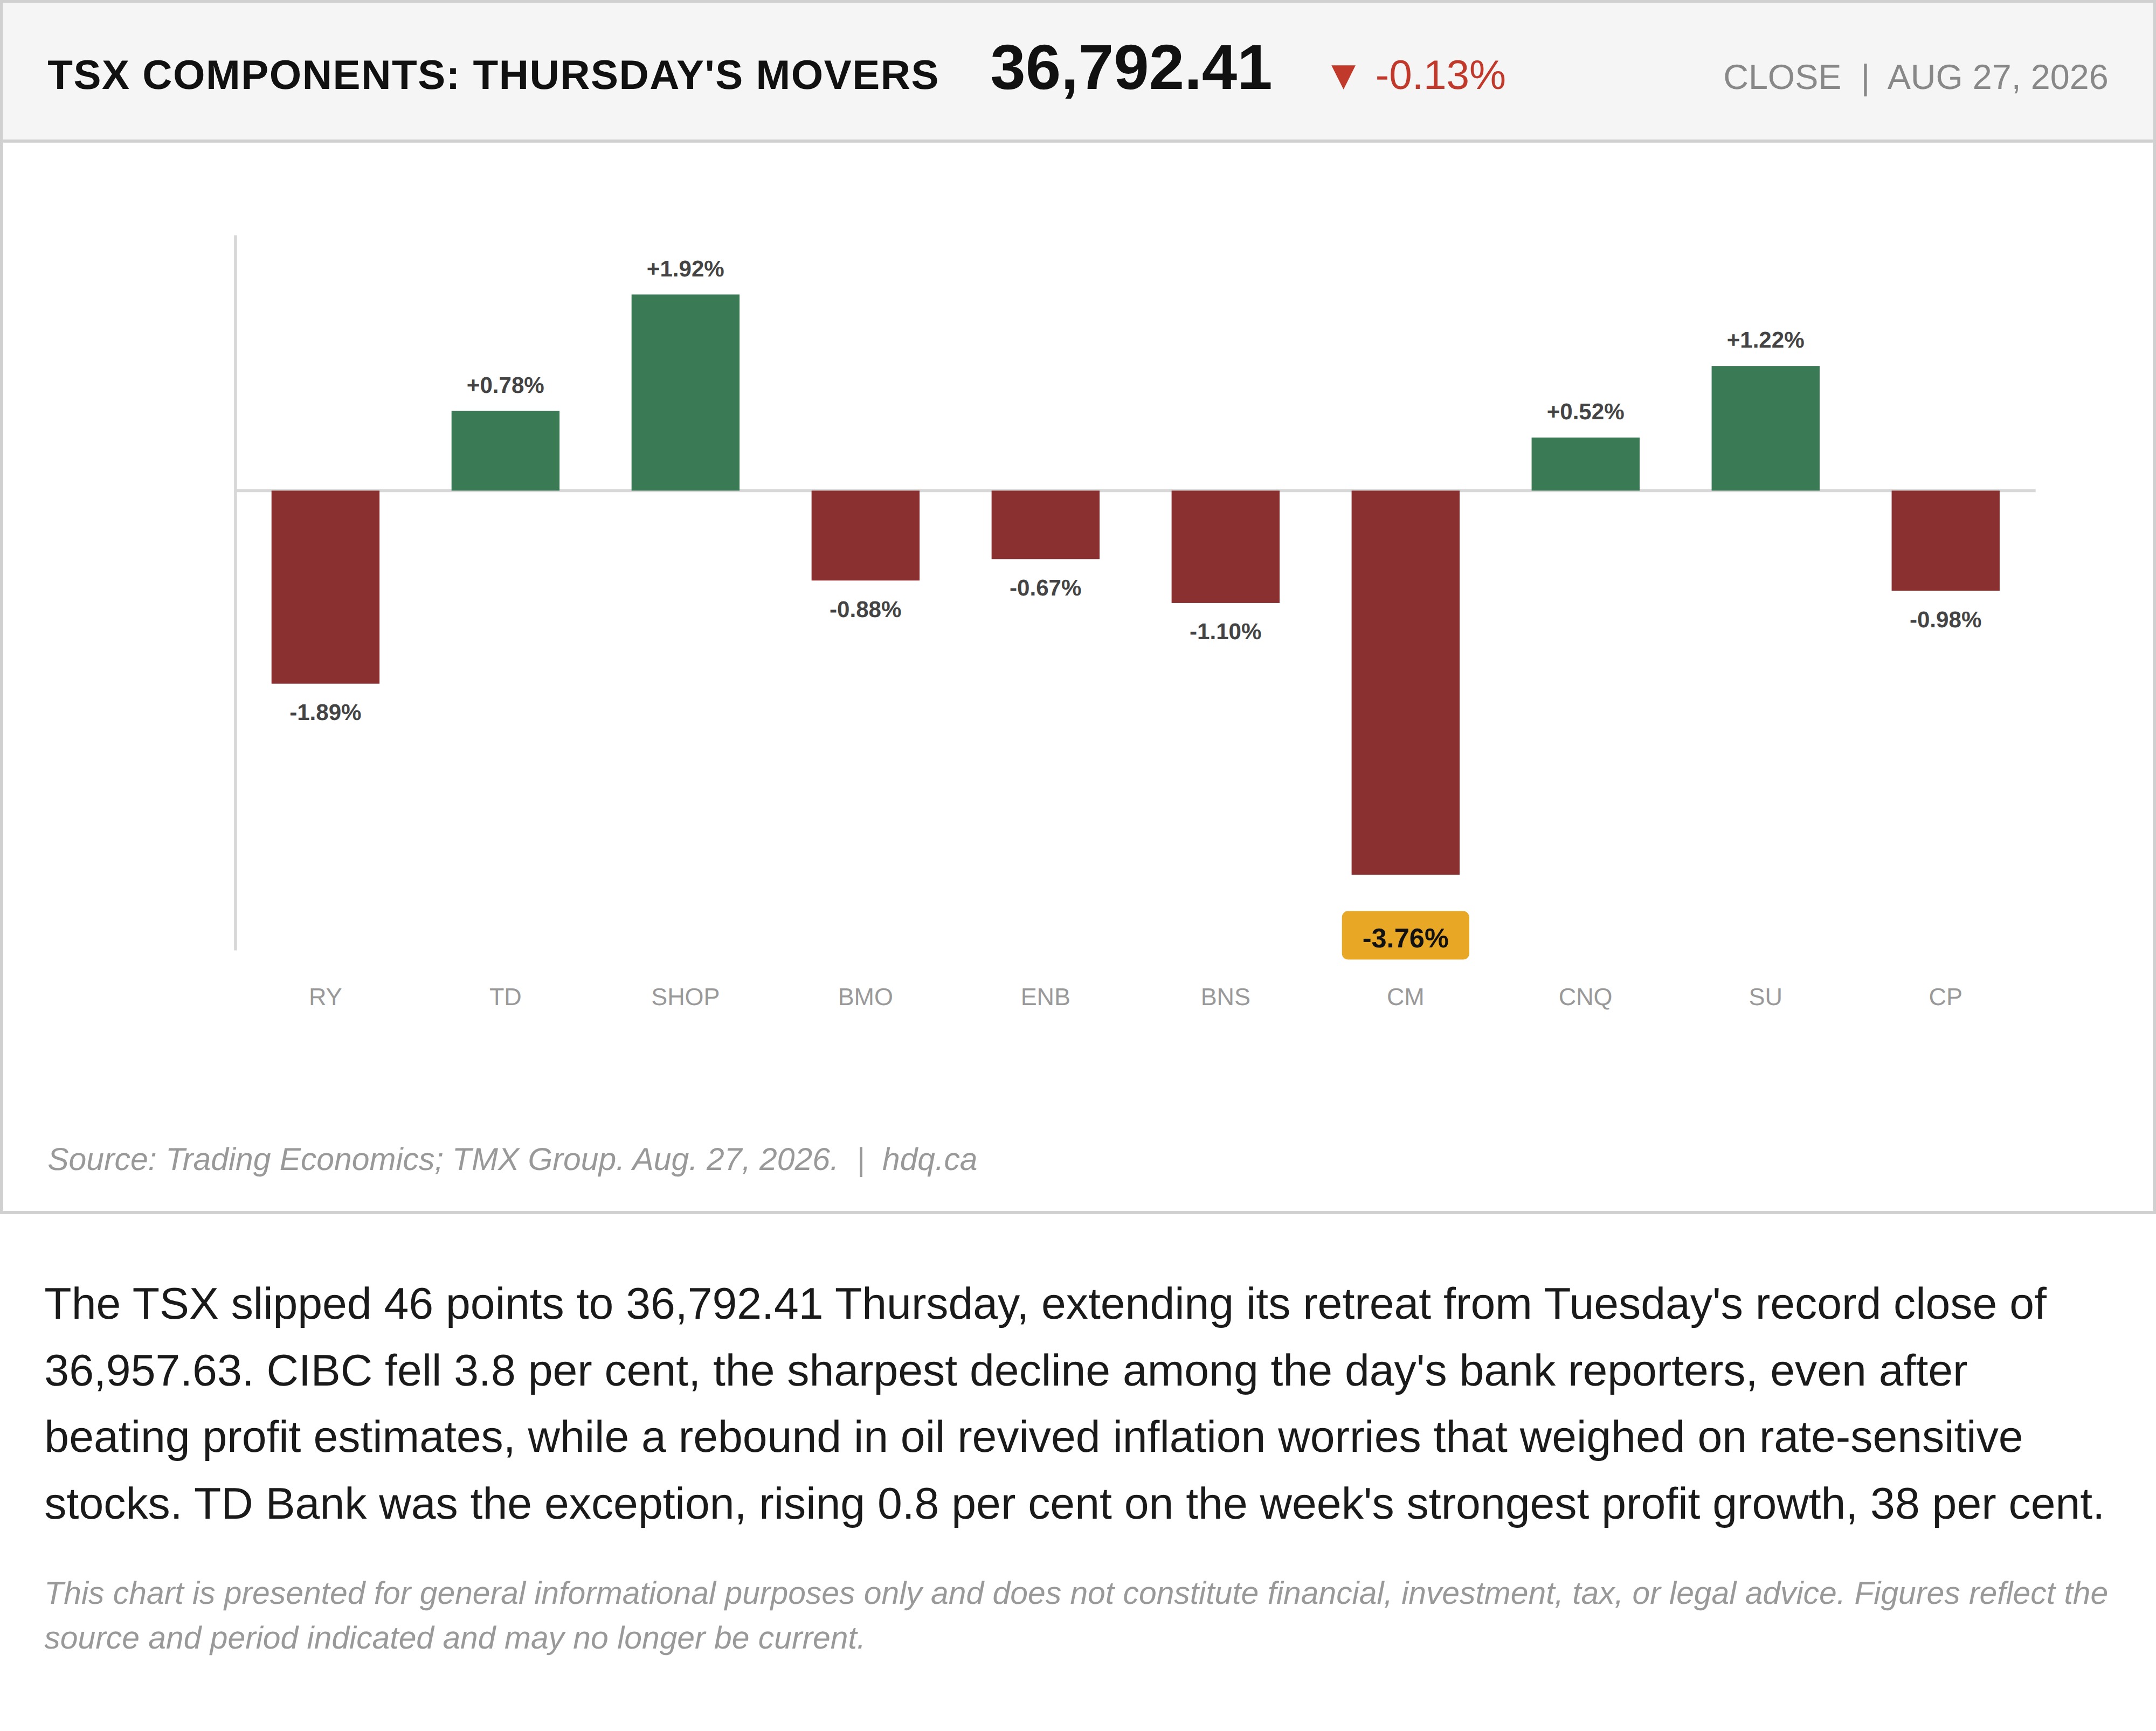
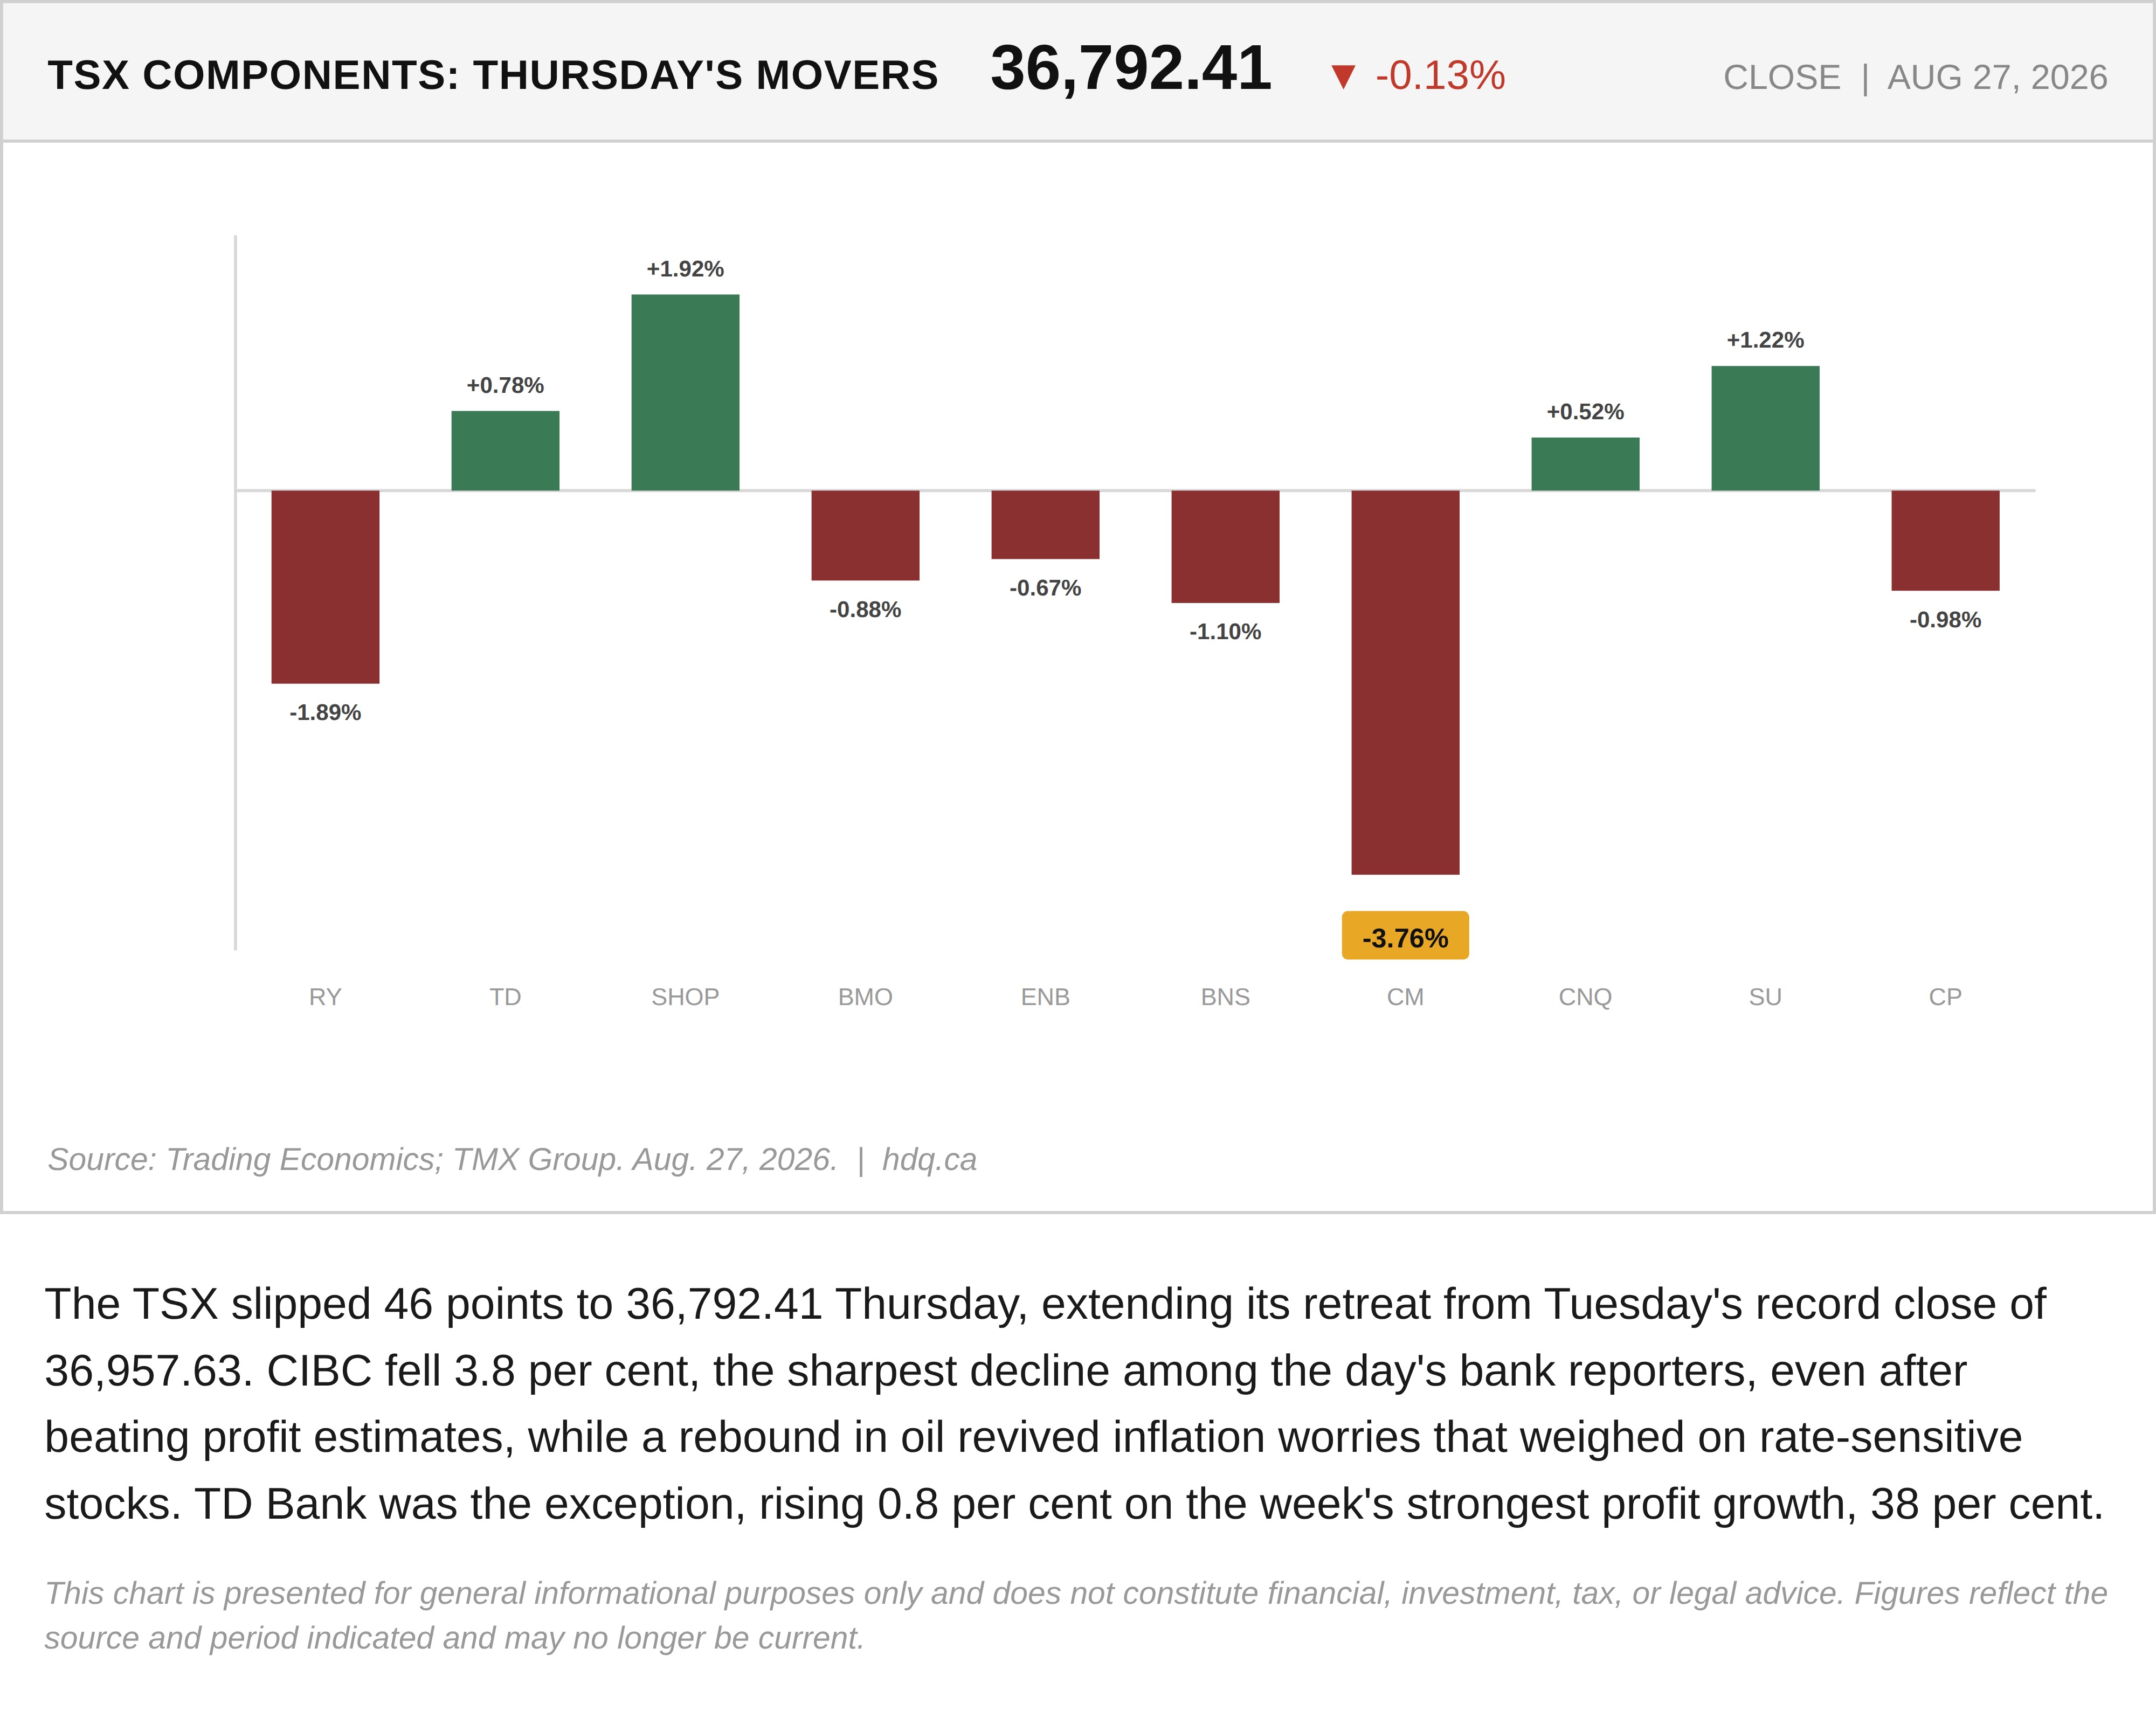
The TSX slipped 46 points to 36,792.41 Thursday, extending its retreat from Tuesday's record close of 36,957.63. CIBC fell 3.8 per cent, the sharpest decline among the day's bank reporters, even after beating profit estimates, while a rebound in oil revived inflation worries that weighed on rate-sensitive stocks. TD Bank was the exception, rising 0.8 per cent on the week's strongest profit growth, 38 per cent.
This chart is presented for general informational purposes only and does not constitute financial, investment, tax, or legal advice. Figures reflect the source and period indicated and may no longer be current.
Related charts
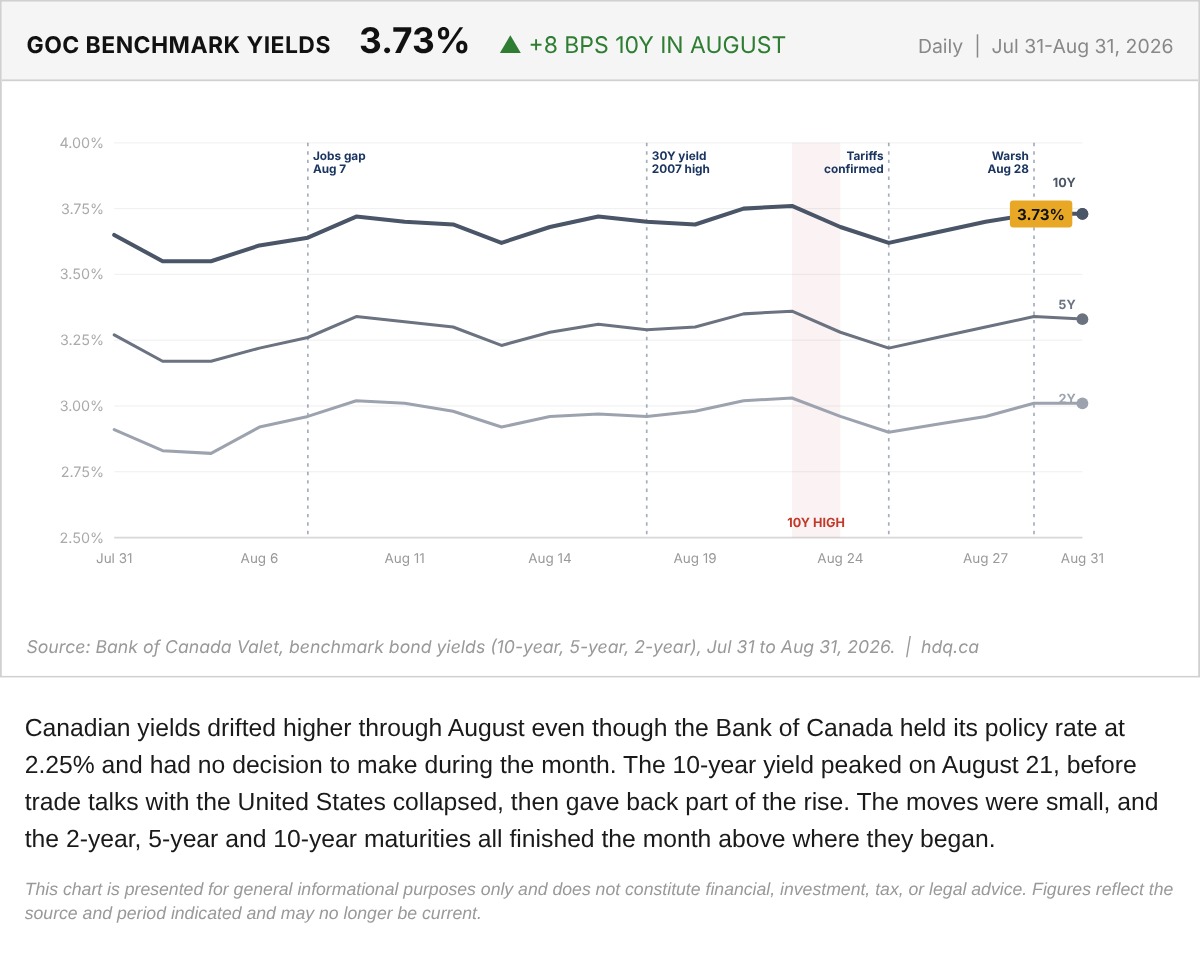
Canadian yields drifted higher through August even though the Bank of Canada held its policy rate at 2.25% and had no decision to make during the month.
Government of Canada Benchmark Yields, August 2026
August 31, 2026
View chart & download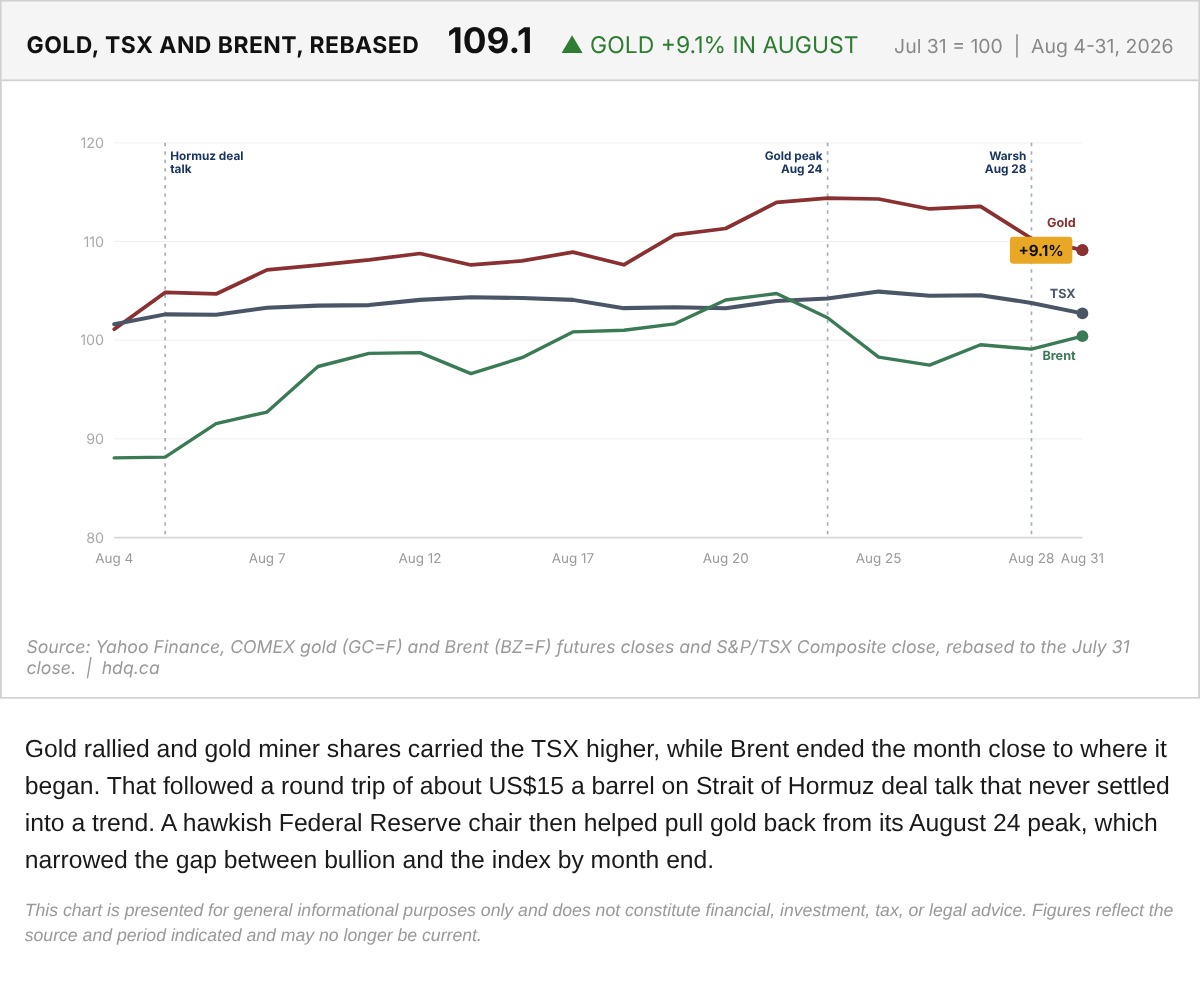
Gold rallied and gold miner shares carried the TSX higher, while Brent ended the month close to where it began.
Gold, TSX and Brent Rebased to the July 31 Close
August 31, 2026
View chart & download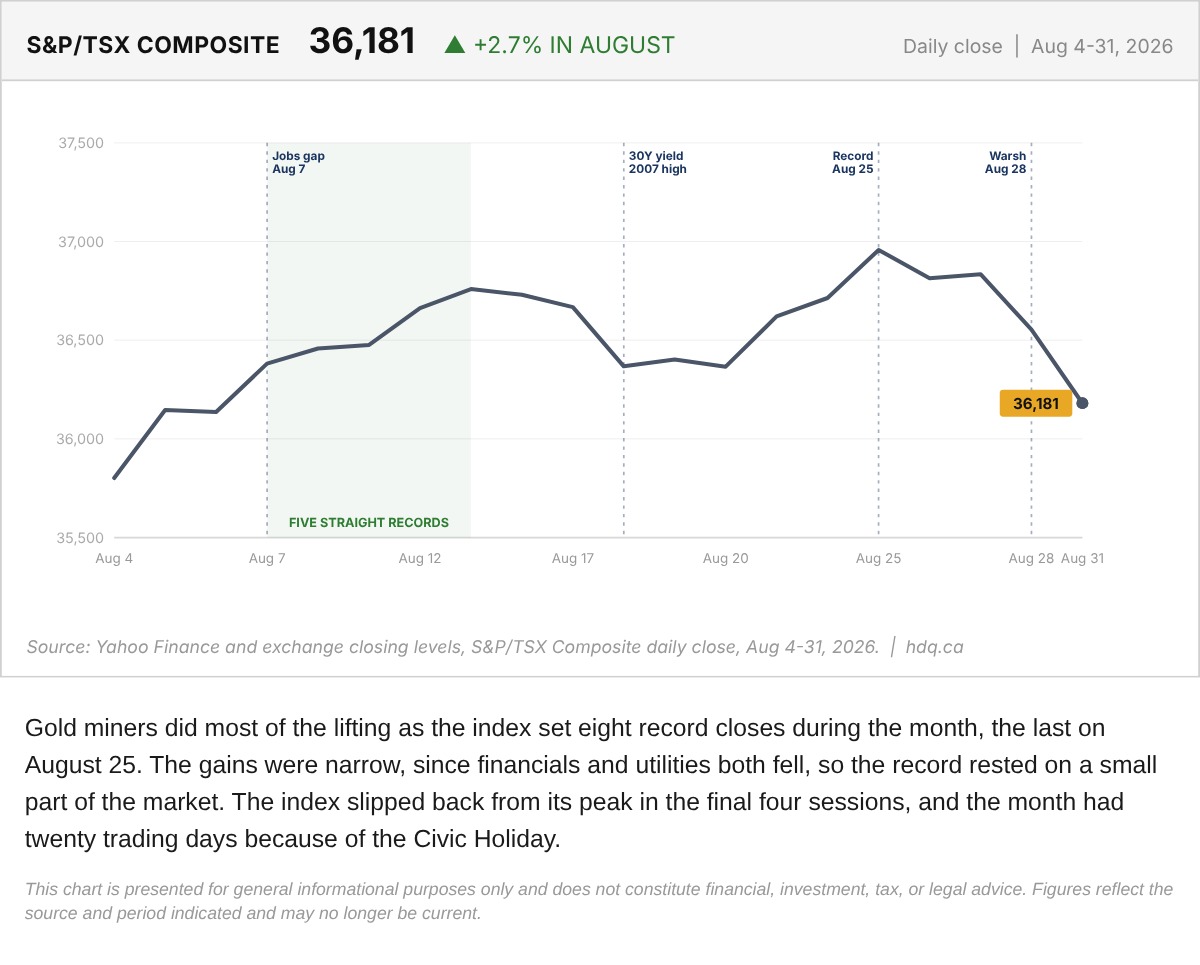
Gold miners did most of the lifting as the index set eight record closes during the month, the last on August 25.
S&P/TSX Composite Daily Close Through August 2026
August 31, 2026
View chart & download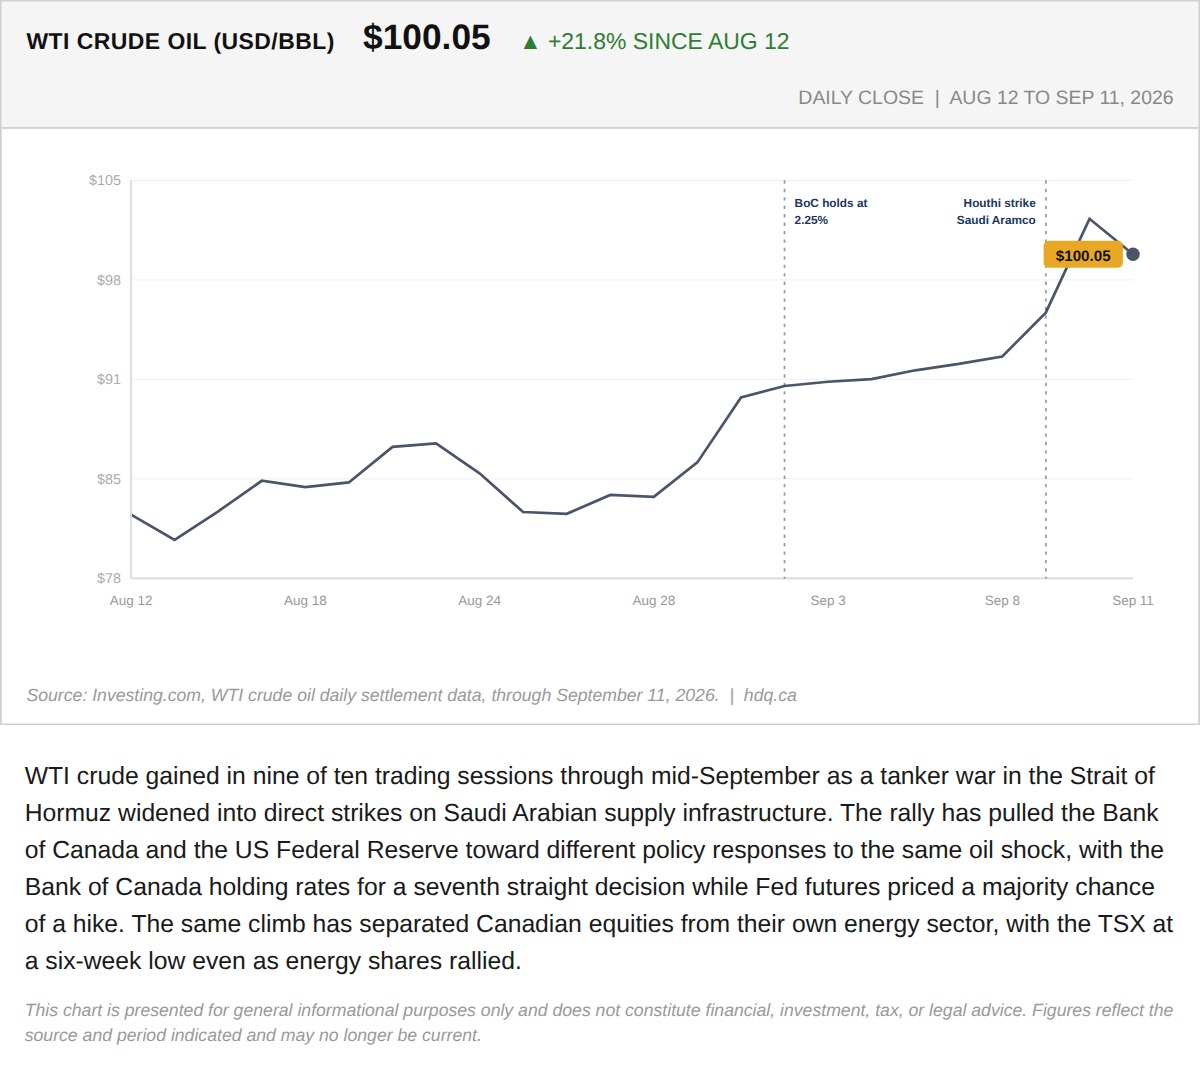
WTI crude gained in nine of ten trading sessions through mid-September as a tanker war in the Strait of Hormuz widened into direct strikes on Saudi Arabian supply infrastructure.
The Week the Same Barrel of Oil Split the BoC From the Fed and the TSX From Its Own Energy Sector
September 12, 2026
View chart & download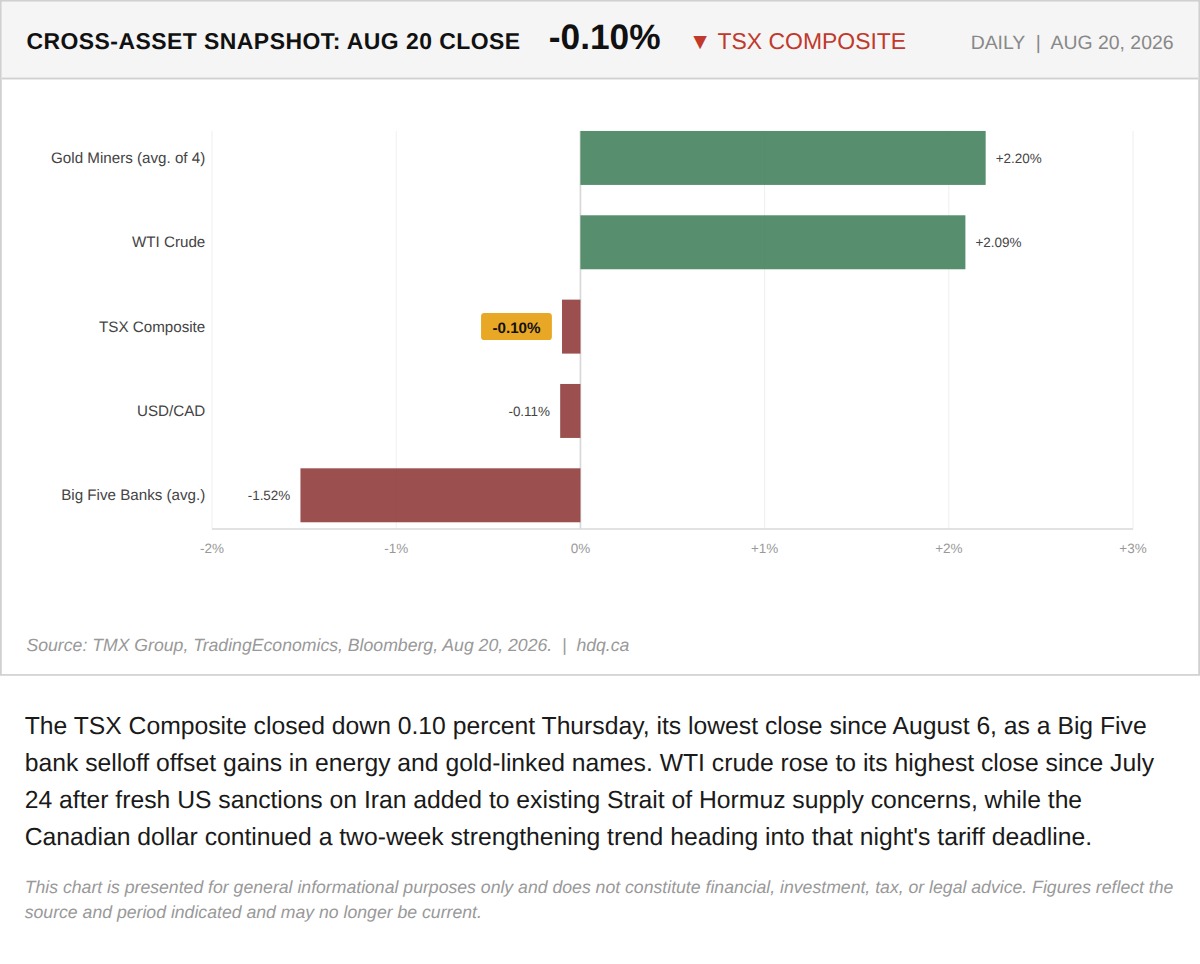
The TSX Composite closed down 0.10 percent Thursday, its lowest close since August 6, as a Big Five bank selloff offset gains in energy and gold-linked names.
TSX Closes Flat as Bank Selloff Offsets Energy and Gold Gains
August 21, 2026
View chart & download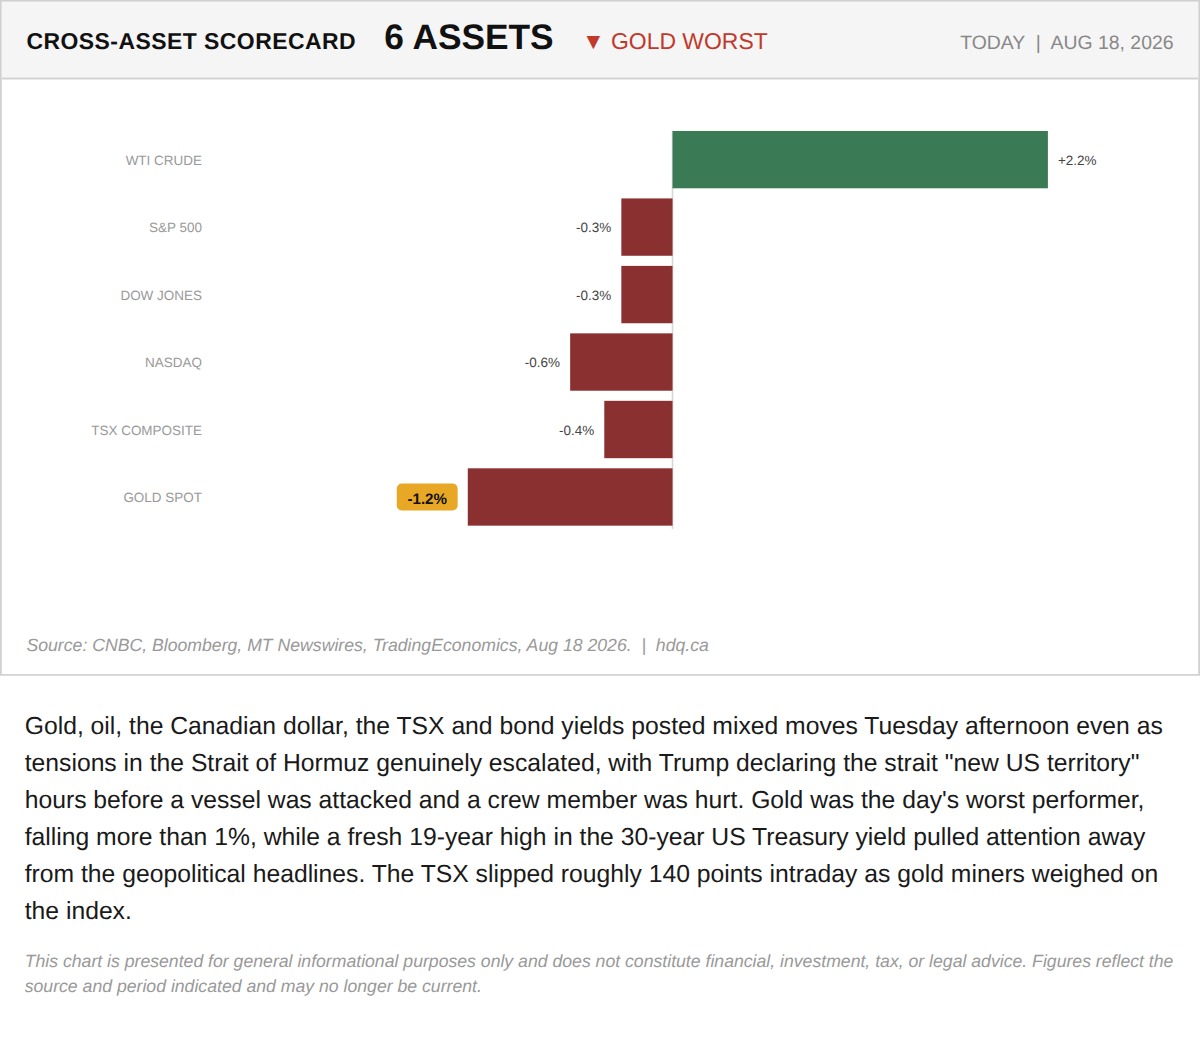
Gold, oil, the Canadian dollar, the TSX and bond yields posted mixed moves Tuesday afternoon even as tensions in the Strait of Hormuz…
Cross-Asset Scorecard as Hormuz Escalates
August 18, 2026
View chart & download