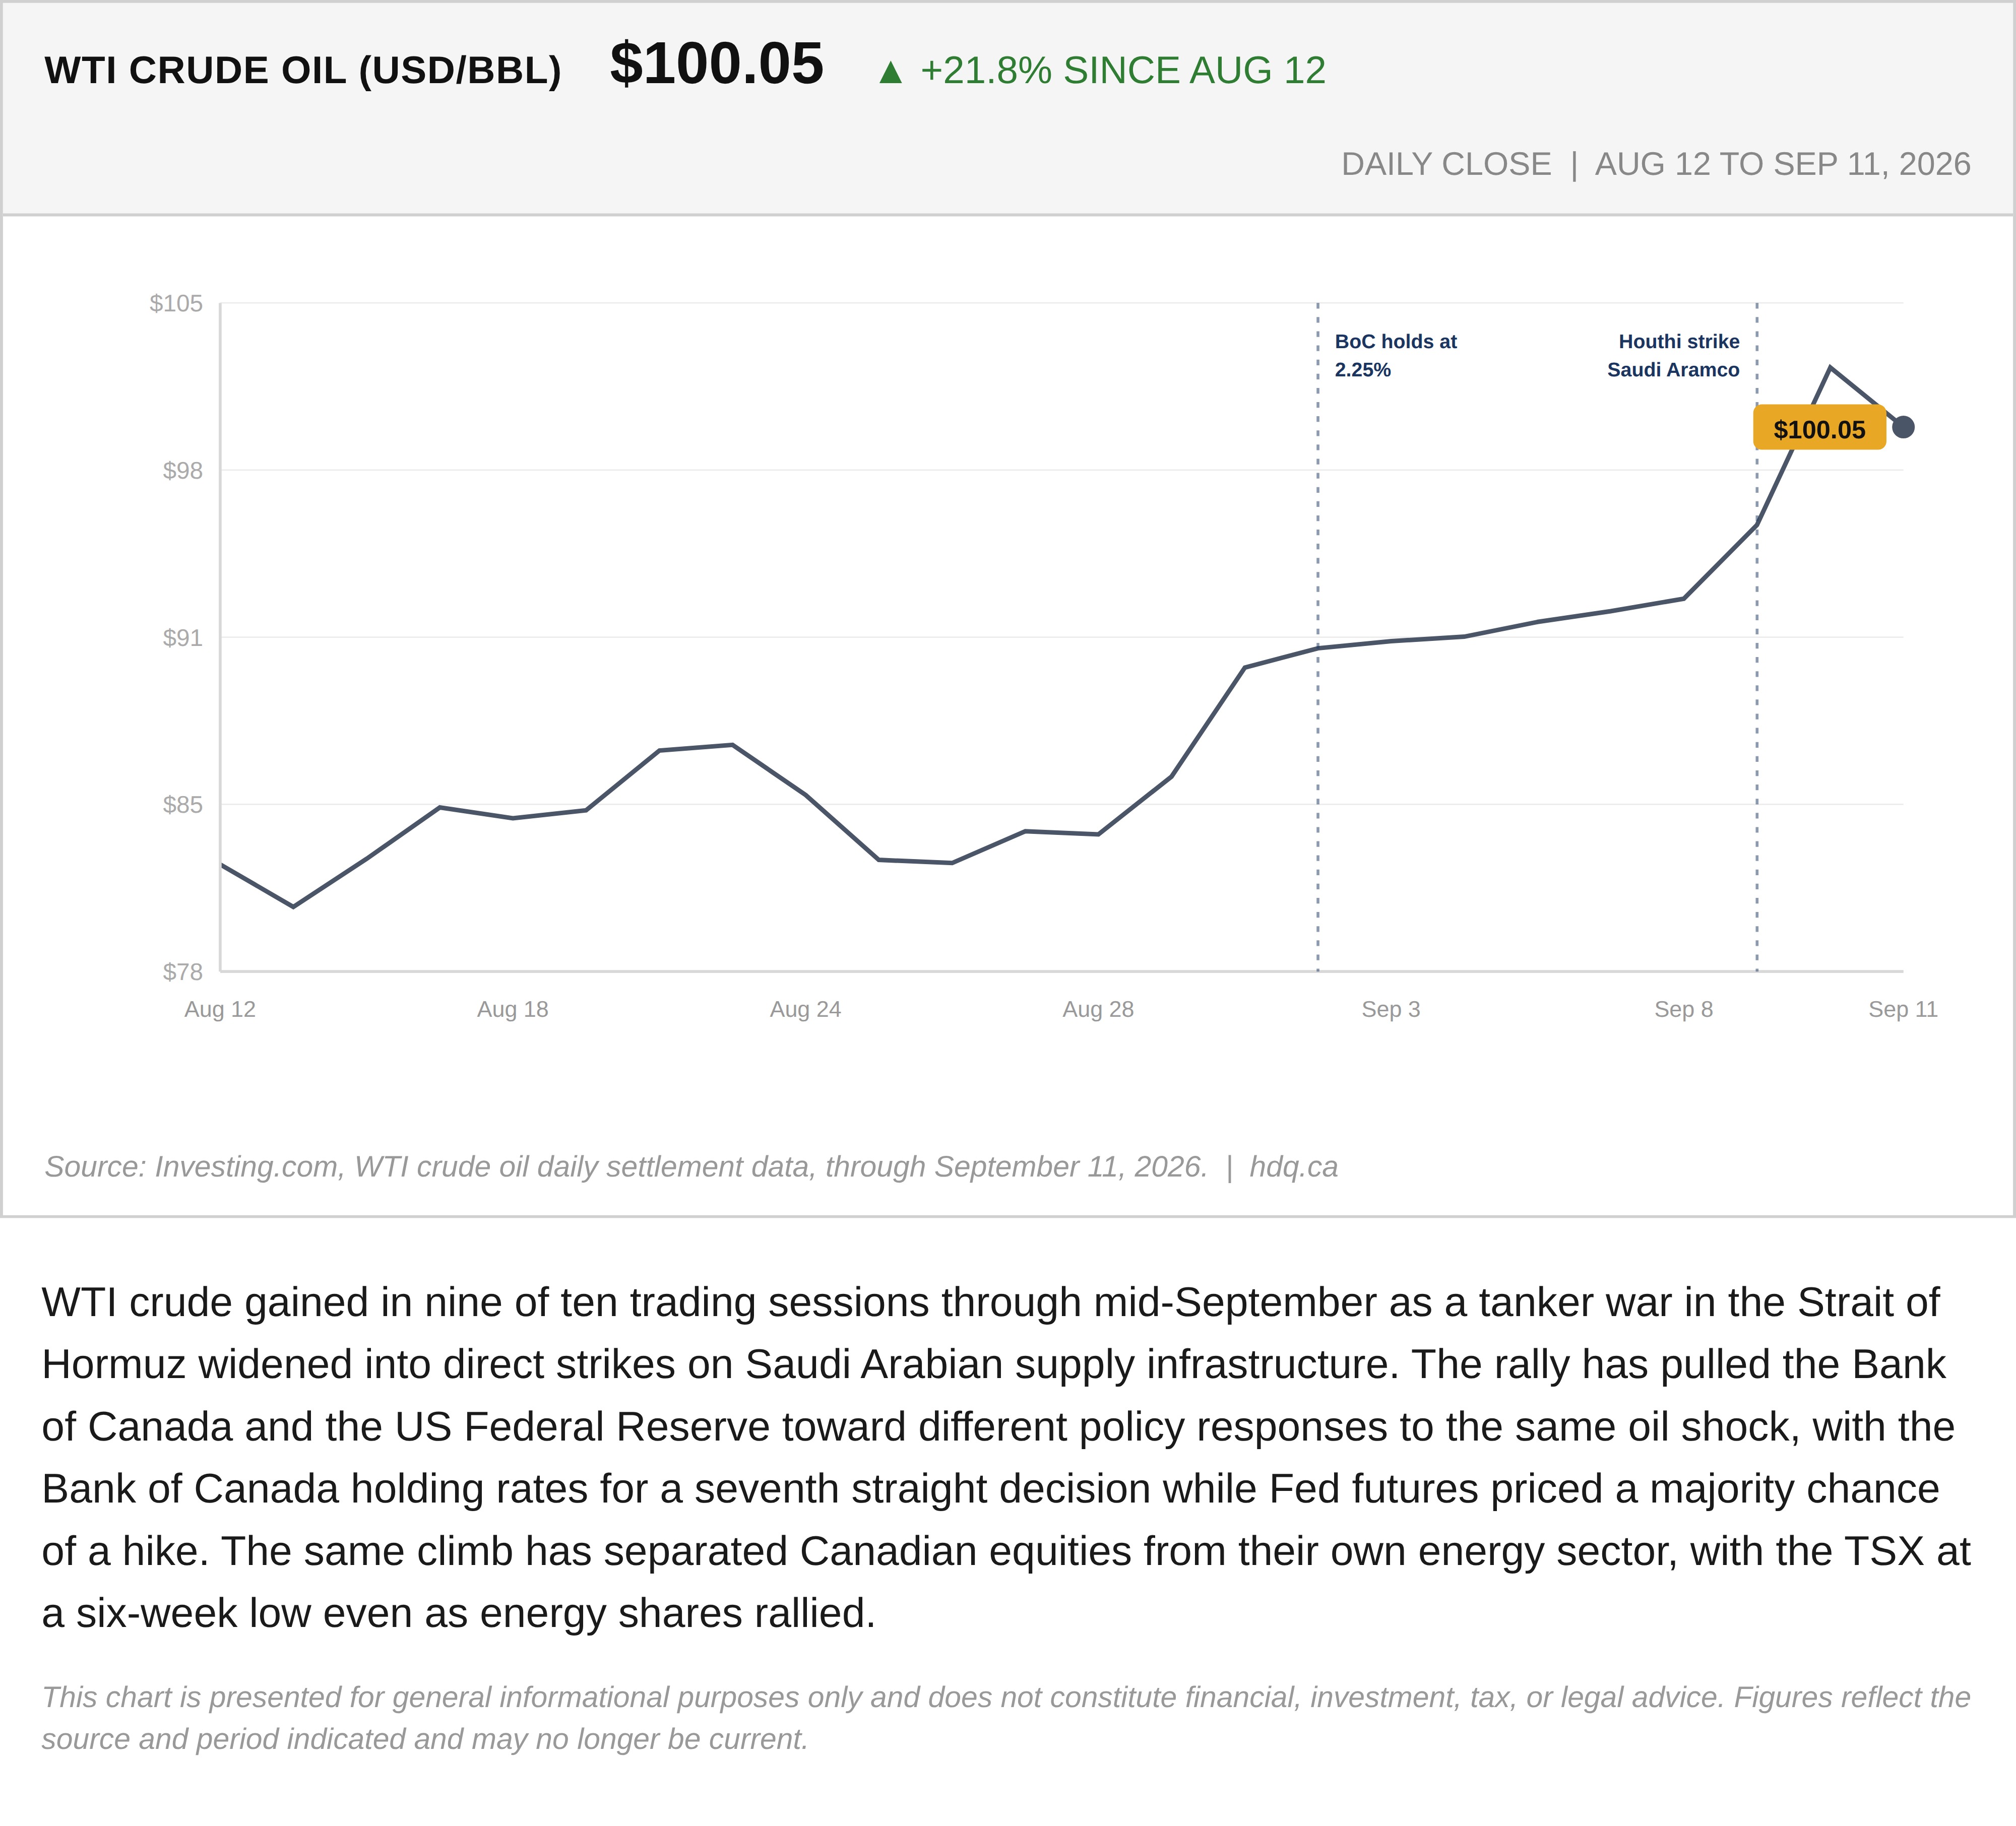
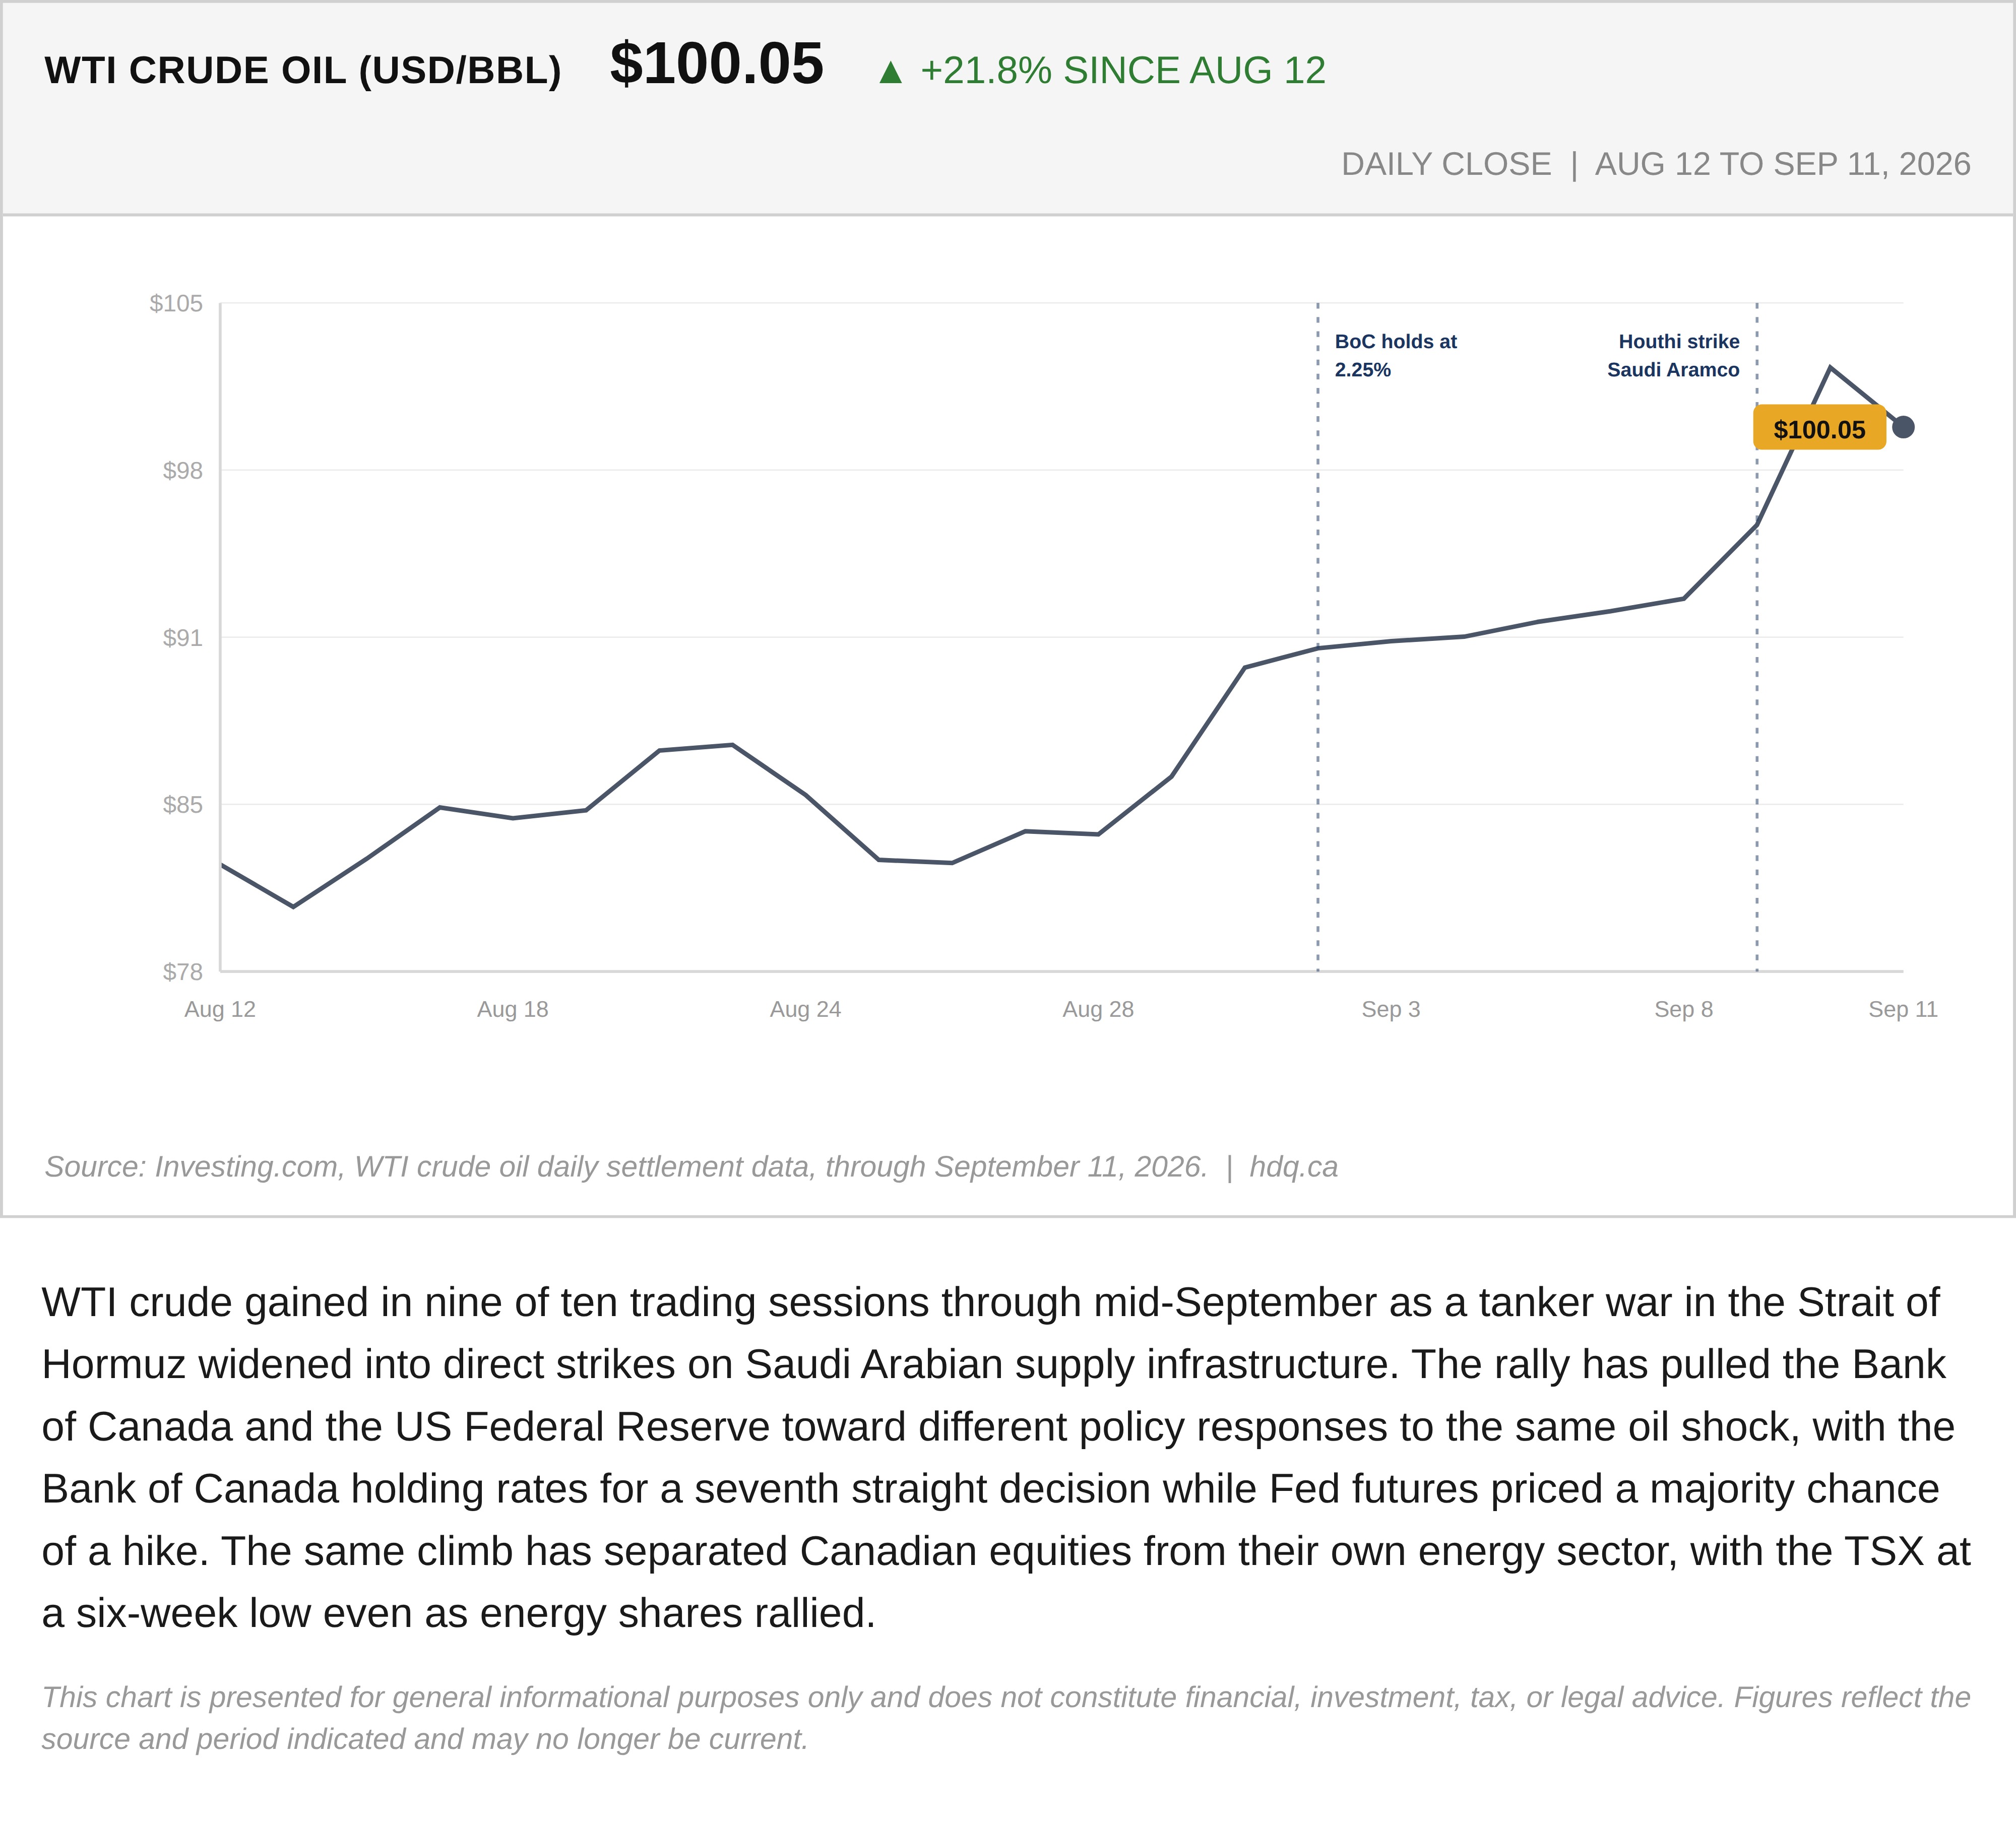
WTI crude gained in nine of ten trading sessions through mid-September as a tanker war in the Strait of Hormuz widened into direct strikes on Saudi Arabian supply infrastructure. The rally has pulled the Bank of Canada and the US Federal Reserve toward different policy responses to the same oil shock, with the Bank of Canada holding rates for a seventh straight decision while Fed futures priced a majority chance of a hike. The same climb has separated Canadian equities from their own energy sector, with the TSX at a six-week low even as energy shares rallied.
This chart is presented for general informational purposes only and does not constitute financial, investment, tax, or legal advice. Figures reflect the source and period indicated and may no longer be current.
Related charts

The S&P/TSX Composite closed July at 35,226, up 1.06% for the month, a modest headline figure that conceals sharp intra-month swings.
S&P/TSX Composite closes July up 1.06% after a volatile month
July 31, 2026
View chart & download
Brent and WTI crude both surged in July, with WTI ending the month at $85.47, up 23.0%, after round-tripping from a five-month low near $68.74.
WTI and Brent crude surge in July as the Iran ceasefire collapses
July 31, 2026
View chart & download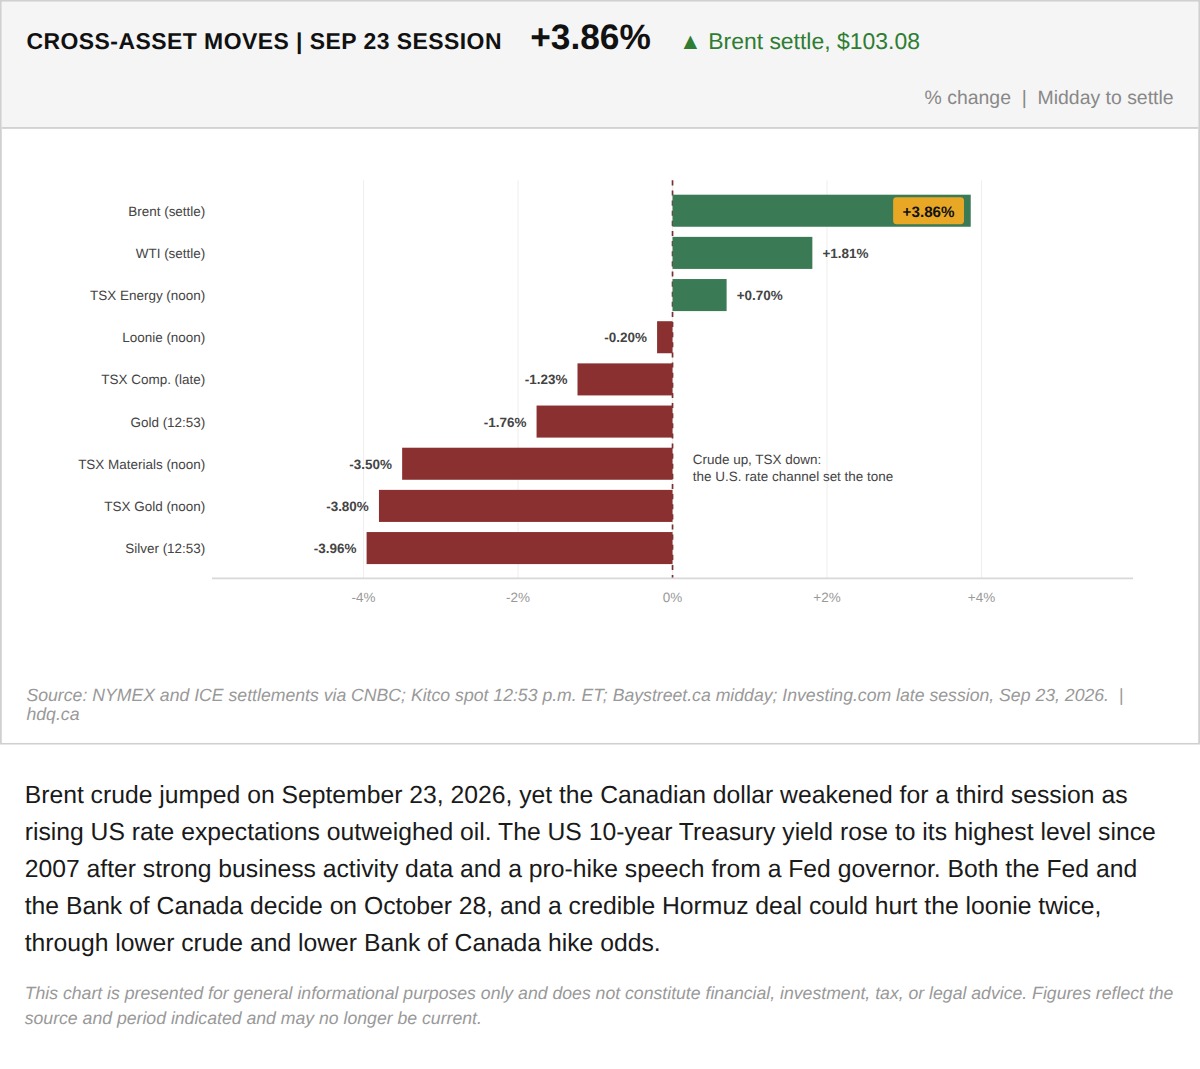
Brent crude jumped on September 23, 2026, yet the Canadian dollar weakened for a third session as rising US rate expectations outweighed oil.
Brent Jumps While the Canadian Dollar and TSX Fall in the September 23 Session
September 23, 2026
View chart & download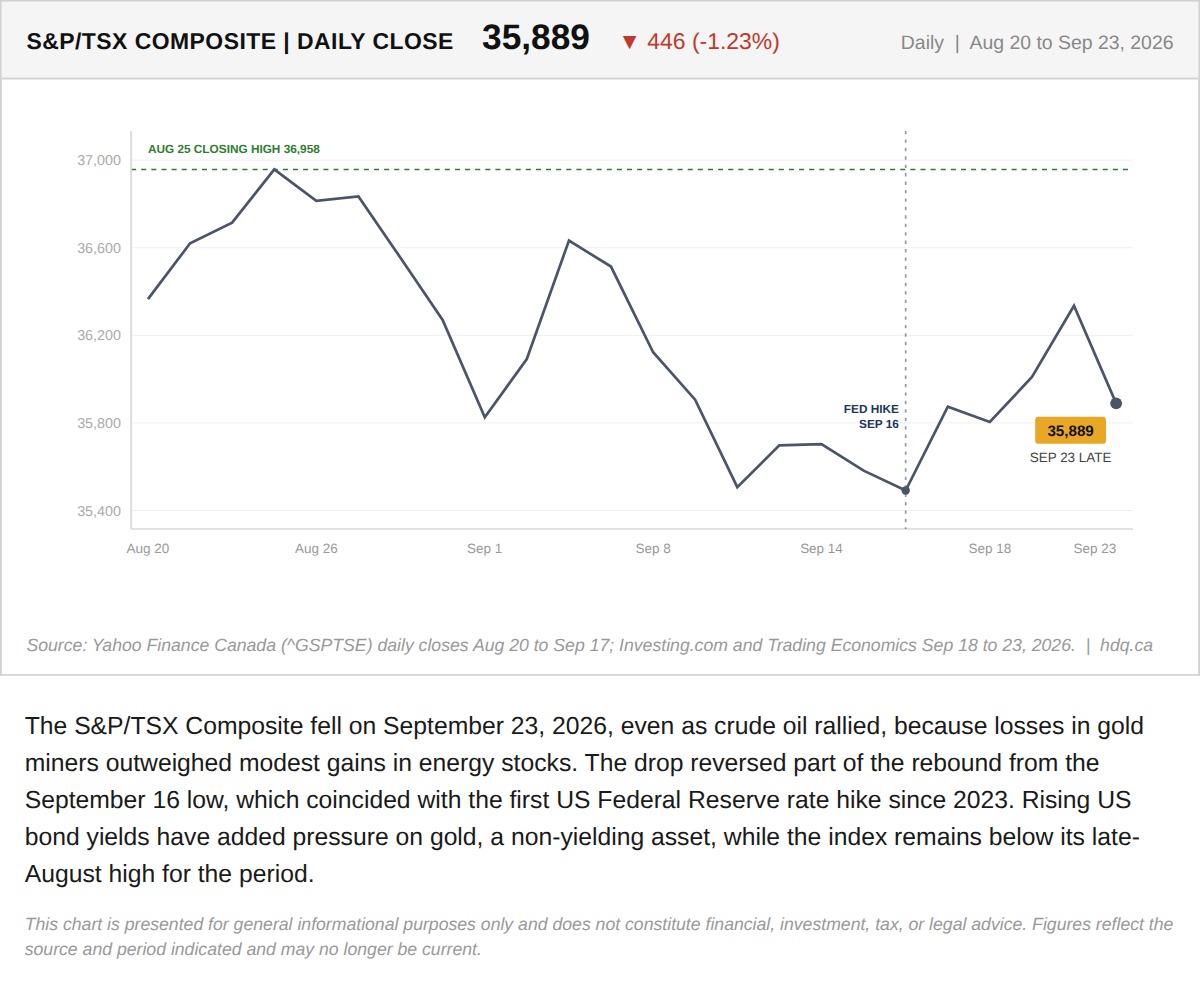
The S&P/TSX Composite fell on September 23, 2026, even as crude oil rallied, because losses in gold miners outweighed modest gains in energy stocks.
TSX Composite Falls Despite an Oil Rally as Gold Stocks Slide
September 23, 2026
View chart & download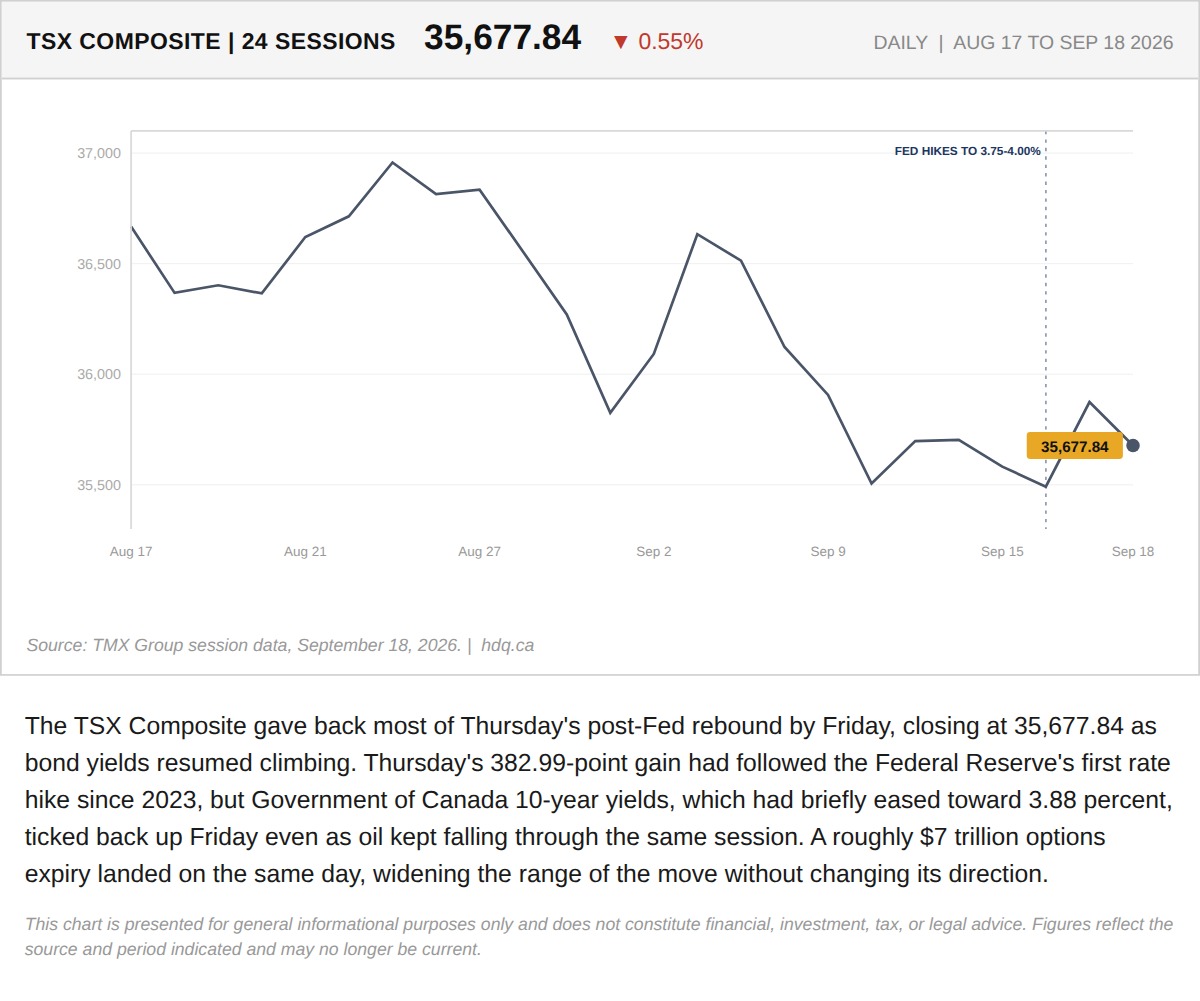
The TSX Composite gave back most of Thursday's post-Fed rebound by Friday, closing at 35,677.84 as bond yields resumed climbing.
TSX Gives Back Post-Fed Rally as Bond Yields Resume Climbing
September 18, 2026
View chart & download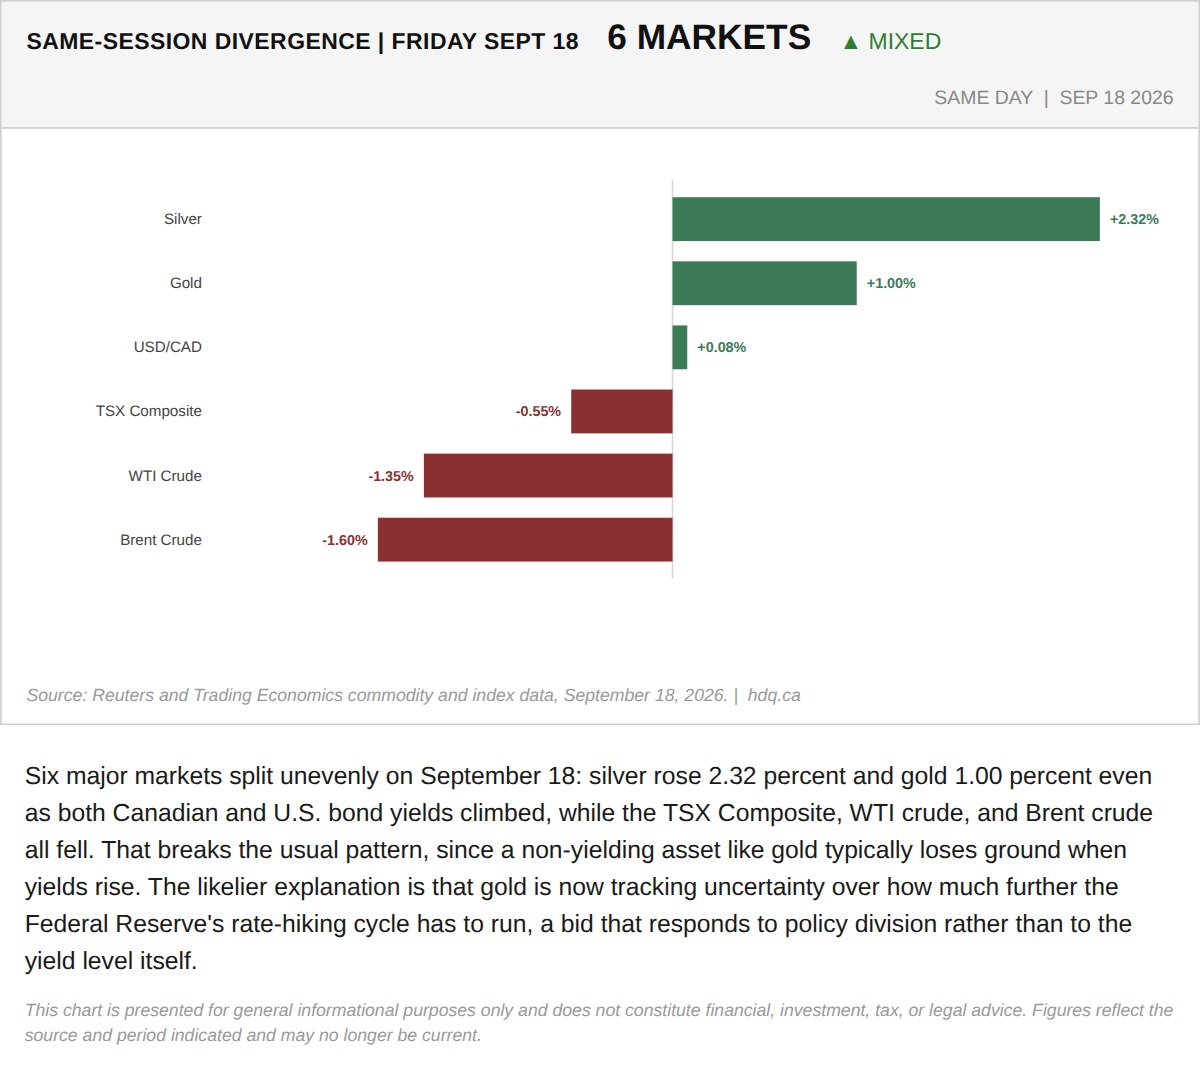
Six major markets split unevenly on September 18: silver rose 2.32 percent and gold 1.00 percent even as both Canadian and U.S.
Gold and Silver Rise With Yields, Breaking the Usual Pattern
September 18, 2026
View chart & download