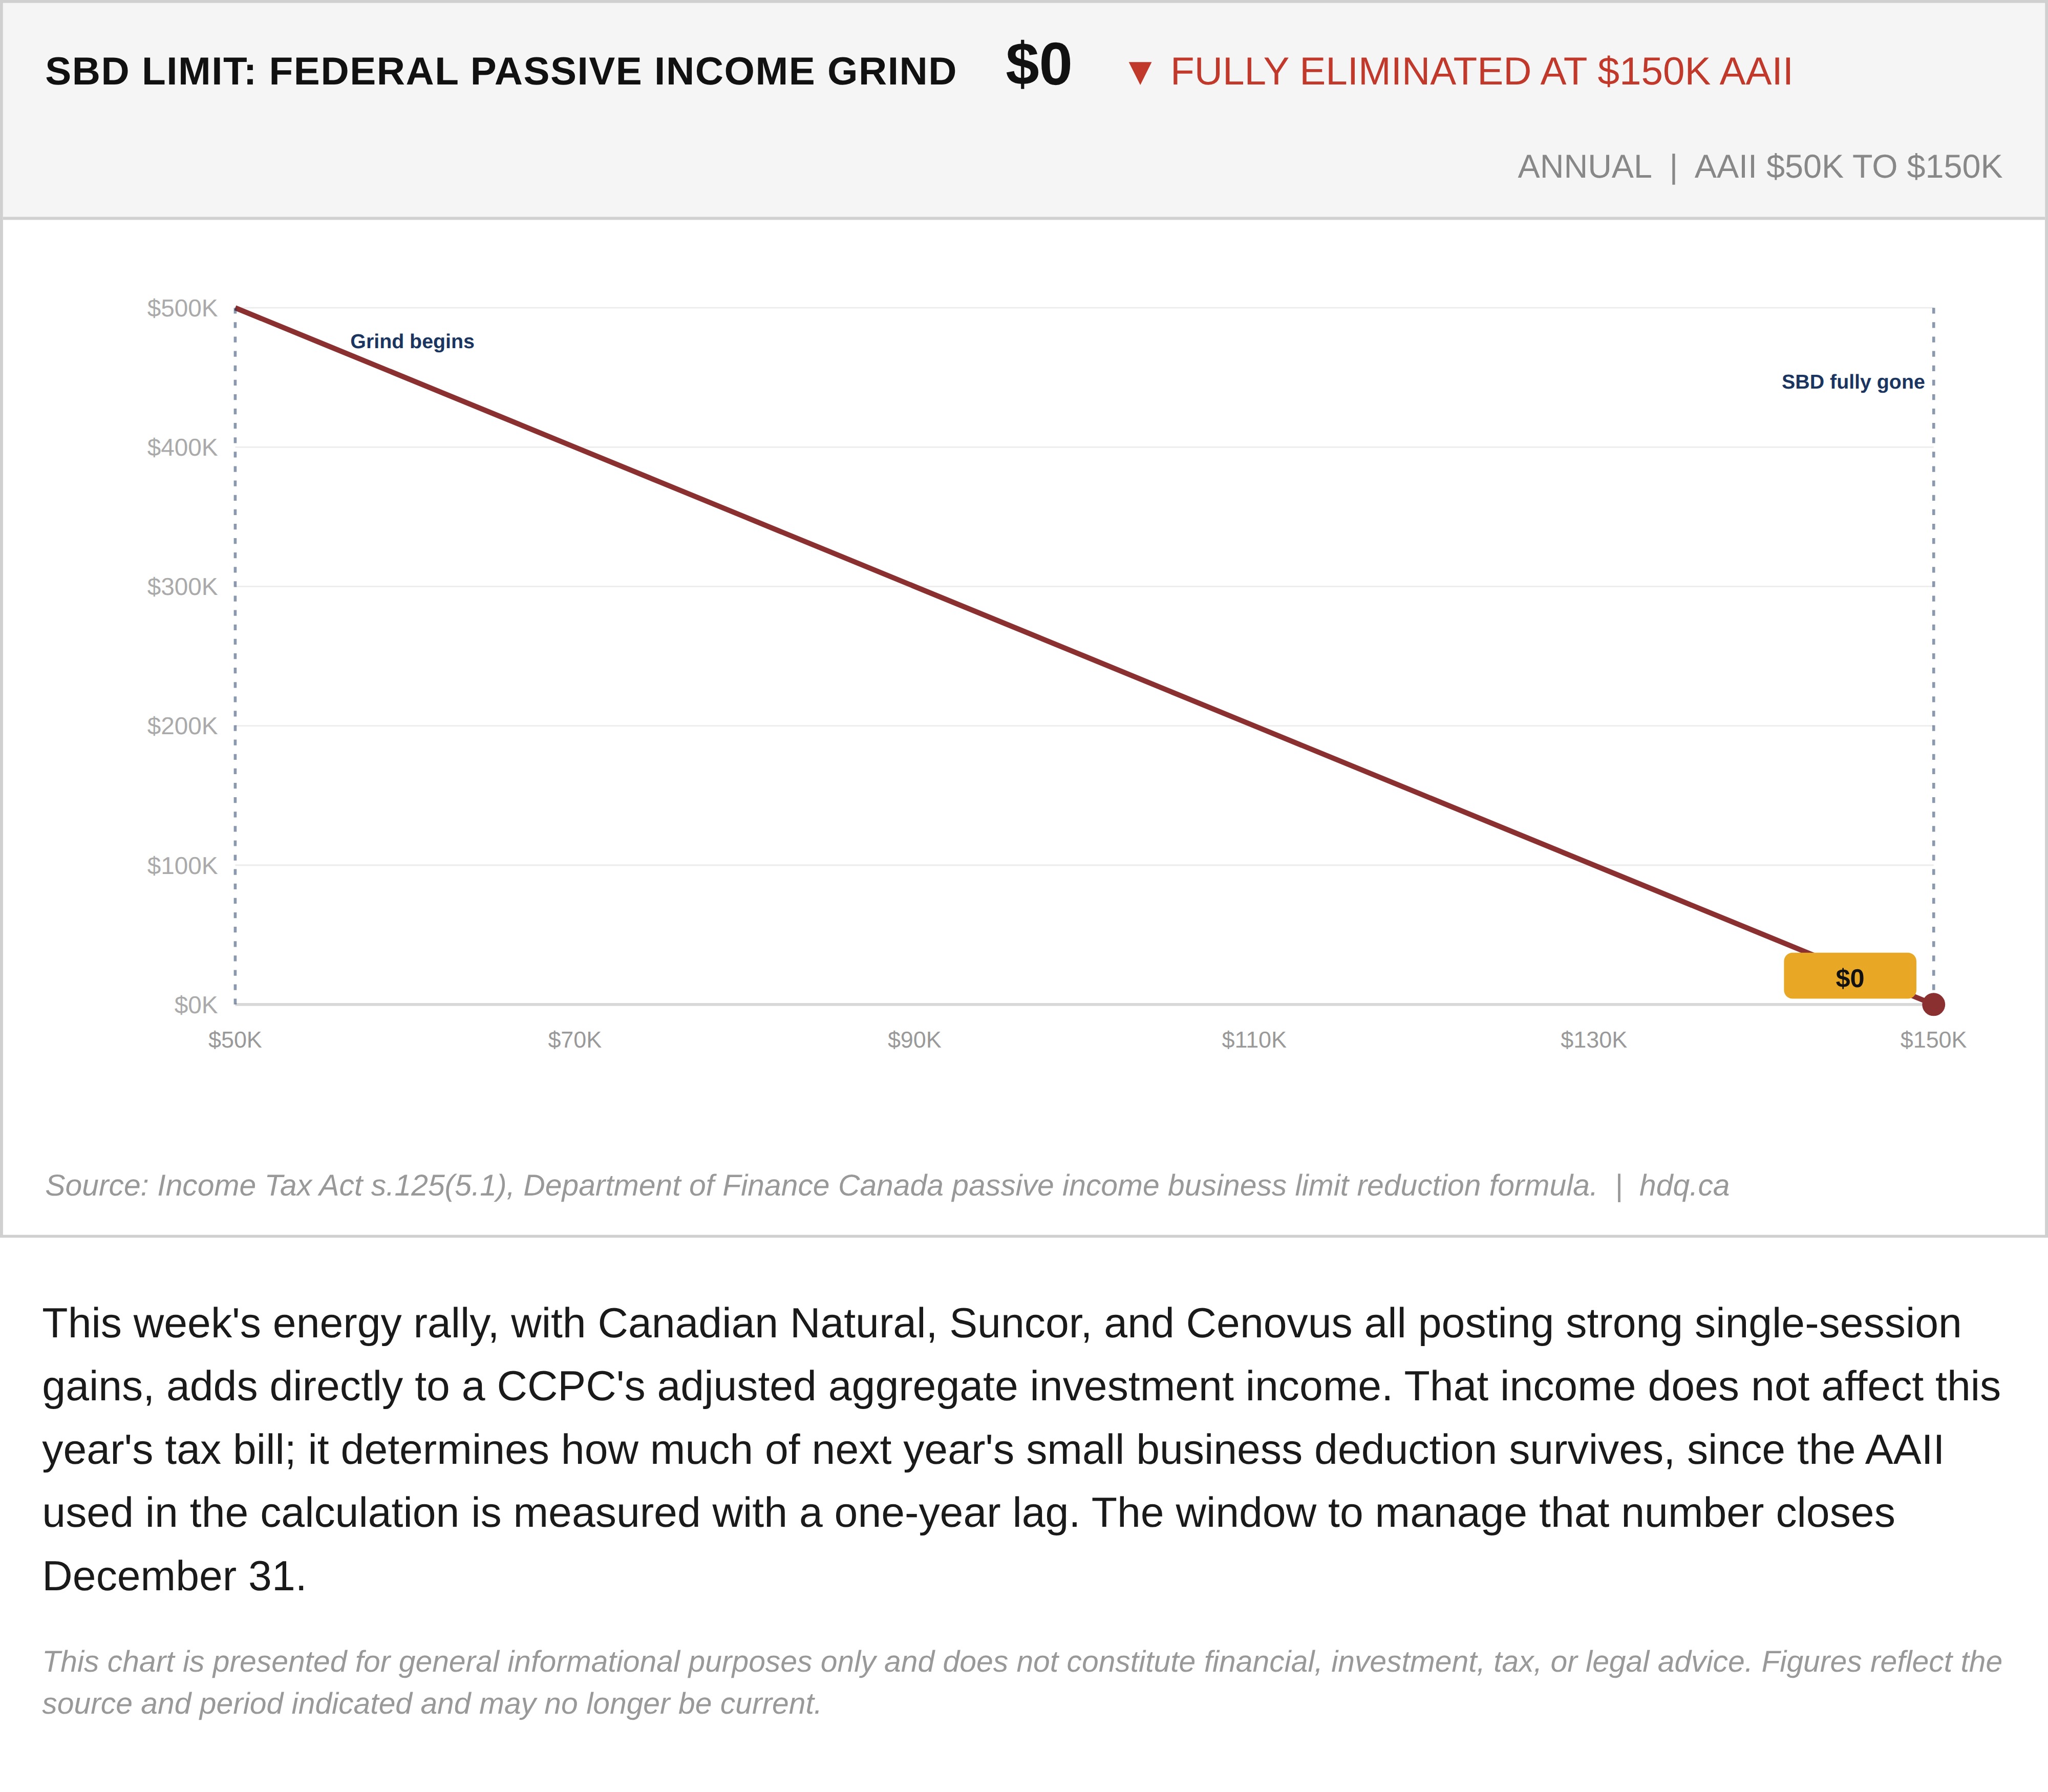
This week's energy rally, with Canadian Natural, Suncor, and Cenovus all posting strong single-session gains, adds directly to a CCPC's adjusted aggregate investment income. That income does not affect this year's tax bill; it determines how much of next year's small business deduction survives, since the AAII used in the calculation is measured with a one-year lag. The window to manage that number closes December 31.
This chart is presented for general informational purposes only and does not constitute financial, investment, tax, or legal advice. Figures reflect the source and period indicated and may no longer be current.

Related charts
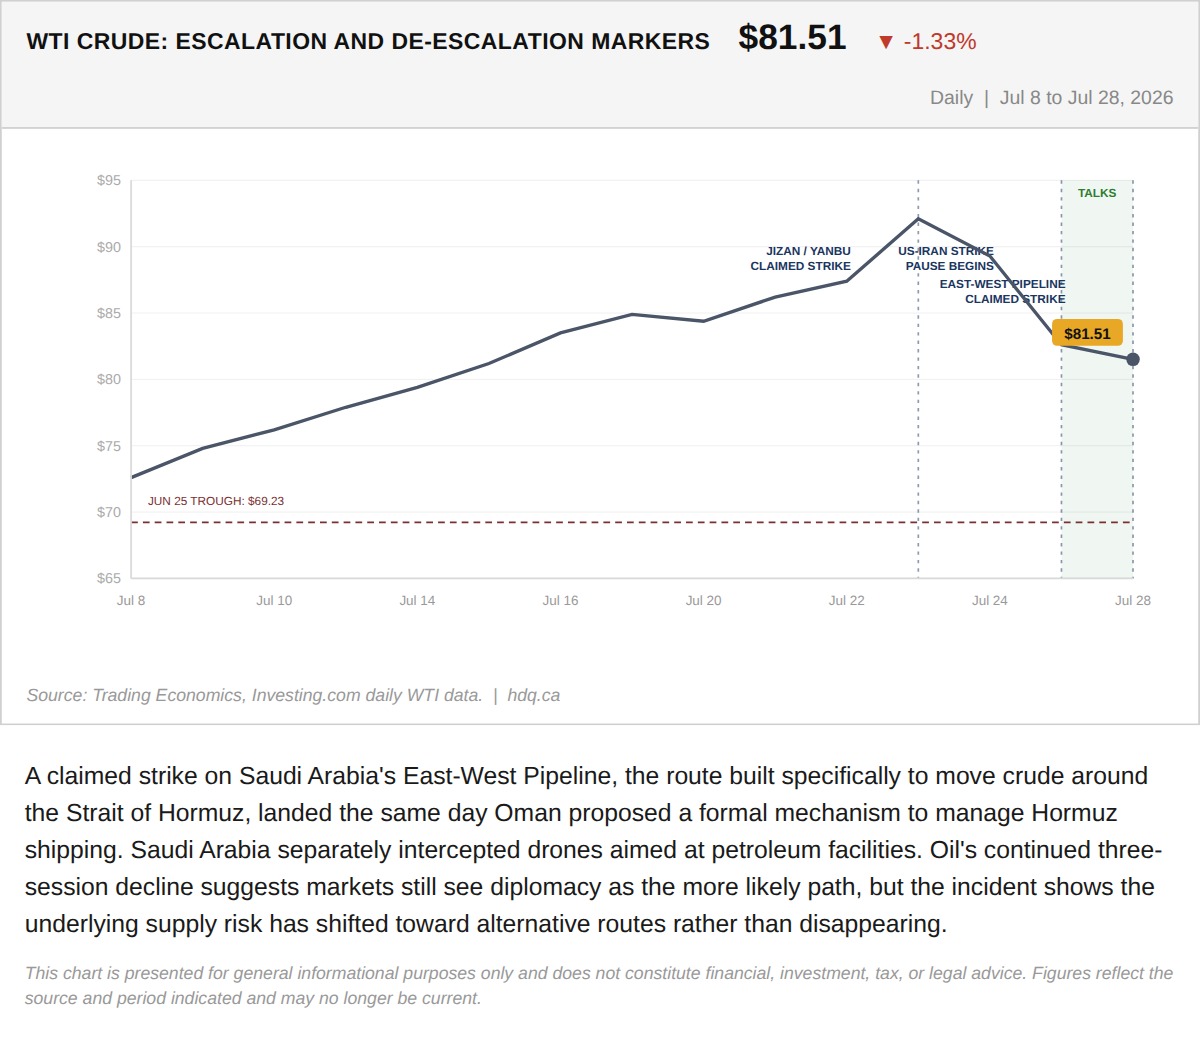
A claimed strike on Saudi Arabia's East-West Pipeline, the route built specifically to move crude around the Strait of Hormuz, landed the…
The Pipeline Built to Bypass Hormuz Risk Just Became a Target
July 28, 2026
View chart & download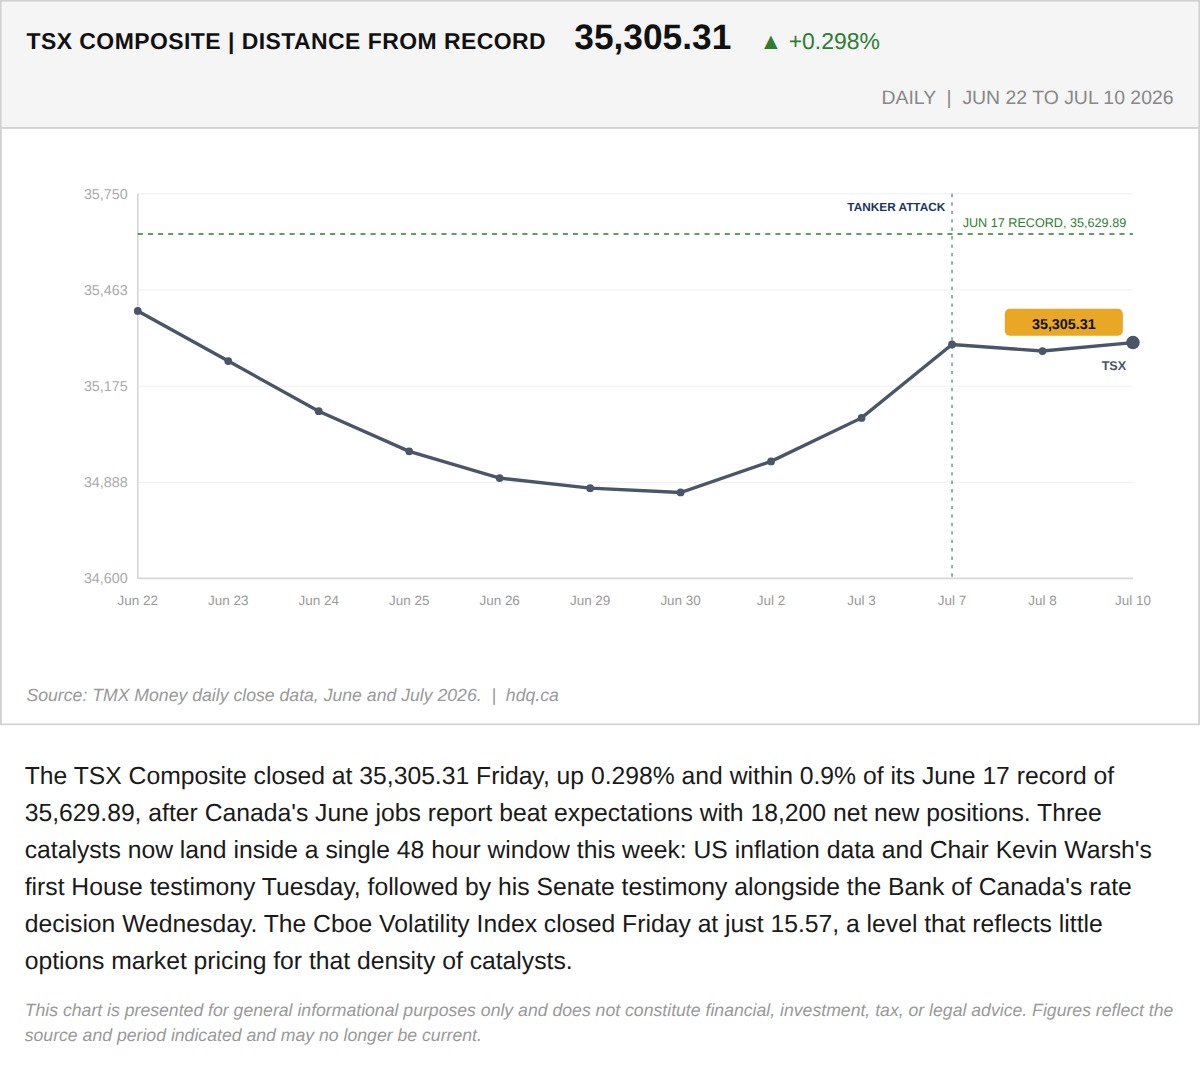
The TSX Composite closed at 35,305.31 Friday, up 0.298% and within 0.9% of its June 17 record of 35,629.89, after Canada's June jobs report…
324 Points From a Record, the TSX Heads Into Its Busiest 48 Hours of the Summer
July 13, 2026
View chart & download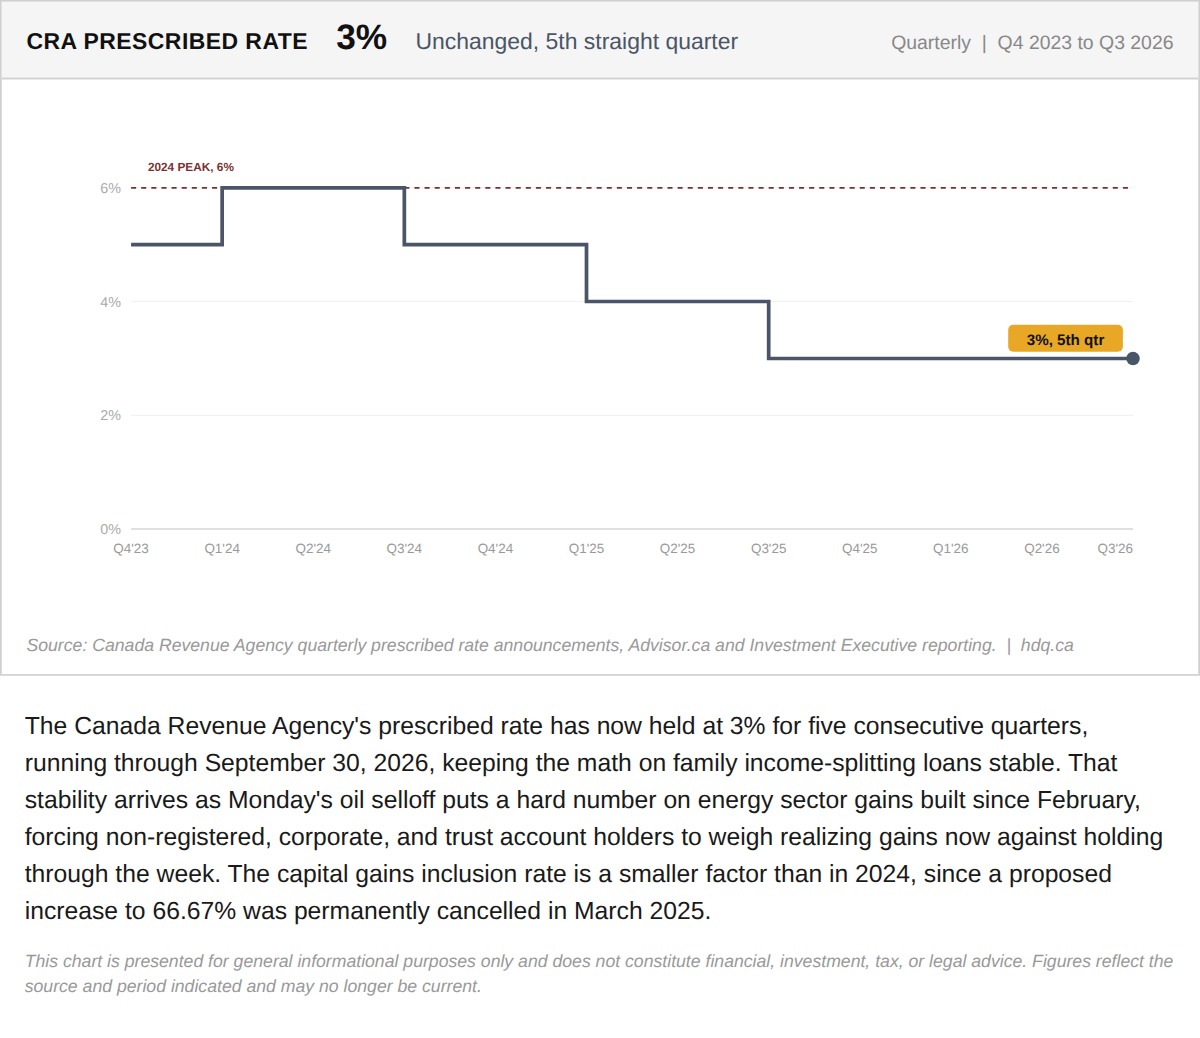
The Canada Revenue Agency's prescribed rate has now held at 3% for five consecutive quarters, running through September 30, 2026, keeping…
CRA Prescribed Rate Holds at 3% for a Fifth Straight Quarter
July 27, 2026
View chart & download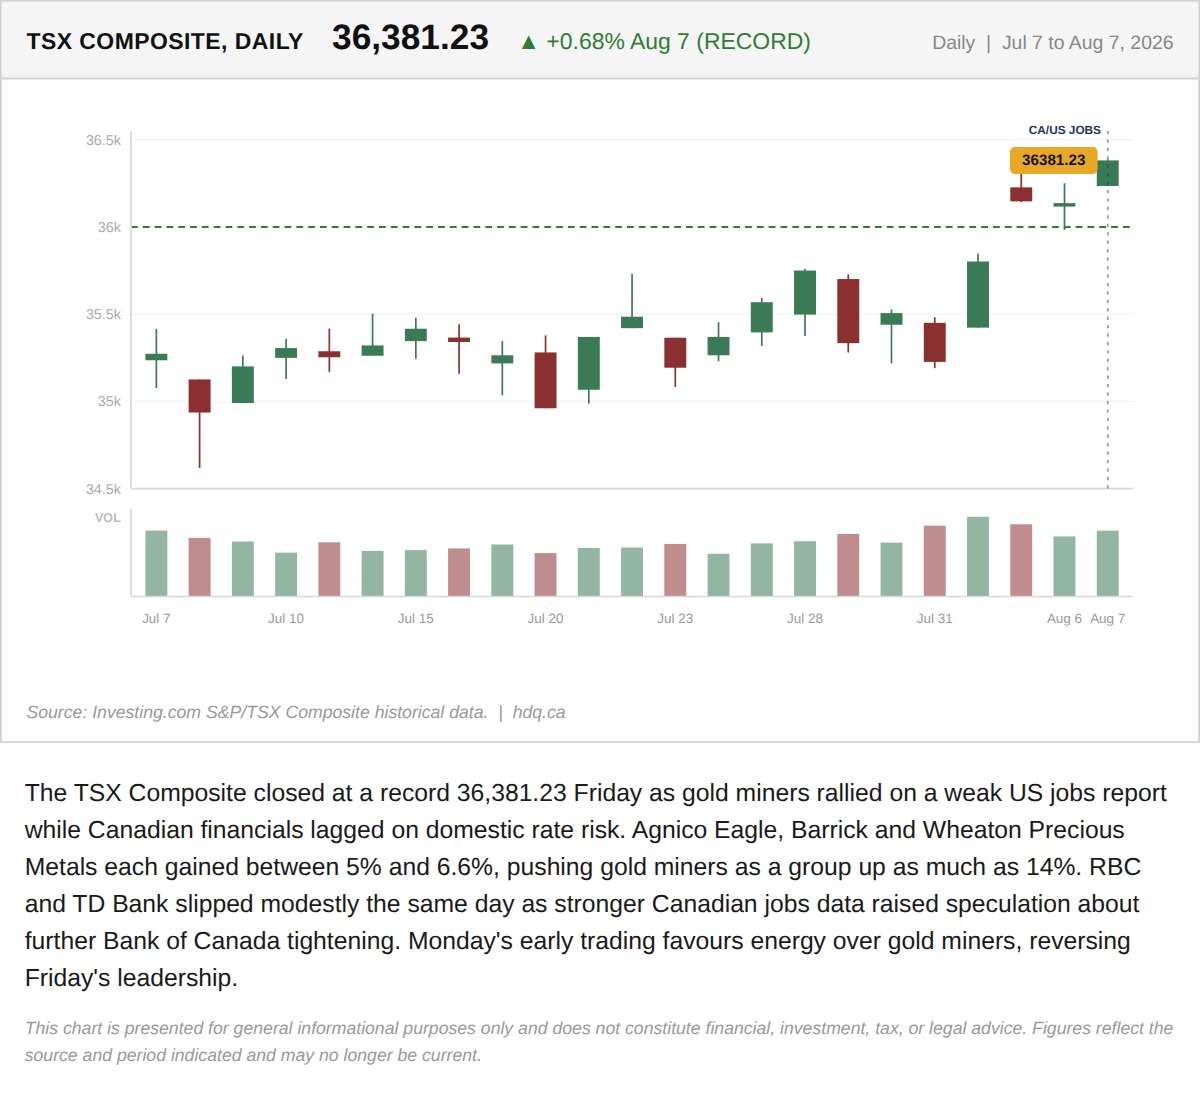
The TSX Composite closed at a record 36,381.23 Friday as gold miners rallied on a weak US jobs report while Canadian financials lagged on domestic rate risk.
The TSX Hit a Record Friday on Gold. Monday's Open Favours Oil Instead.
August 10, 2026
View chart & download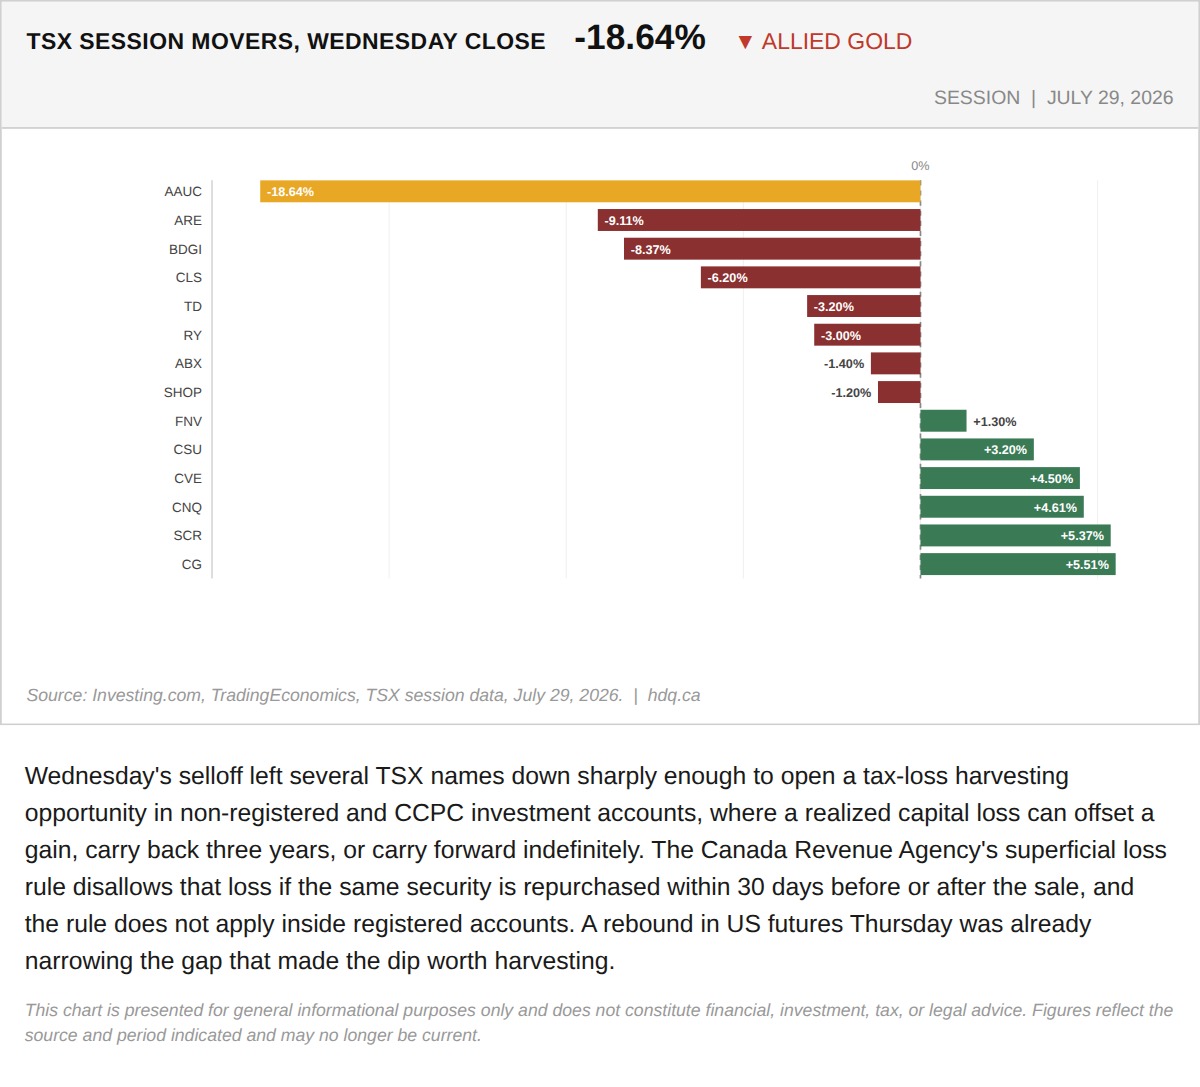
Wednesday's selloff left several TSX names down sharply enough to open a tax-loss harvesting opportunity in non-registered and CCPC…
Wednesday's Selloff Opened a Loss Harvesting Window. Thursday's Rebound May Already Be Closing It.
July 30, 2026
View chart & download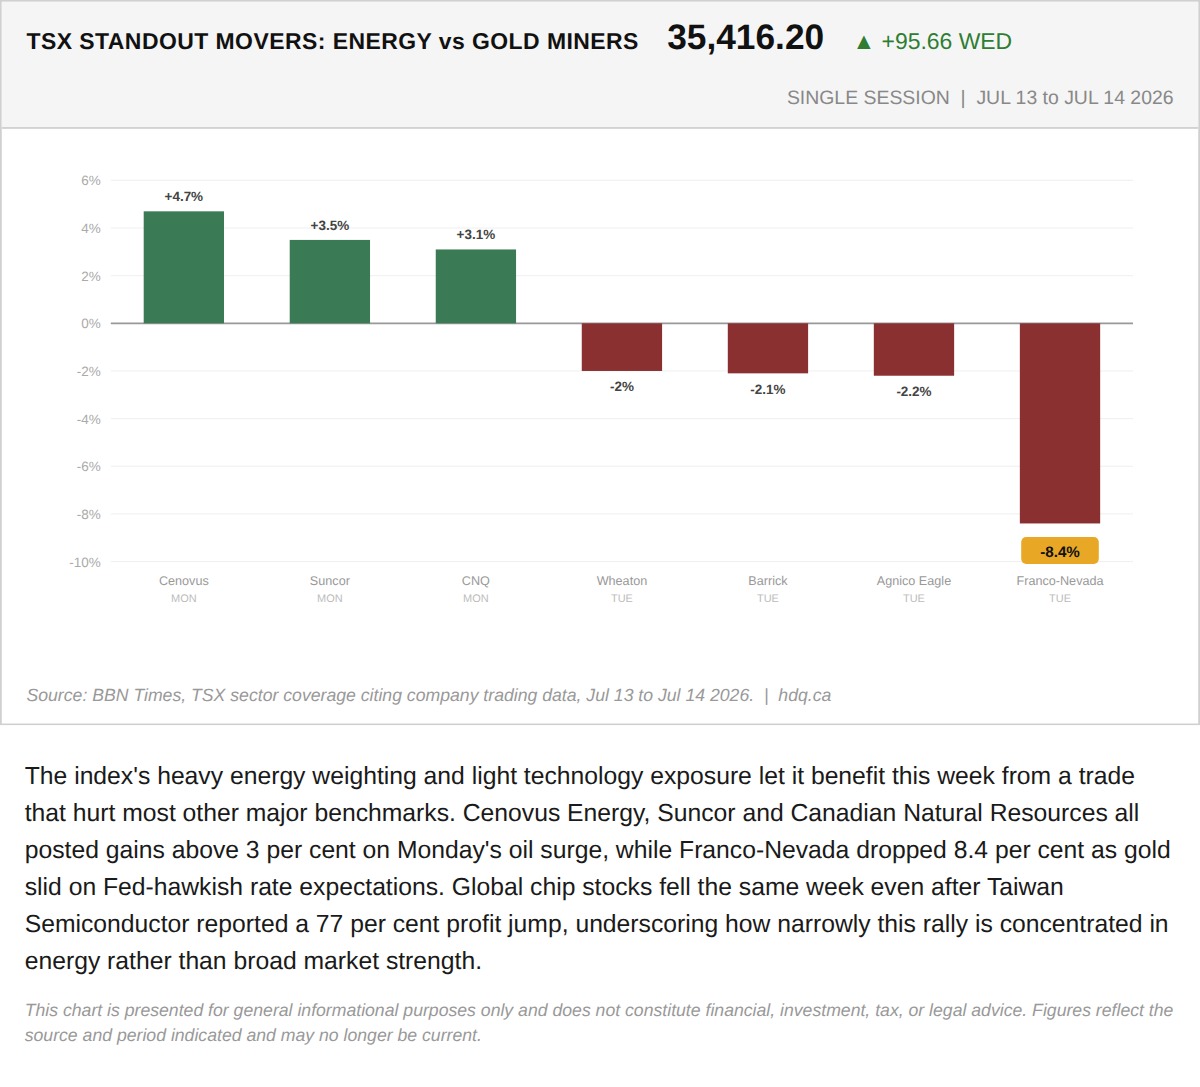
The index's heavy energy weighting and light technology exposure let it benefit this week from a trade that hurt most other major benchmarks.
The TSX Keeps Climbing on Oil. Its Gold Miners Are Paying For It.
July 16, 2026
View chart & download