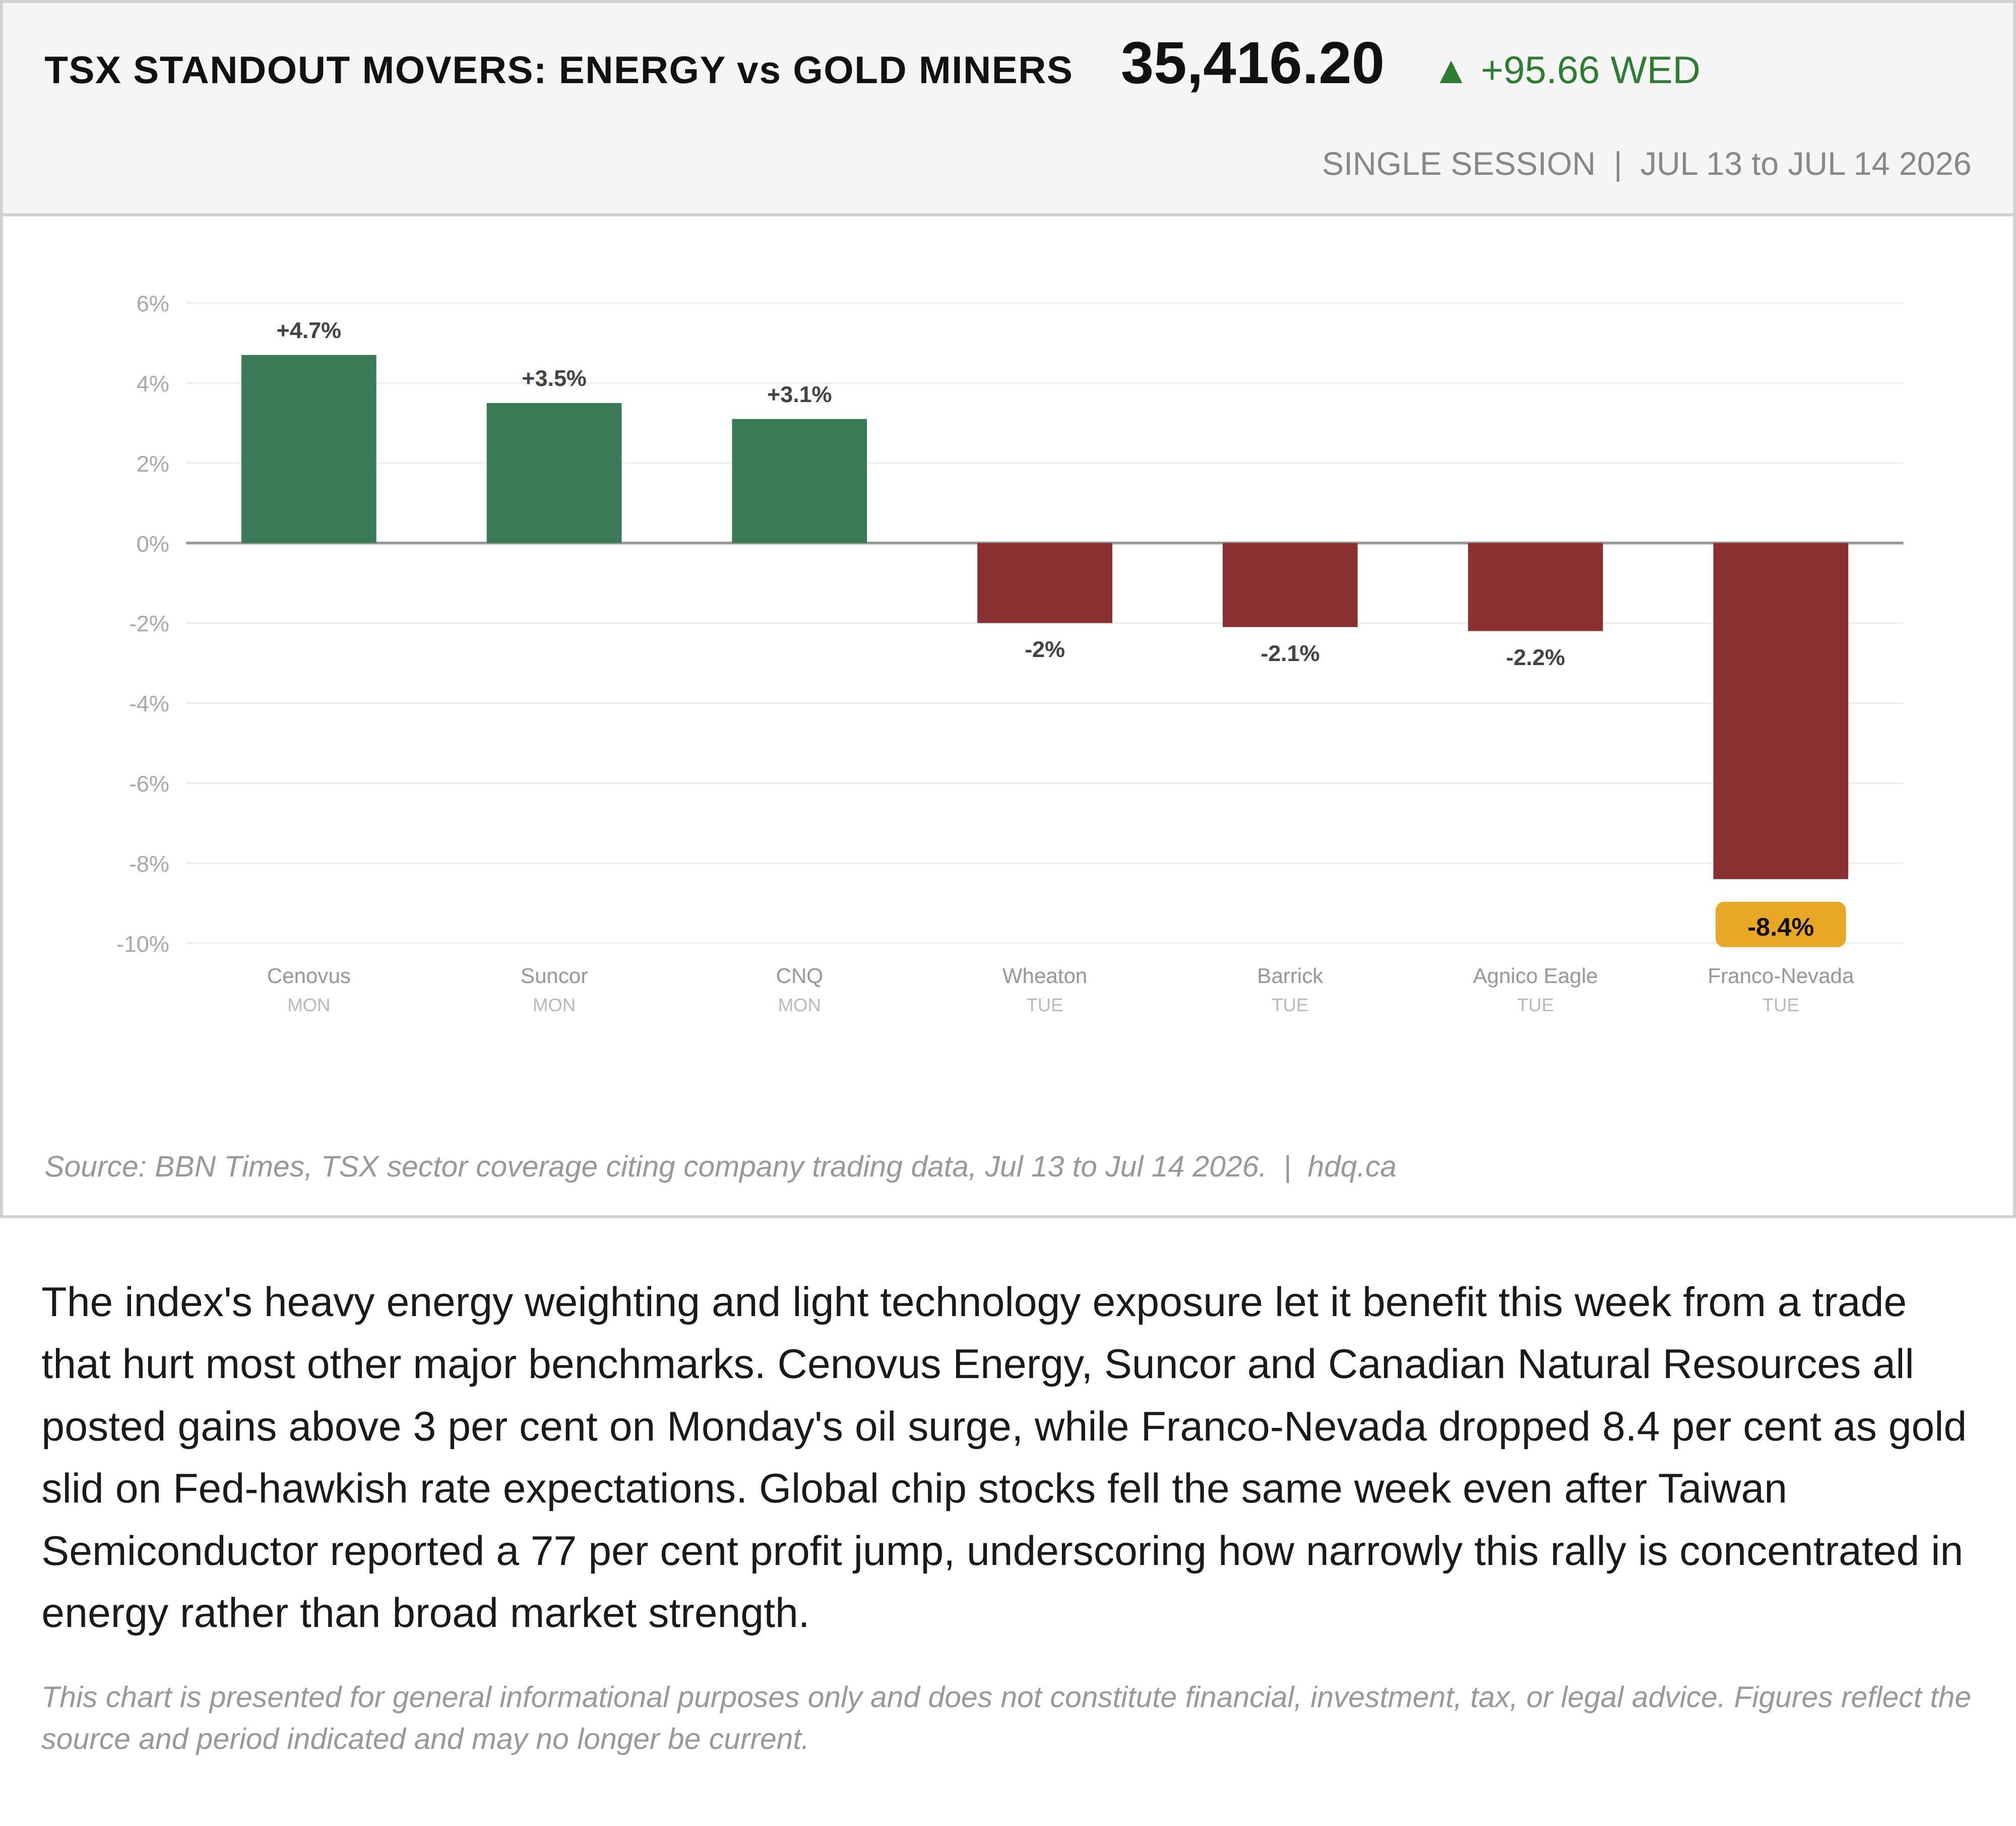
The index's heavy energy weighting and light technology exposure let it benefit this week from a trade that hurt most other major benchmarks. Cenovus Energy, Suncor and Canadian Natural Resources all posted gains above 3 per cent on Monday's oil surge, while Franco-Nevada dropped 8.4 per cent as gold slid on Fed-hawkish rate expectations. Global chip stocks fell the same week even after Taiwan Semiconductor reported a 77 per cent profit jump, underscoring how narrowly this rally is concentrated in energy rather than broad market strength.
This chart is presented for general informational purposes only and does not constitute financial, investment, tax, or legal advice. Figures reflect the source and period indicated and may no longer be current.

Related charts
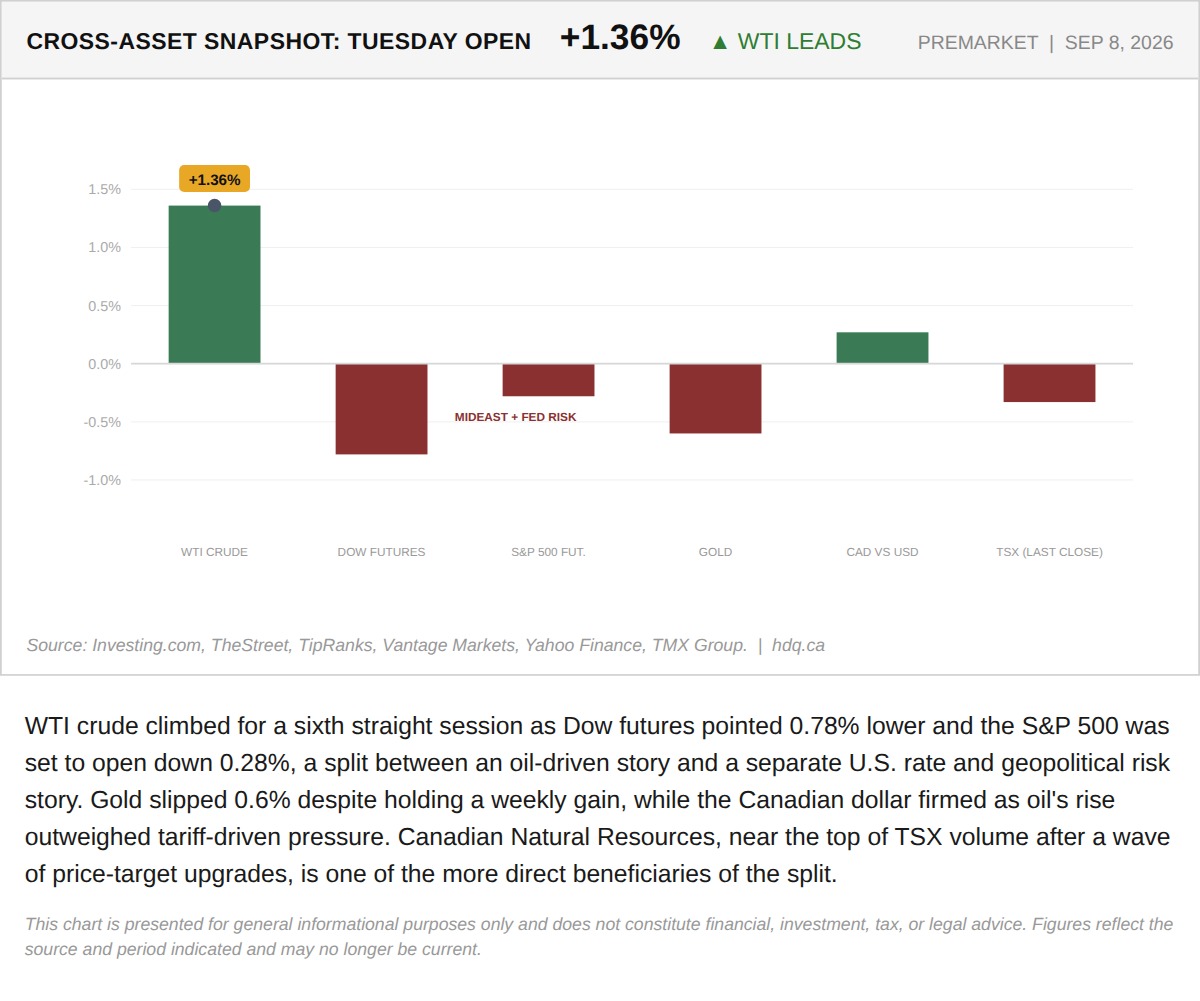
WTI crude climbed for a sixth straight session as Dow futures pointed 0.78% lower and the S&P 500 was set to open down 0.28%, a split between an oil-driven story and a separate U.S.
Dow Futures Fall 0.78% as Oil Climbs Toward $94, and Canadian Energy Is the Beneficiary
September 8, 2026
View chart & download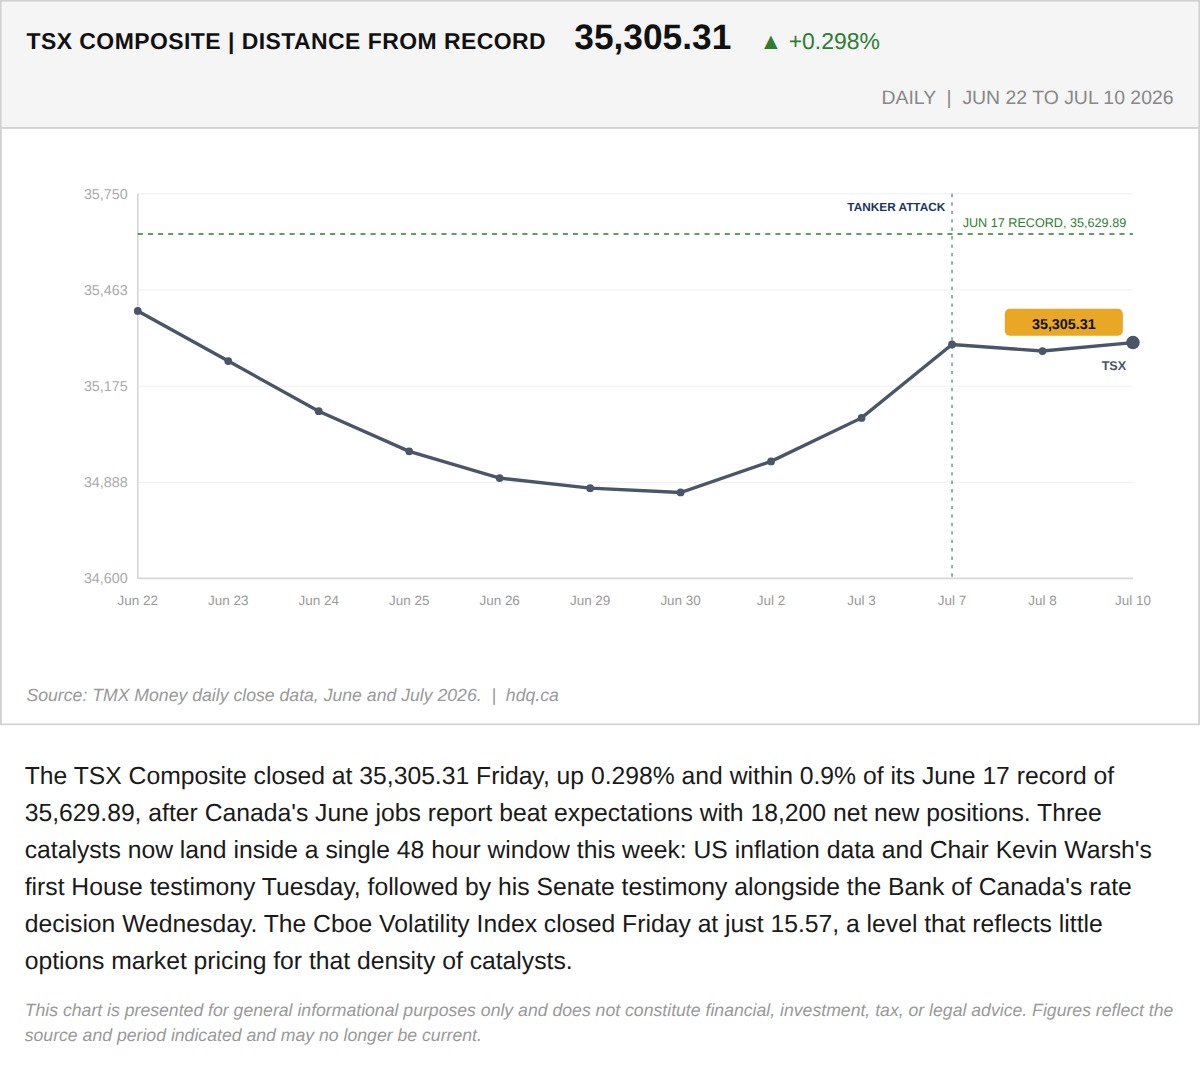
The TSX Composite closed at 35,305.31 Friday, up 0.298% and within 0.9% of its June 17 record of 35,629.89, after Canada's June jobs report…
324 Points From a Record, the TSX Heads Into Its Busiest 48 Hours of the Summer
July 13, 2026
View chart & download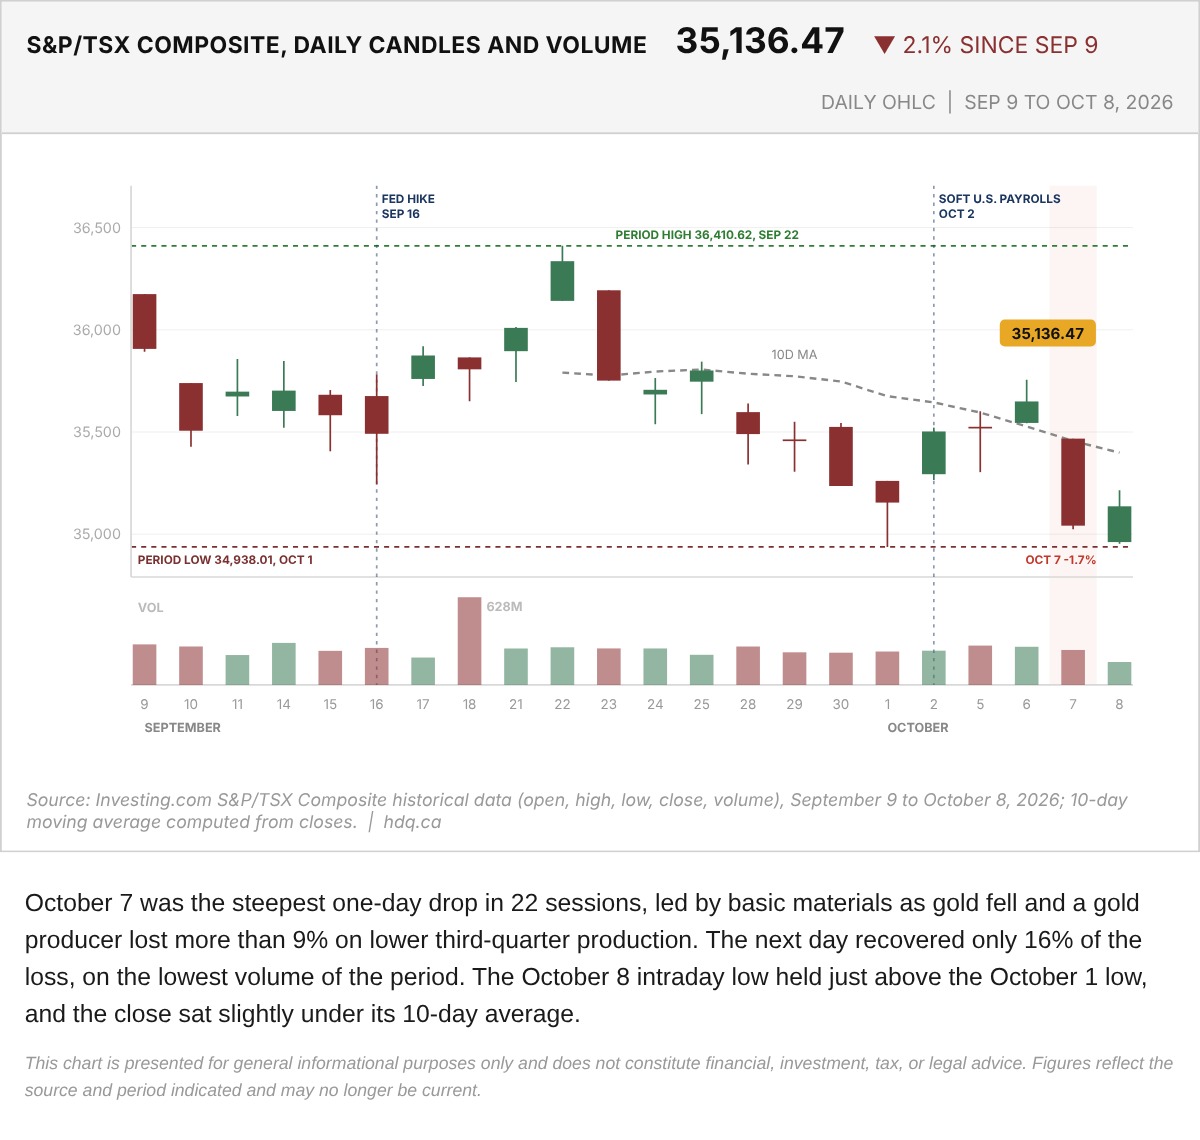
October 7 was the steepest one-day drop in 22 sessions, led by basic materials as gold fell and a gold producer lost more than 9% on lower third-quarter production.
S&P/TSX Composite Daily Candles and Volume, September 9 to October 8
October 9, 2026
View chart & download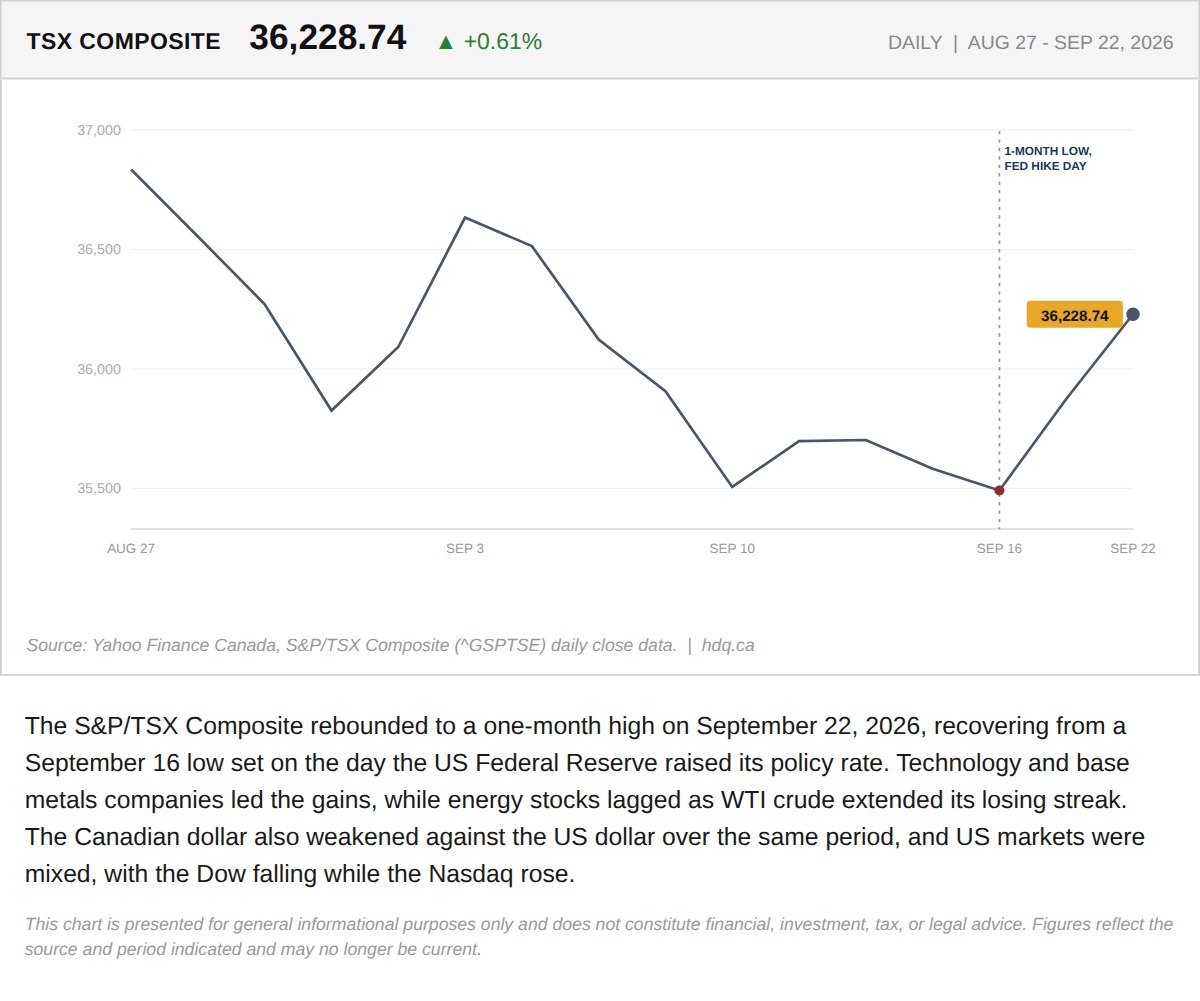
The S&P/TSX Composite rebounded to a one-month high on September 22, 2026, recovering from a September 16 low set on the day the US Federal Reserve raised its policy rate.
The TSX Hit a One-Month High on Tech and Base Metals While Energy Keeps Falling
September 23, 2026
View chart & download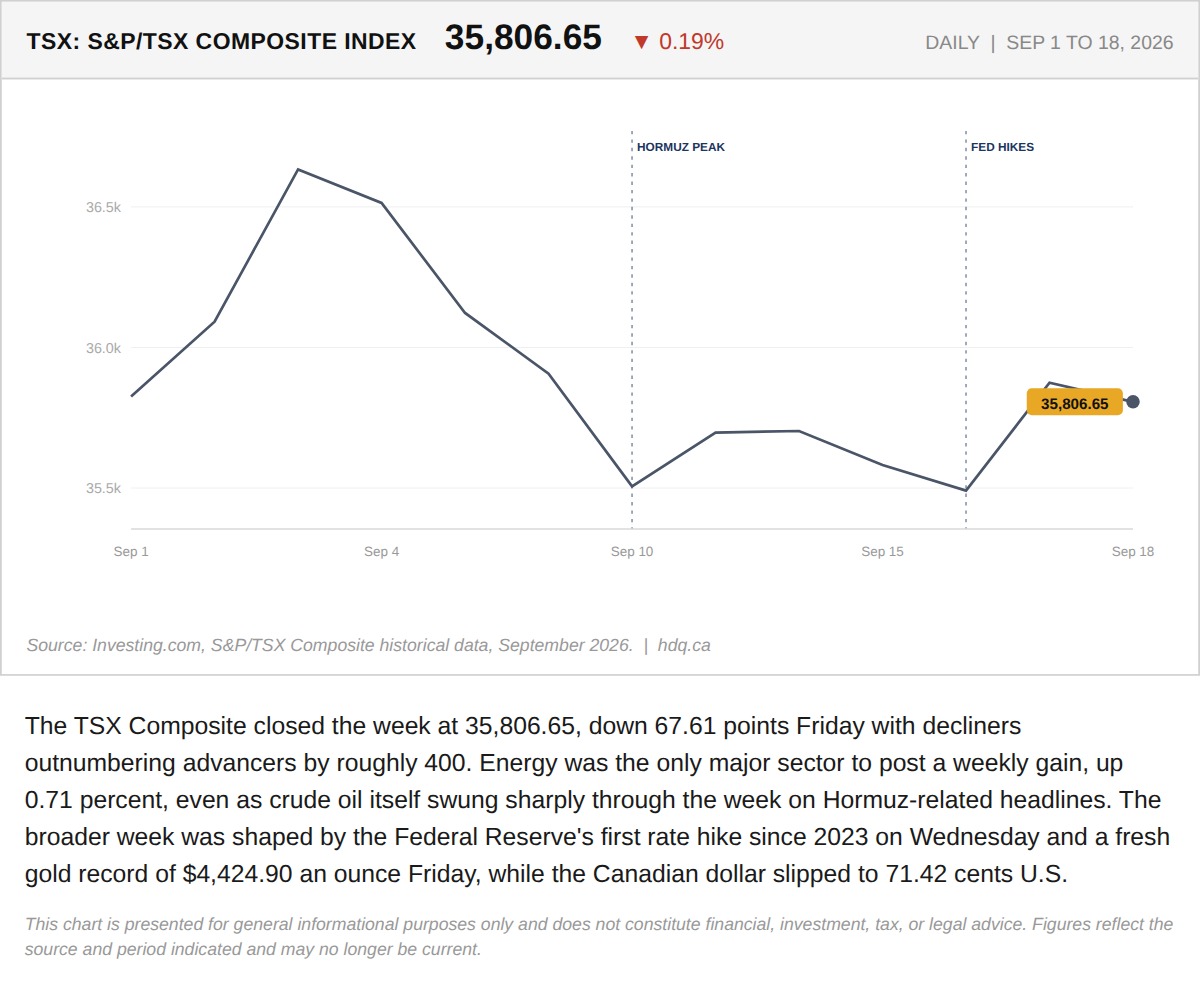
The TSX Composite closed the week at 35,806.65, down 67.61 points Friday with decliners outnumbering advancers by roughly 400.
The TSX Closed a Volatile Week at 35,806.65. Energy Was the Only Sector That Actually Held.
September 21, 2026
View chart & download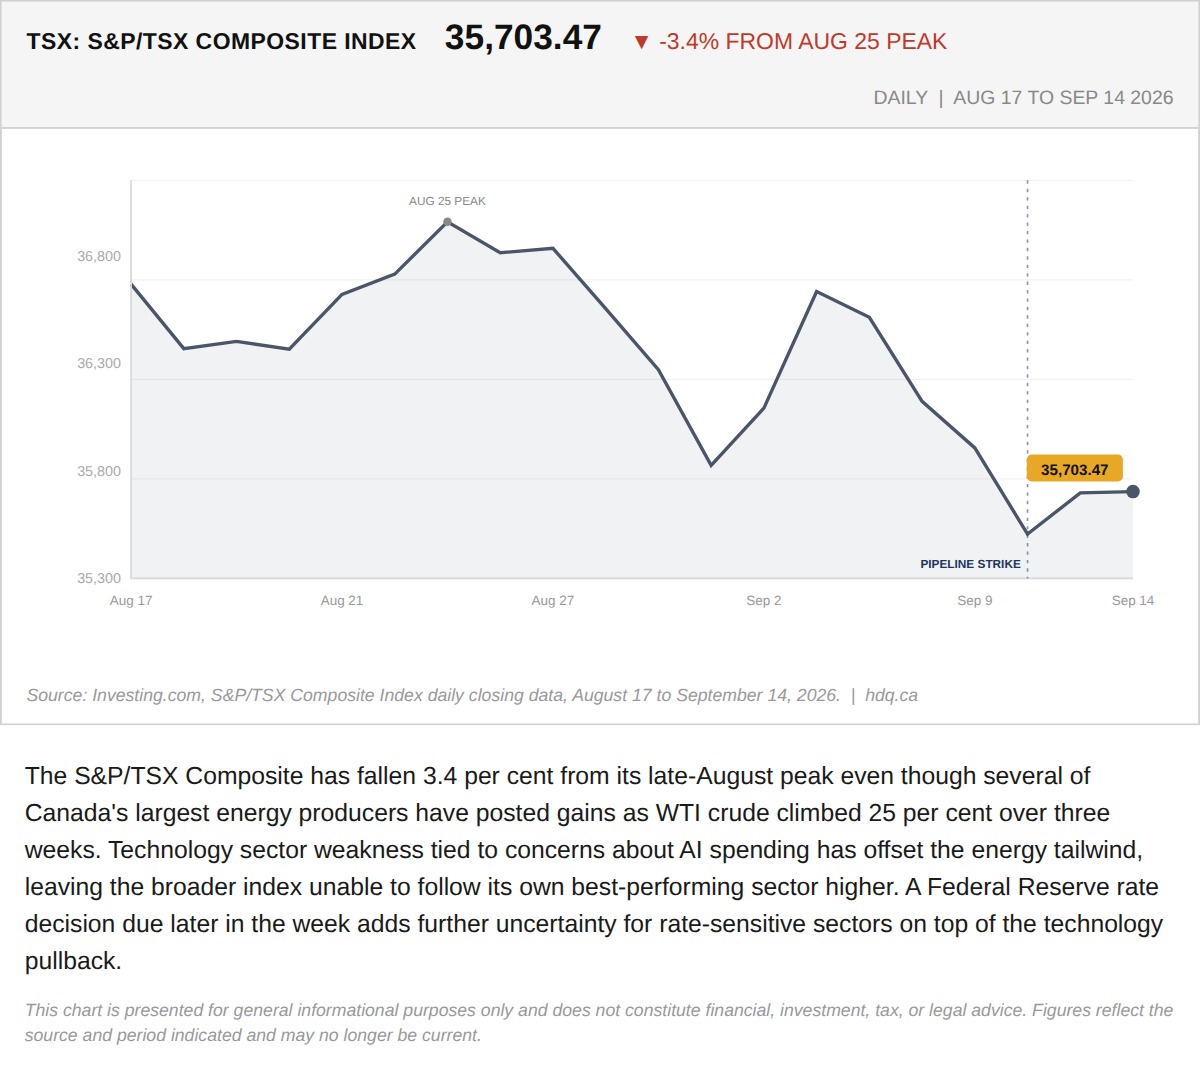
The S&P/TSX Composite has fallen 3.4 per cent from its late-August peak even though several of Canada's largest energy producers have…
TSX Composite Down 3.4% From Its August Peak, Even With Energy Stocks Leading the Market Higher
September 15, 2026
View chart & download