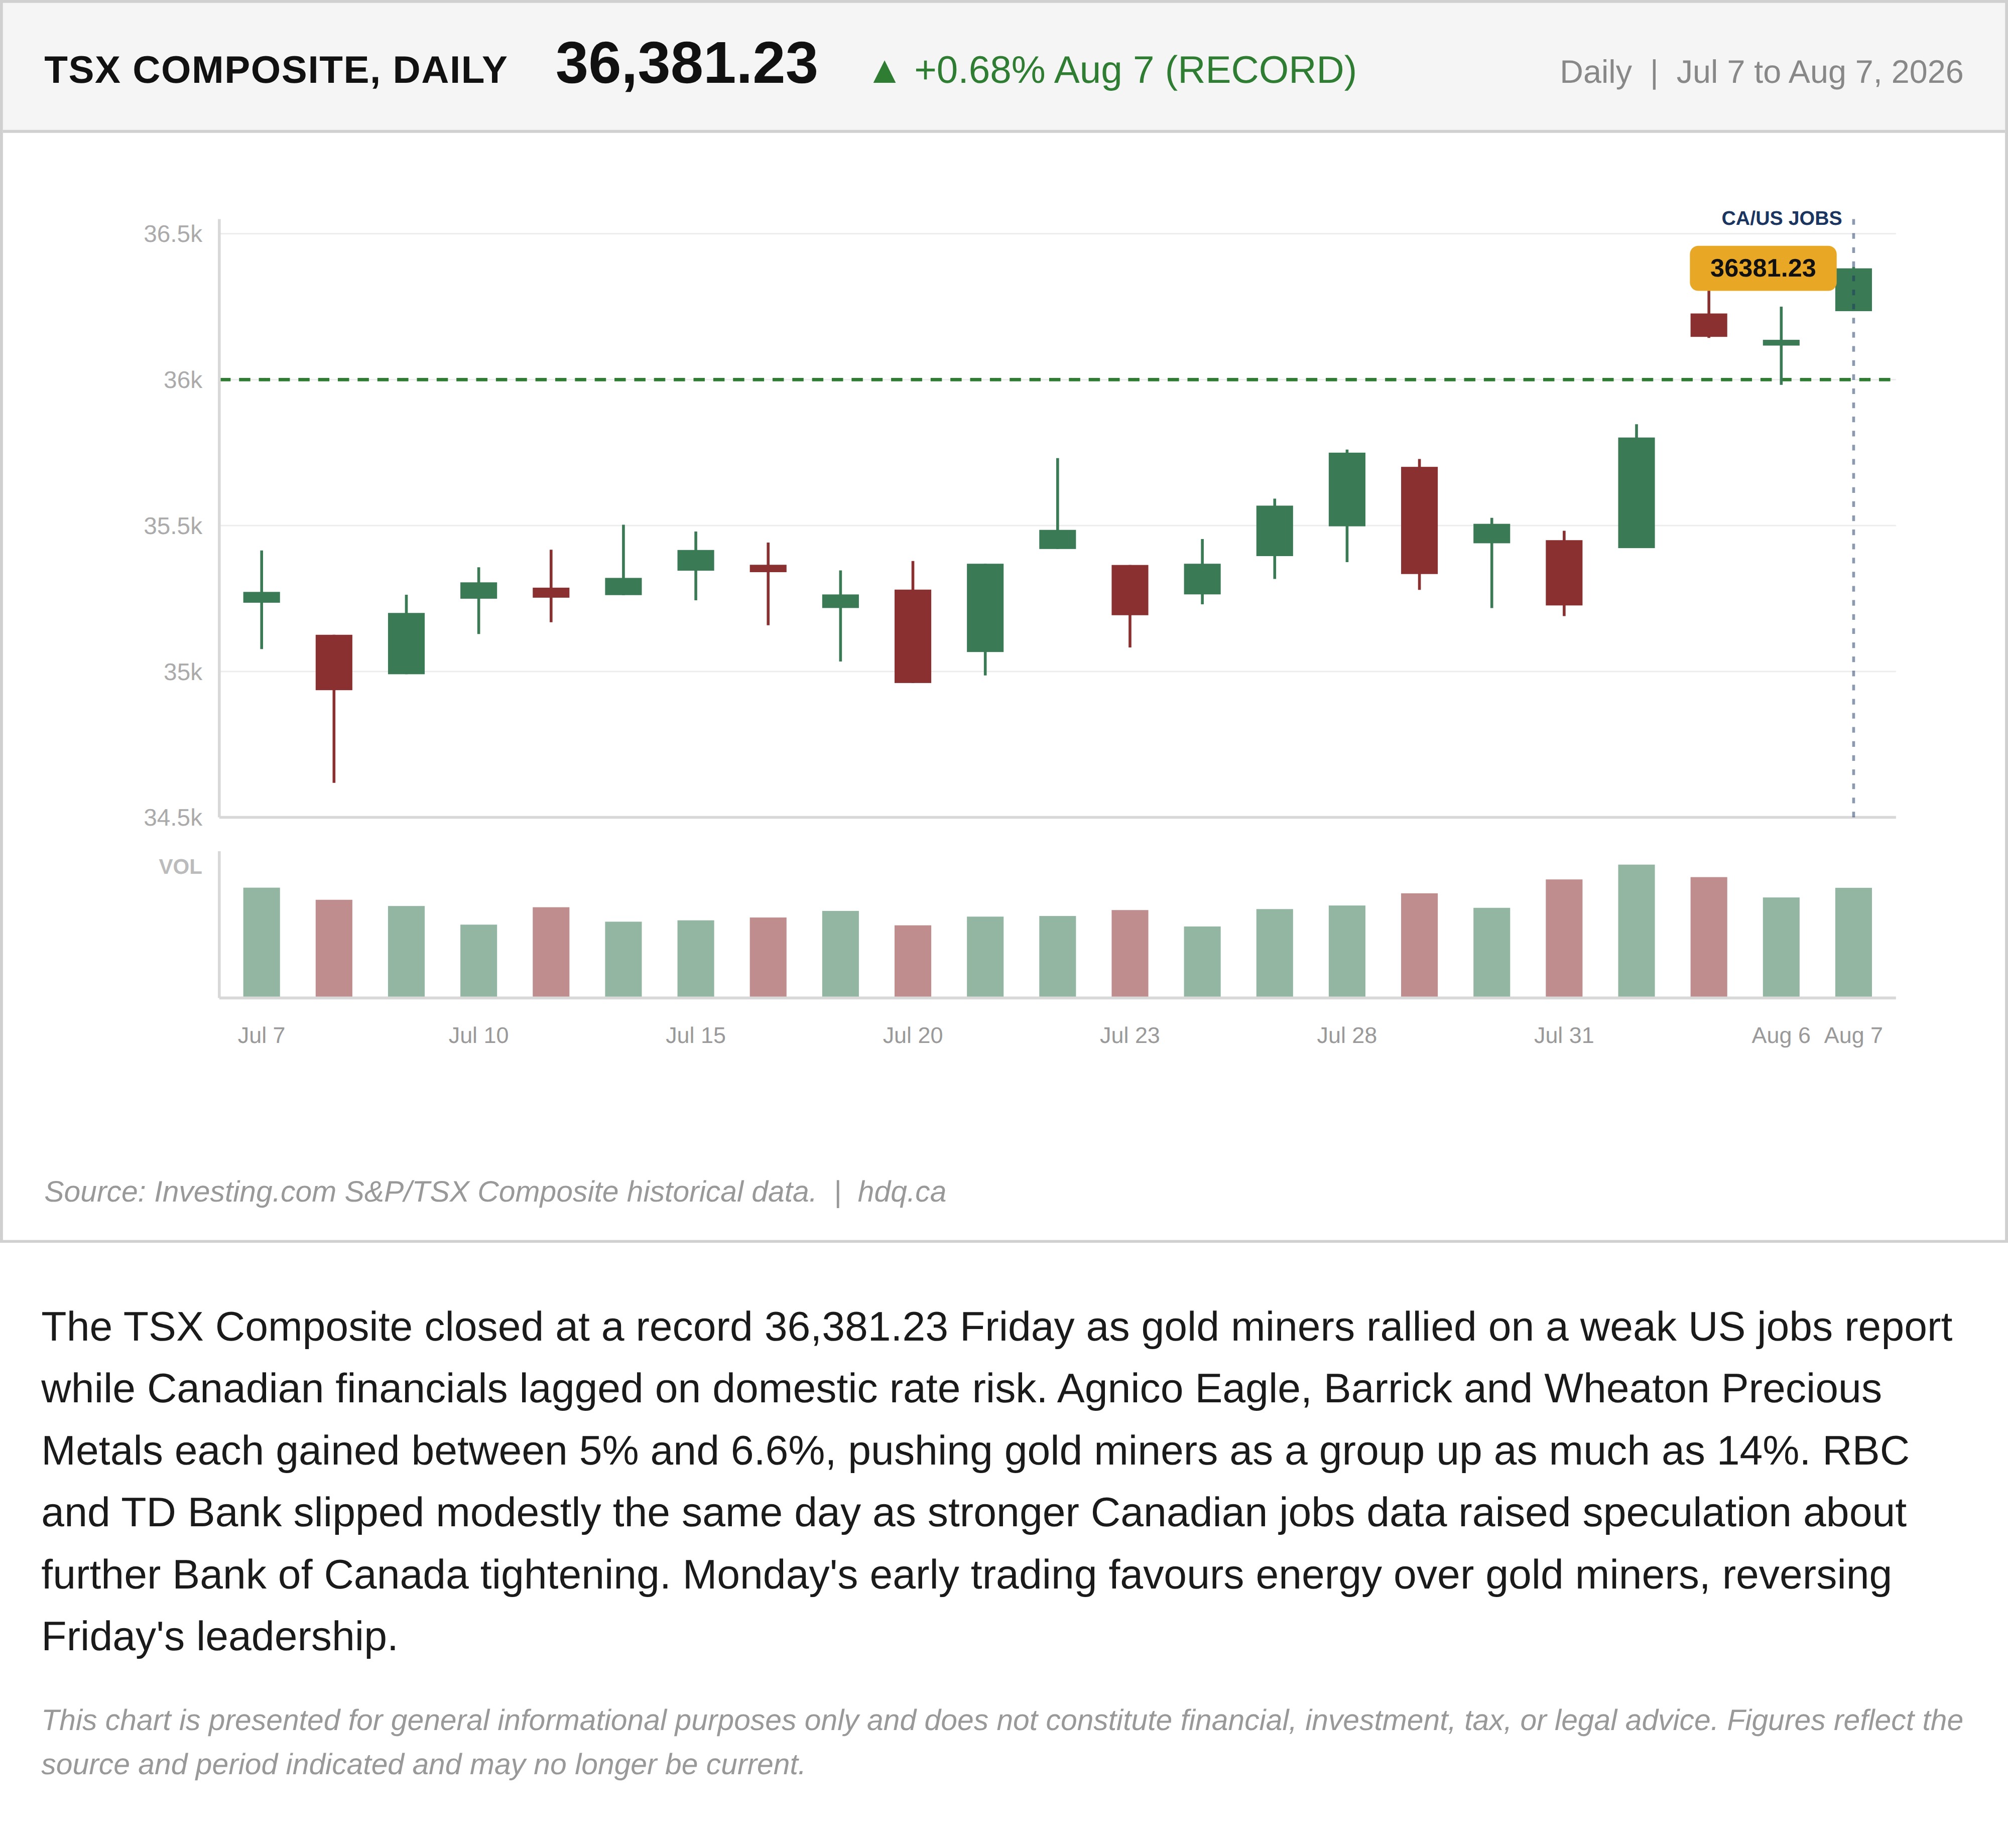
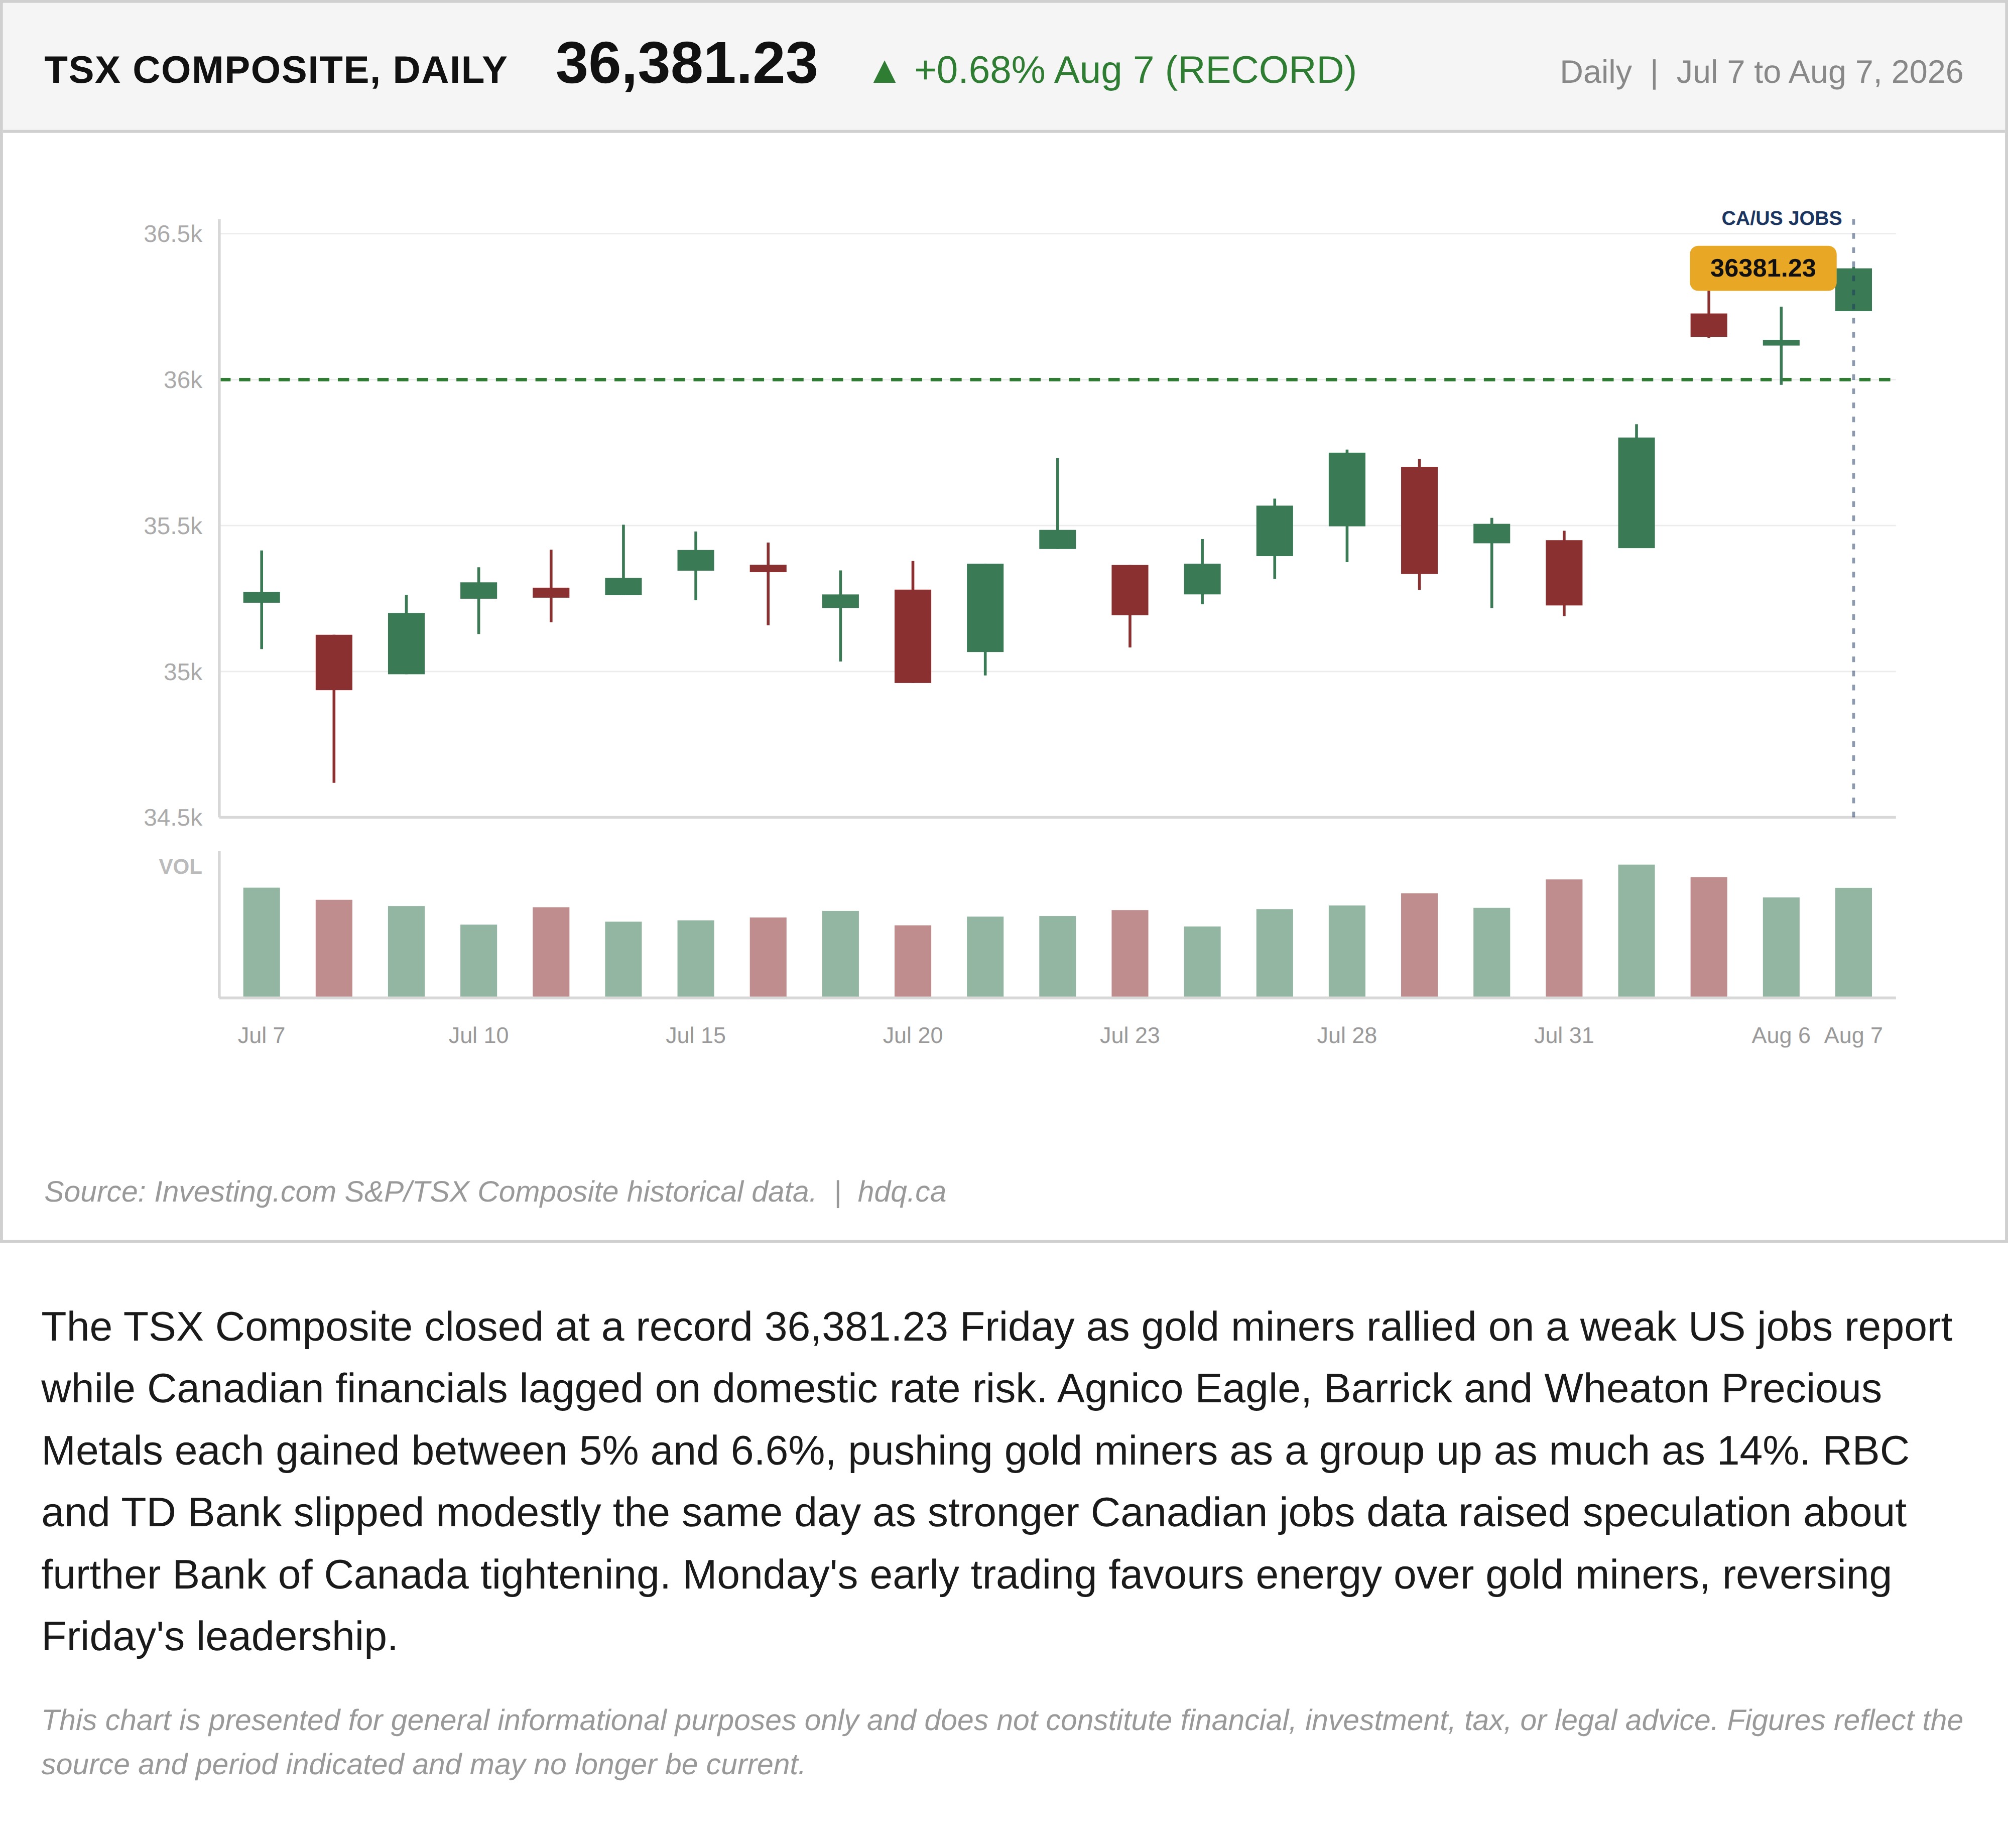
The TSX Composite closed at a record 36,381.23 Friday as gold miners rallied on a weak US jobs report while Canadian financials lagged on domestic rate risk. Agnico Eagle, Barrick and Wheaton Precious Metals each gained between 5% and 6.6%, pushing gold miners as a group up as much as 14%. RBC and TD Bank slipped modestly the same day as stronger Canadian jobs data raised speculation about further Bank of Canada tightening. Monday's early trading favours energy over gold miners, reversing Friday's leadership.
This chart is presented for general informational purposes only and does not constitute financial, investment, tax, or legal advice. Figures reflect the source and period indicated and may no longer be current.
Related charts
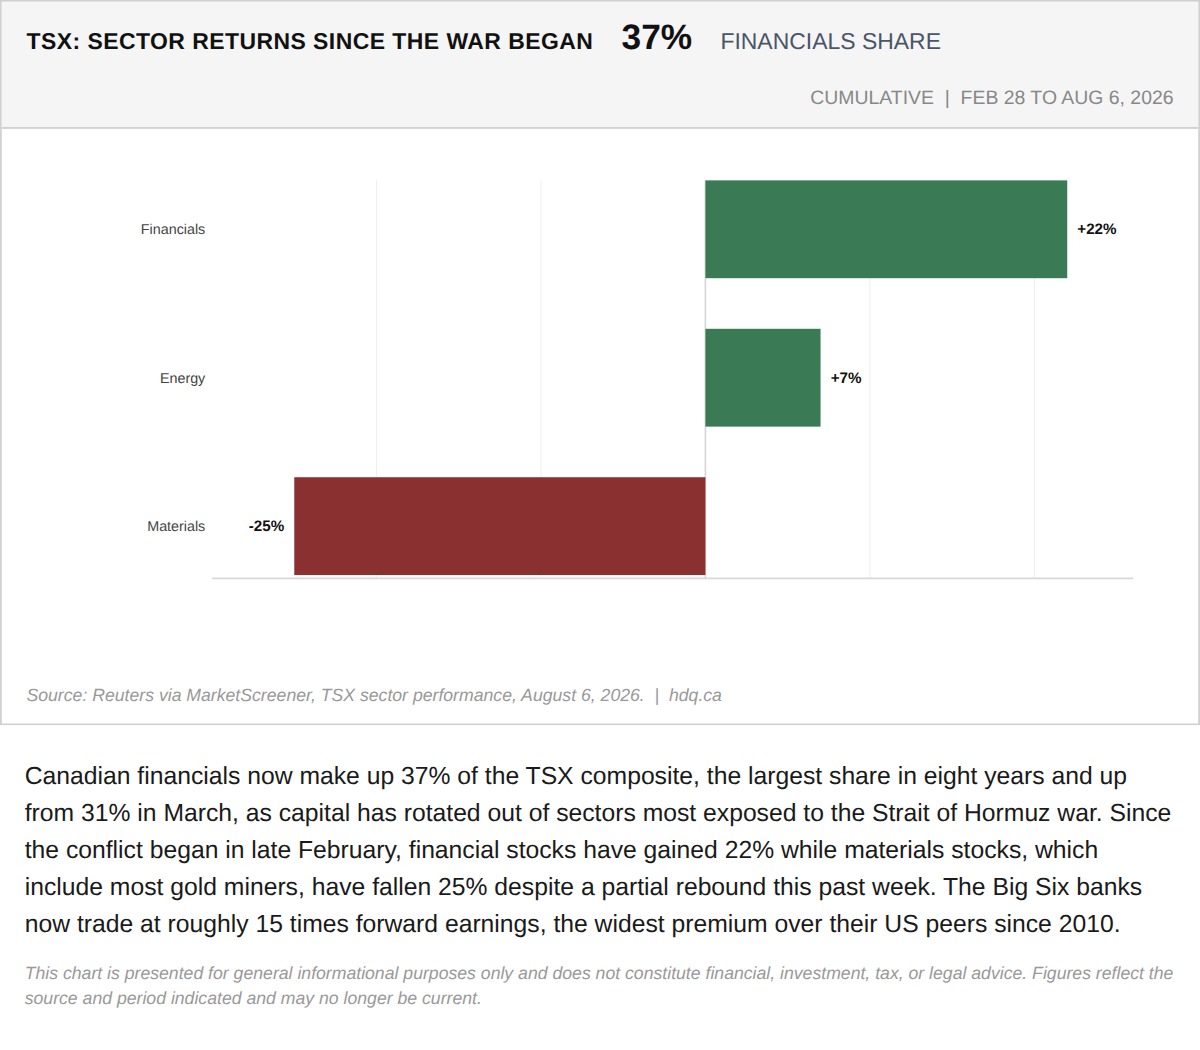
Canadian financials now make up 37% of the TSX composite, the largest share in eight years and up from 31% in March, as capital has rotated…
Canadian Bank Stocks Reach 37% of the TSX Composite
August 6, 2026
View chart & download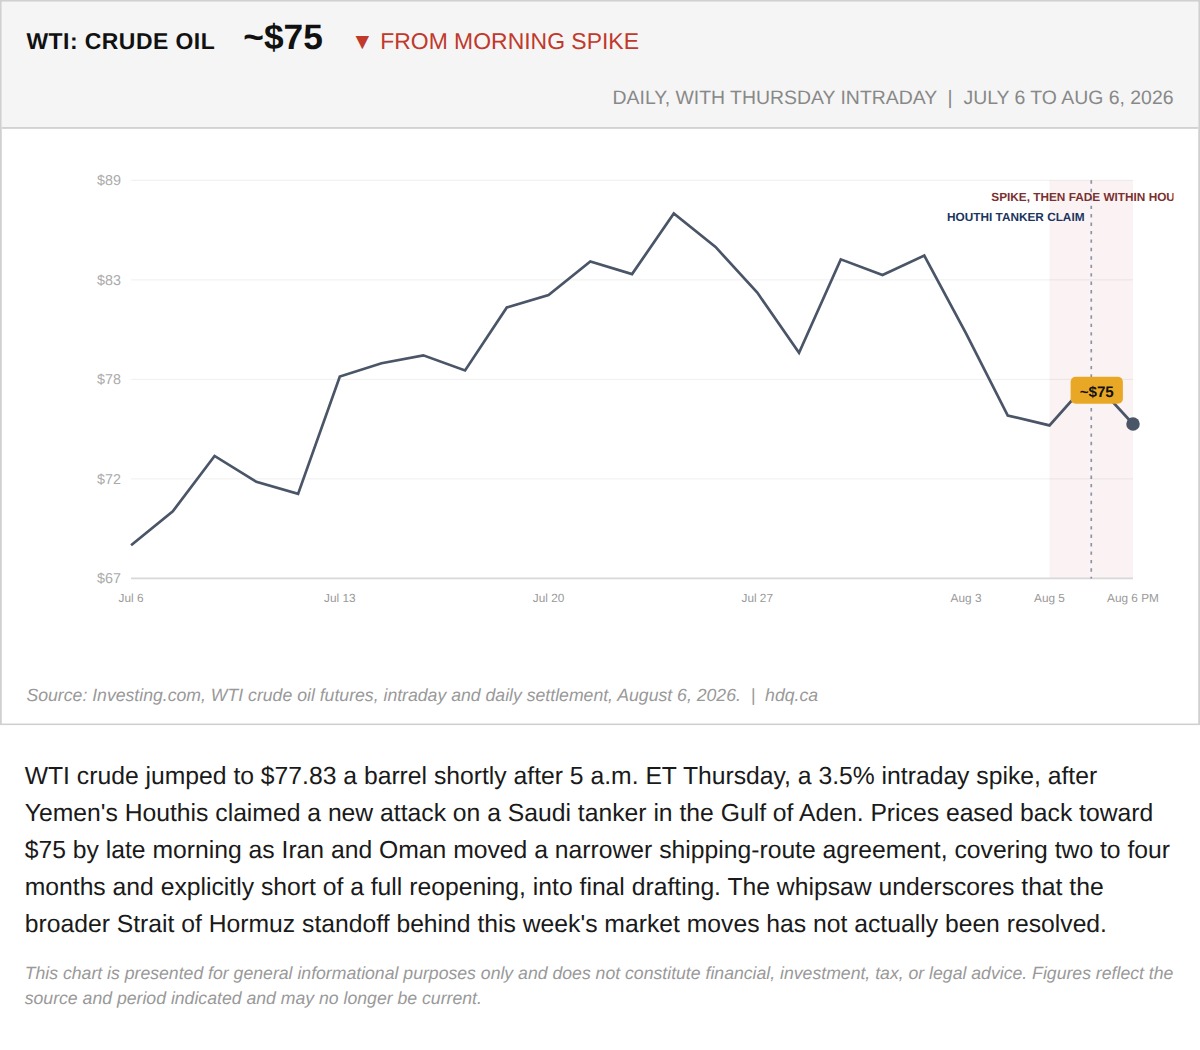
WTI crude jumped to $77.83 a barrel shortly after 5 a.m.
WTI Crude Slips Back to $75 After Thursday's Pre-Dawn Spike
August 6, 2026
View chart & download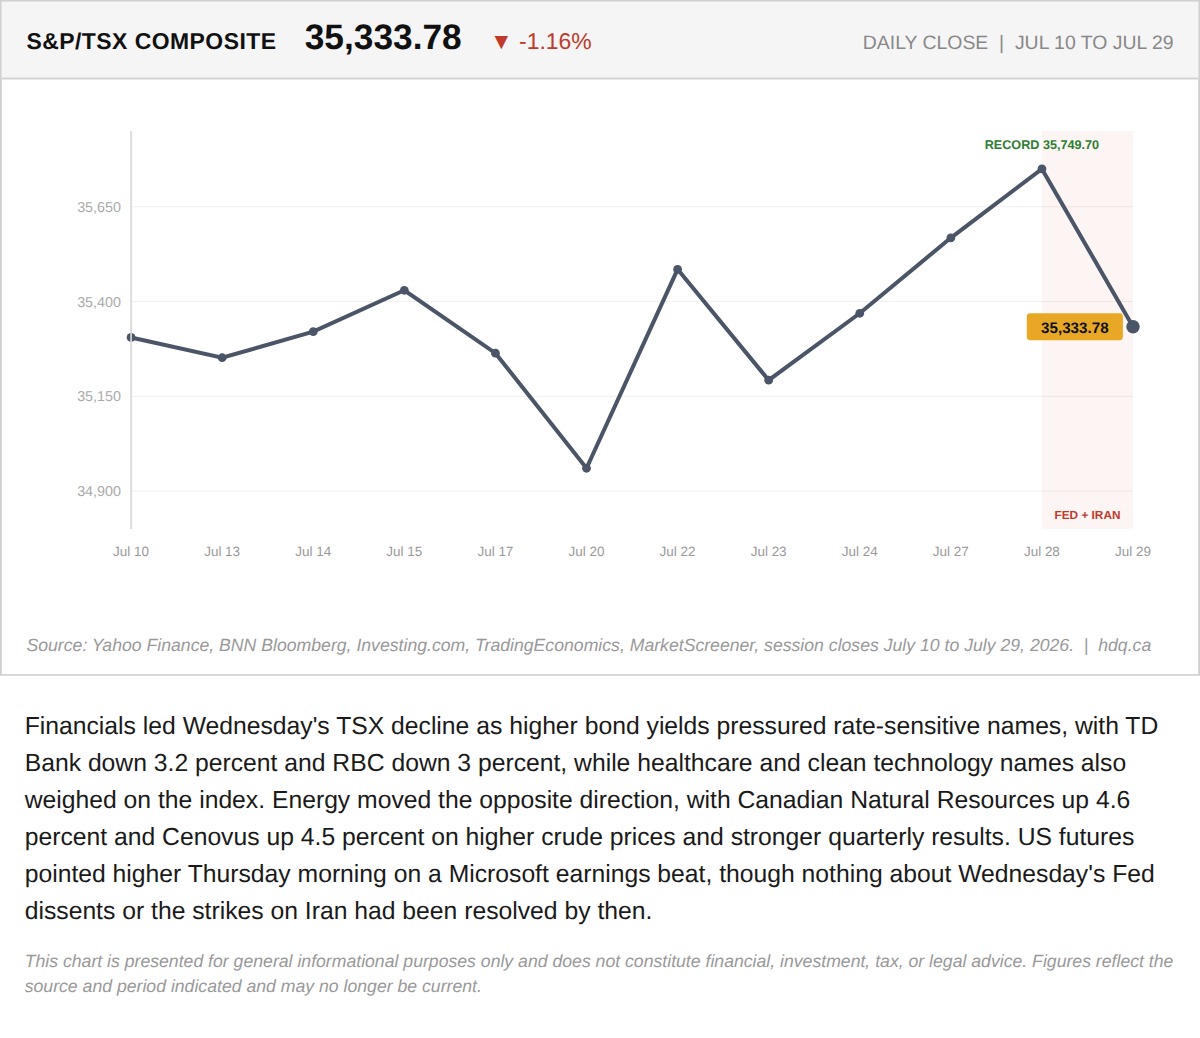
Financials led Wednesday's TSX decline as higher bond yields pressured rate-sensitive names, with TD Bank down 3.2 percent and RBC down 3…
The TSX Fell 415 Points Wednesday. Energy Gained. Financials Did the Damage.
July 30, 2026
View chart & download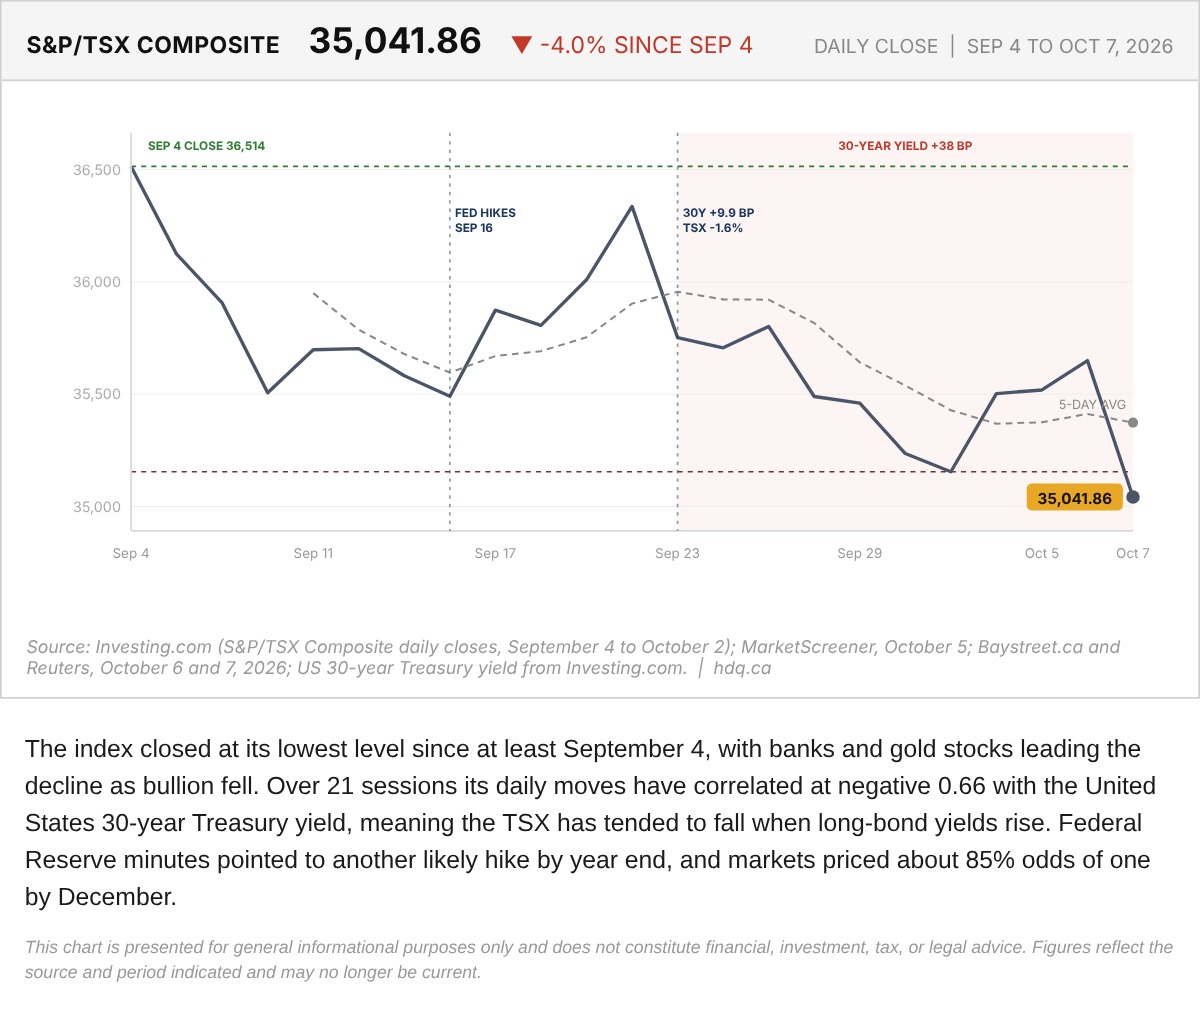
The index closed at its lowest level since at least September 4, with banks and gold stocks leading the decline as bullion fell.
S&P/TSX Composite With Five-Session Average, September 4 to October 7
October 8, 2026
View chart & download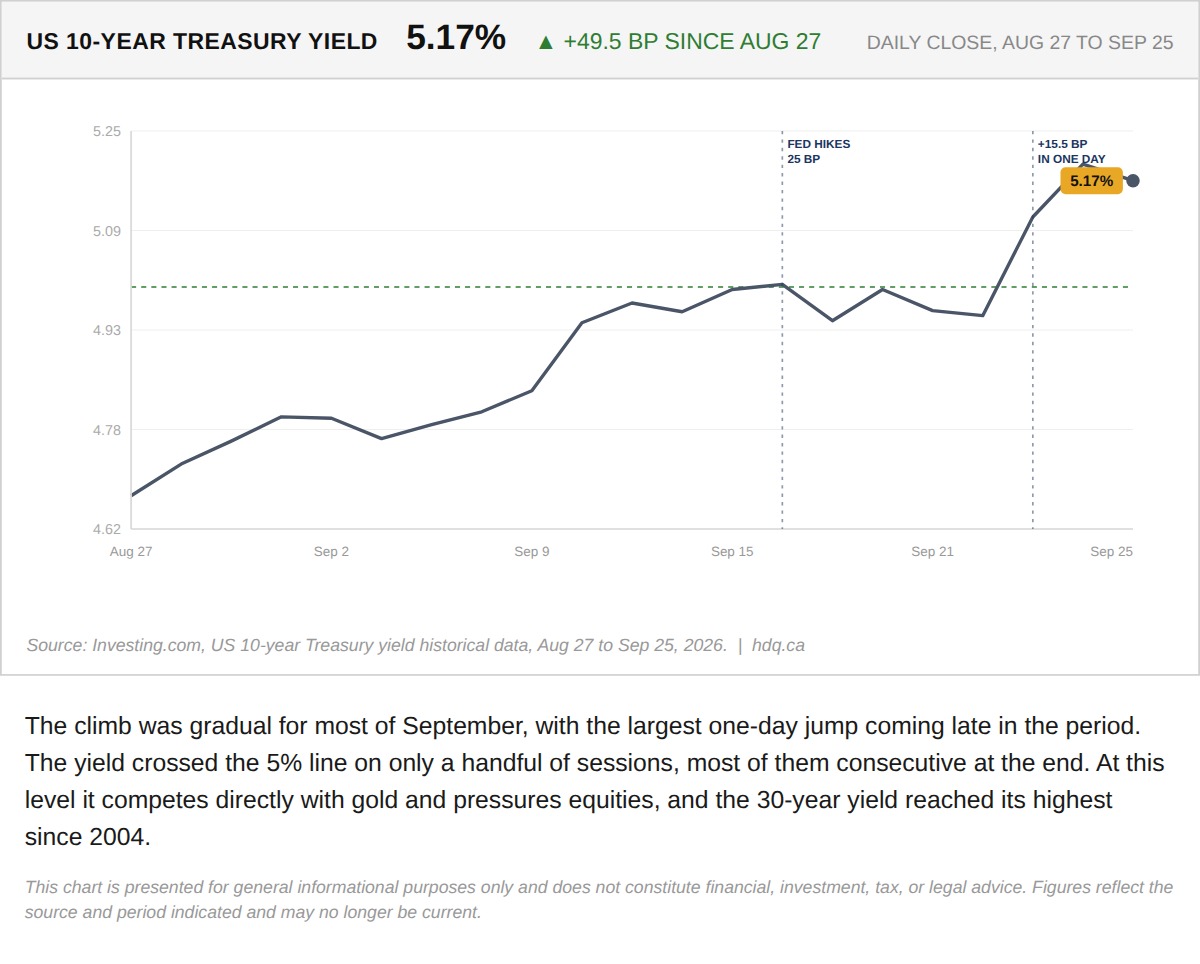
The climb was gradual for most of September, with the largest one-day jump coming late in the period.
US 10-Year Treasury Yield Rises Steadily Through September
September 28, 2026
View chart & download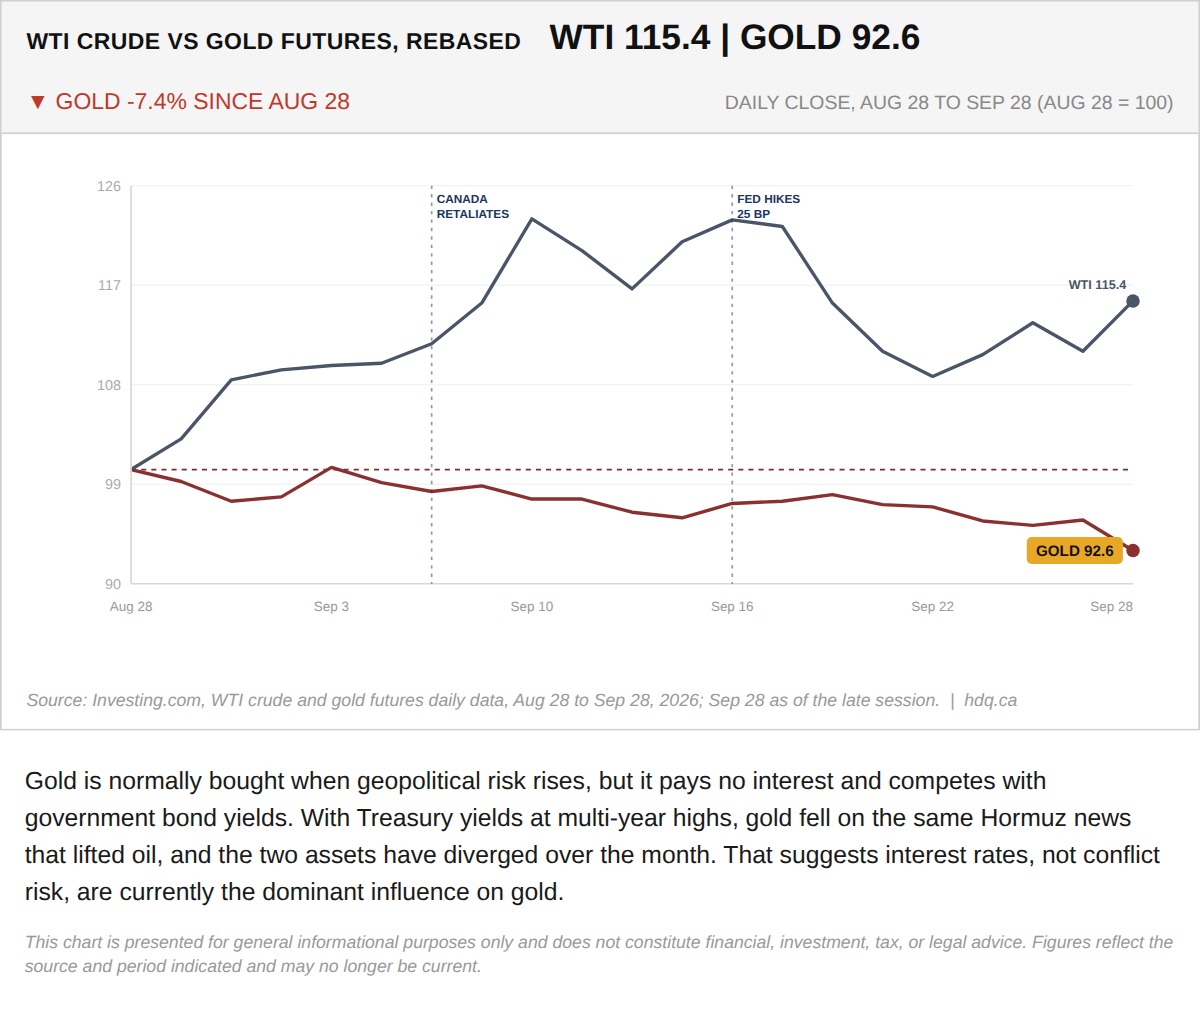
Gold is normally bought when geopolitical risk rises, but it pays no interest and competes with government bond yields.
Gold Falls While Oil Rises as Hormuz Talks Stall
September 28, 2026
View chart & download