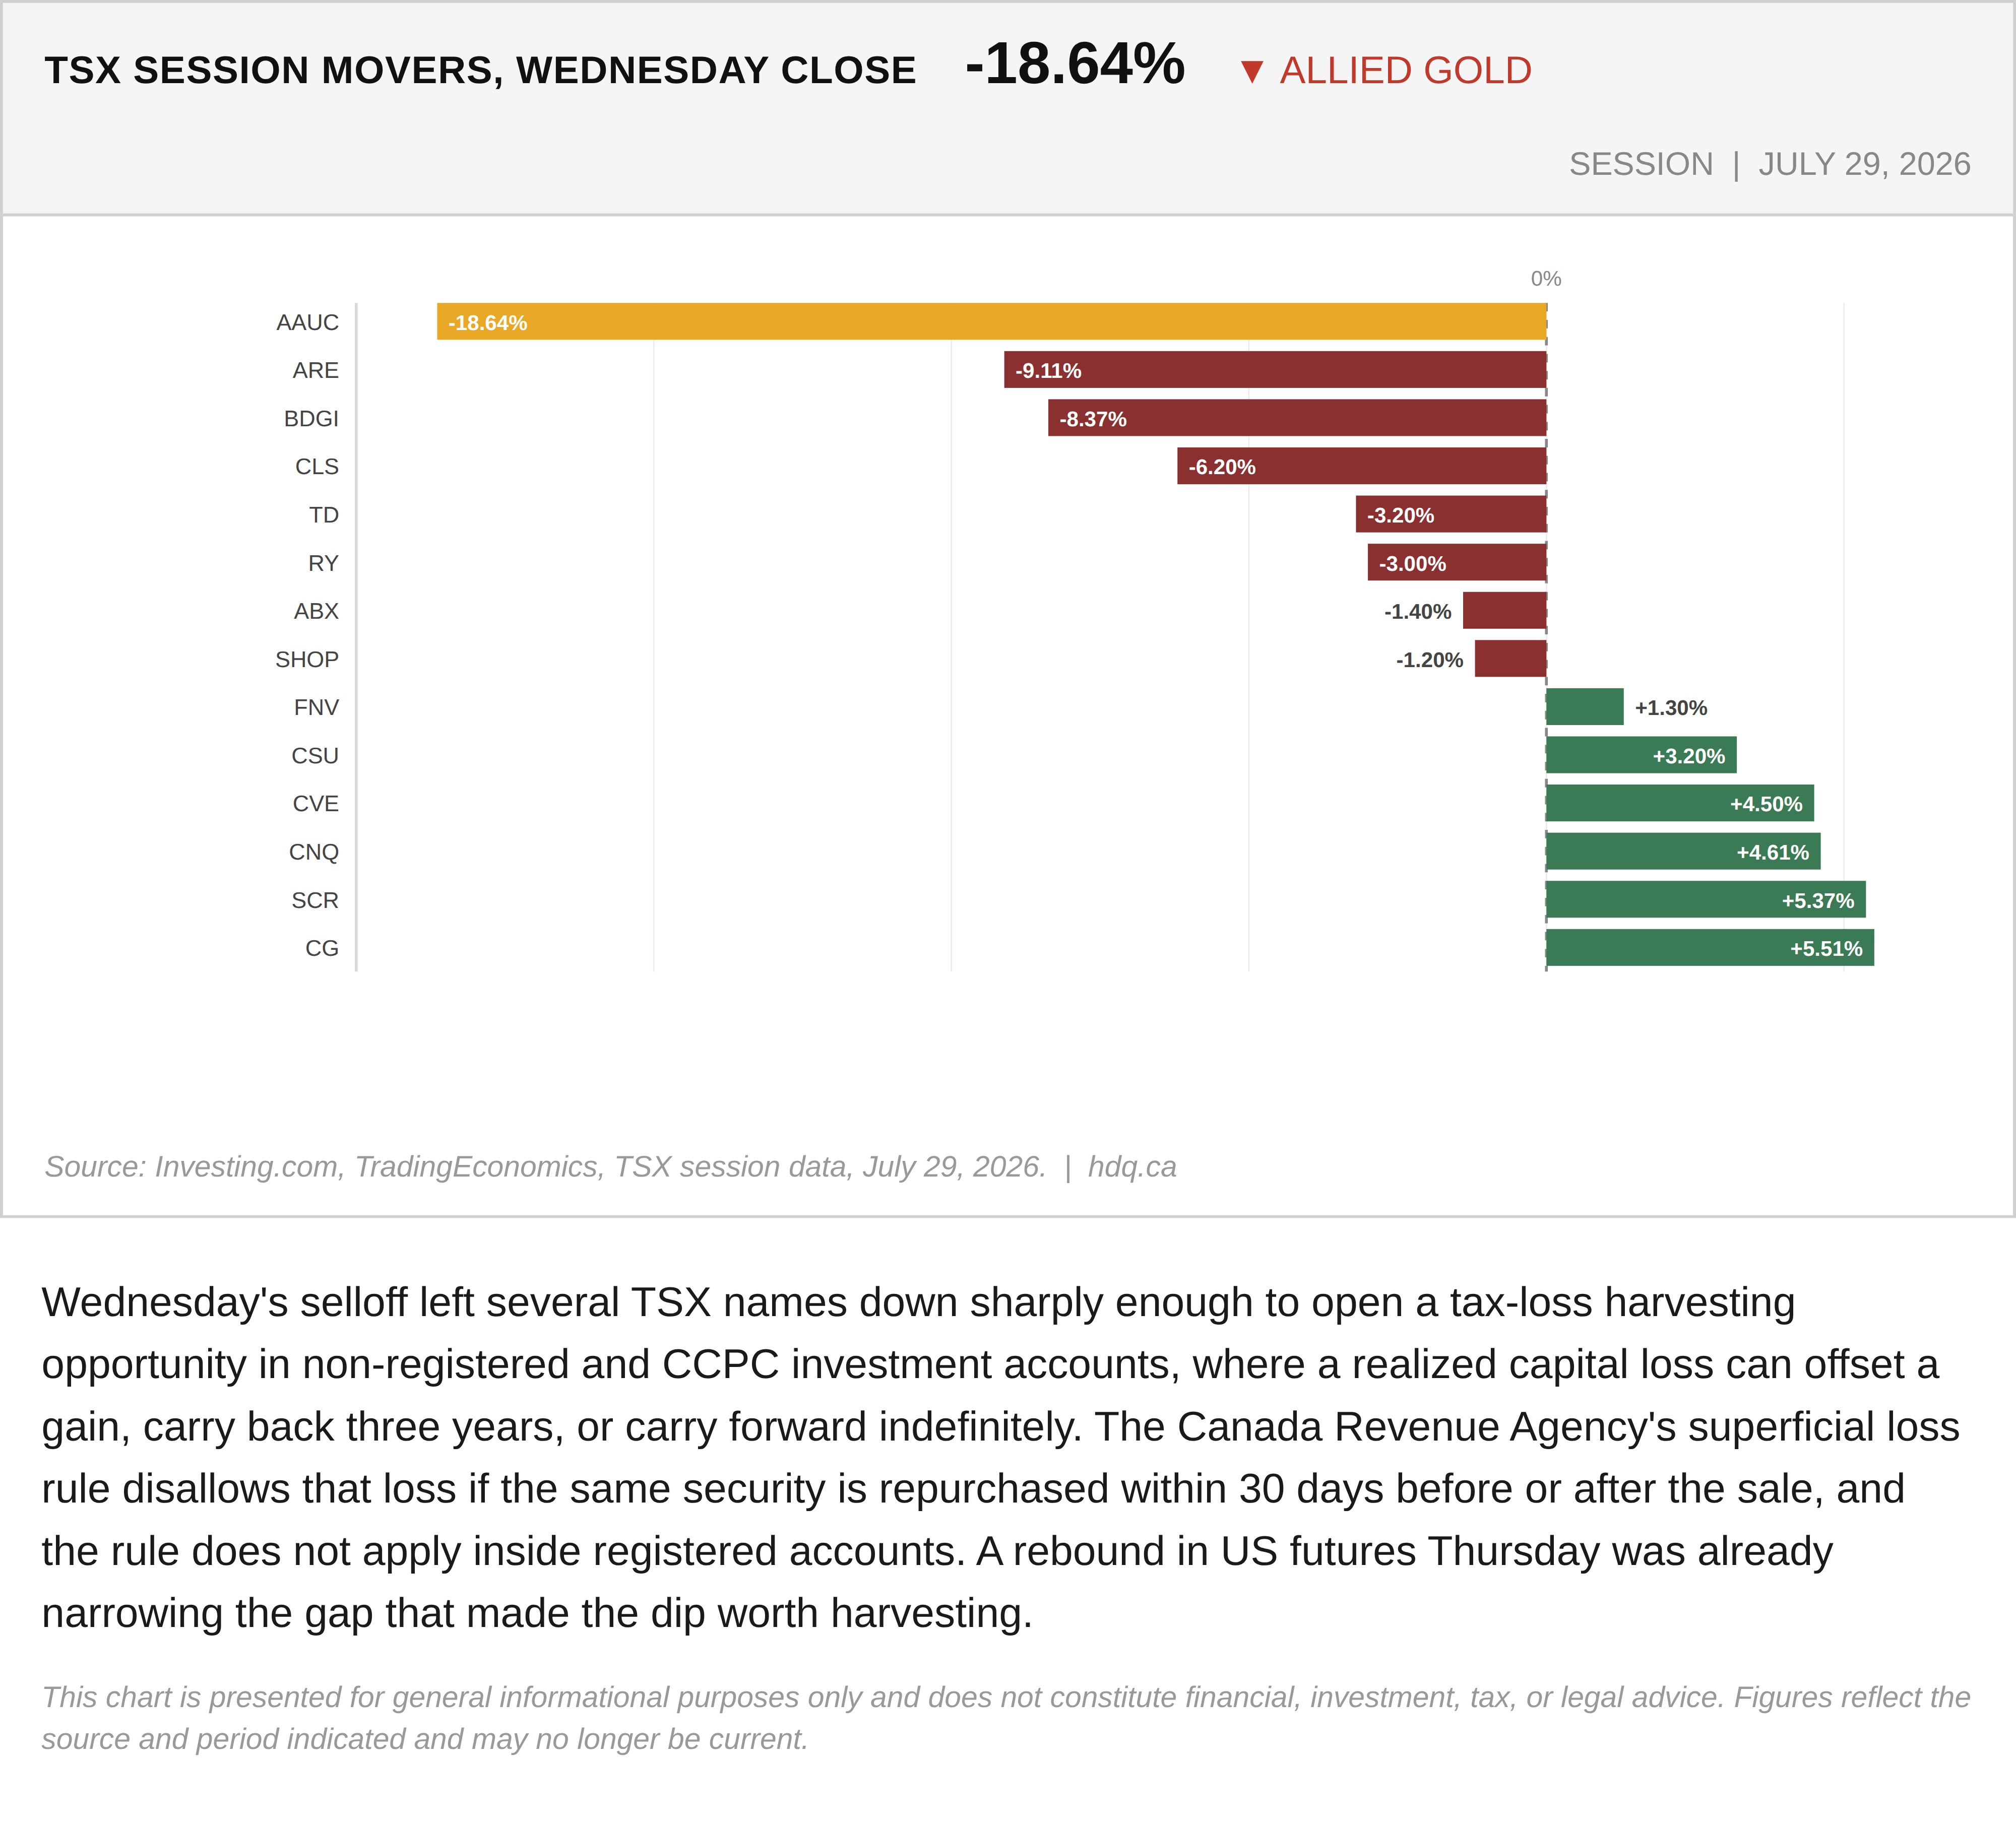
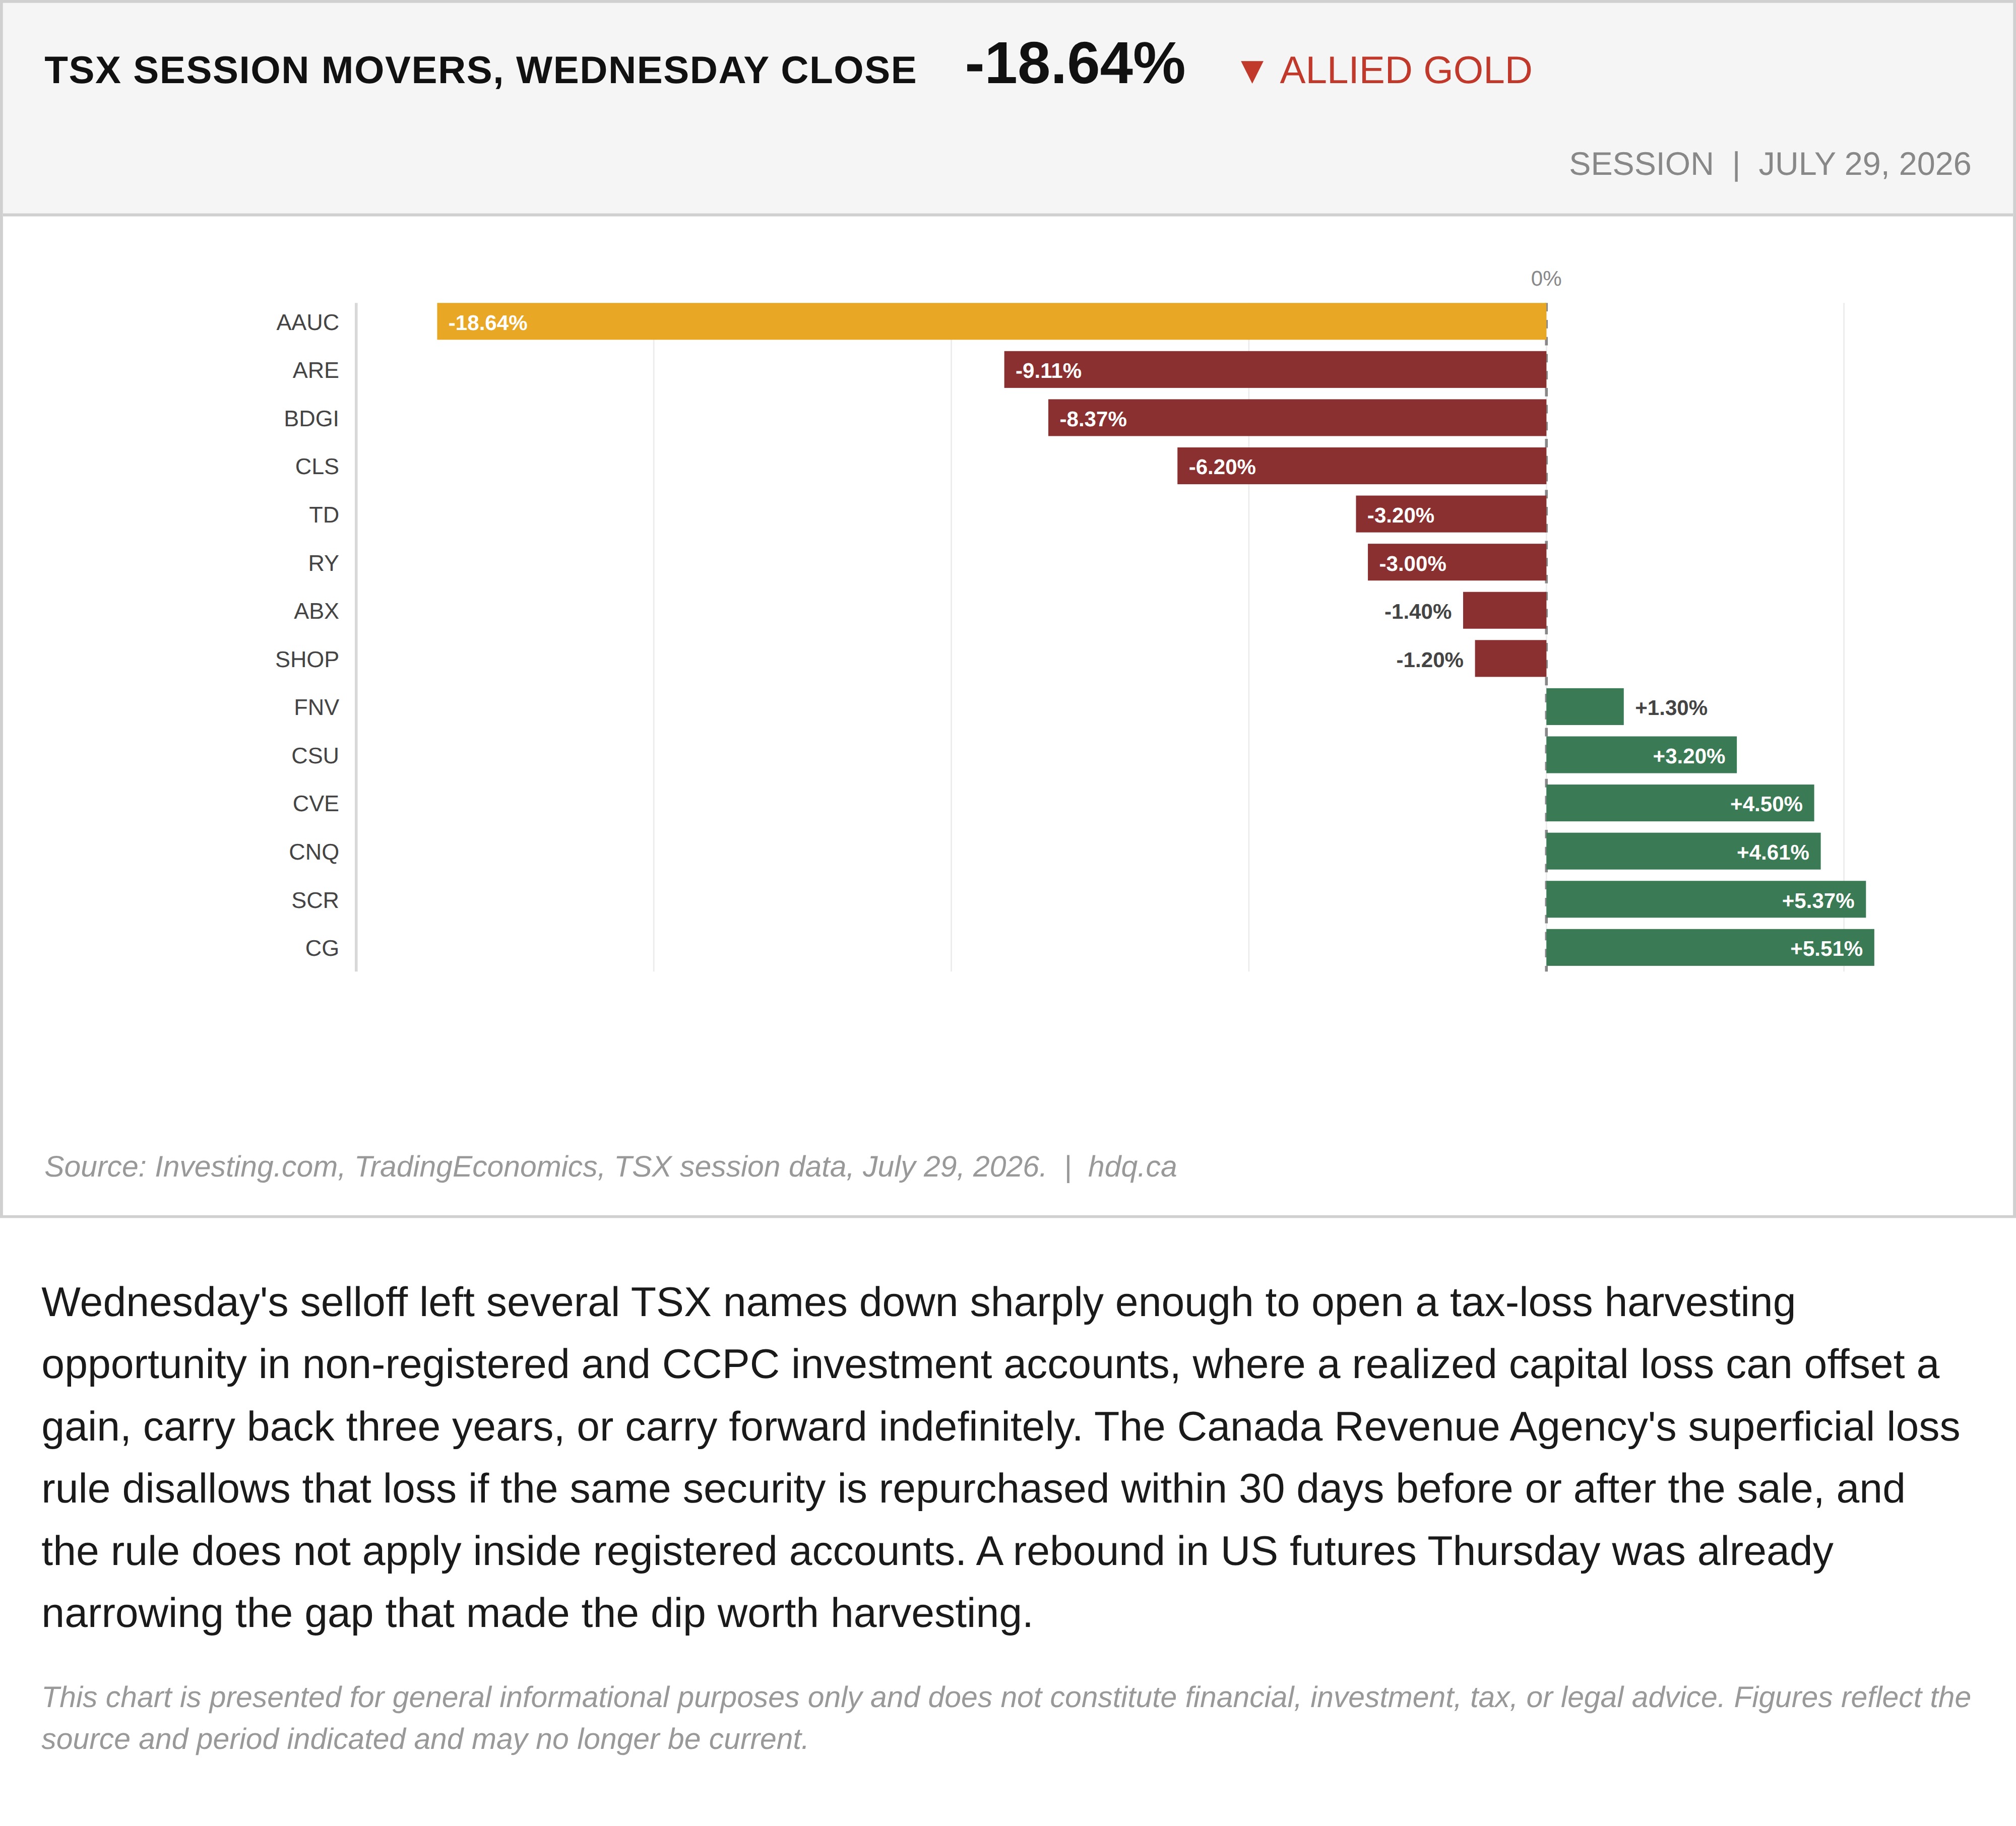
Wednesday's selloff left several TSX names down sharply enough to open a tax-loss harvesting opportunity in non-registered and CCPC investment accounts, where a realized capital loss can offset a gain, carry back three years, or carry forward indefinitely. The Canada Revenue Agency's superficial loss rule disallows that loss if the same security is repurchased within 30 days before or after the sale, and the rule does not apply inside registered accounts. A rebound in US futures Thursday was already narrowing the gap that made the dip worth harvesting.
This chart is presented for general informational purposes only and does not constitute financial, investment, tax, or legal advice. Figures reflect the source and period indicated and may no longer be current.
Related charts
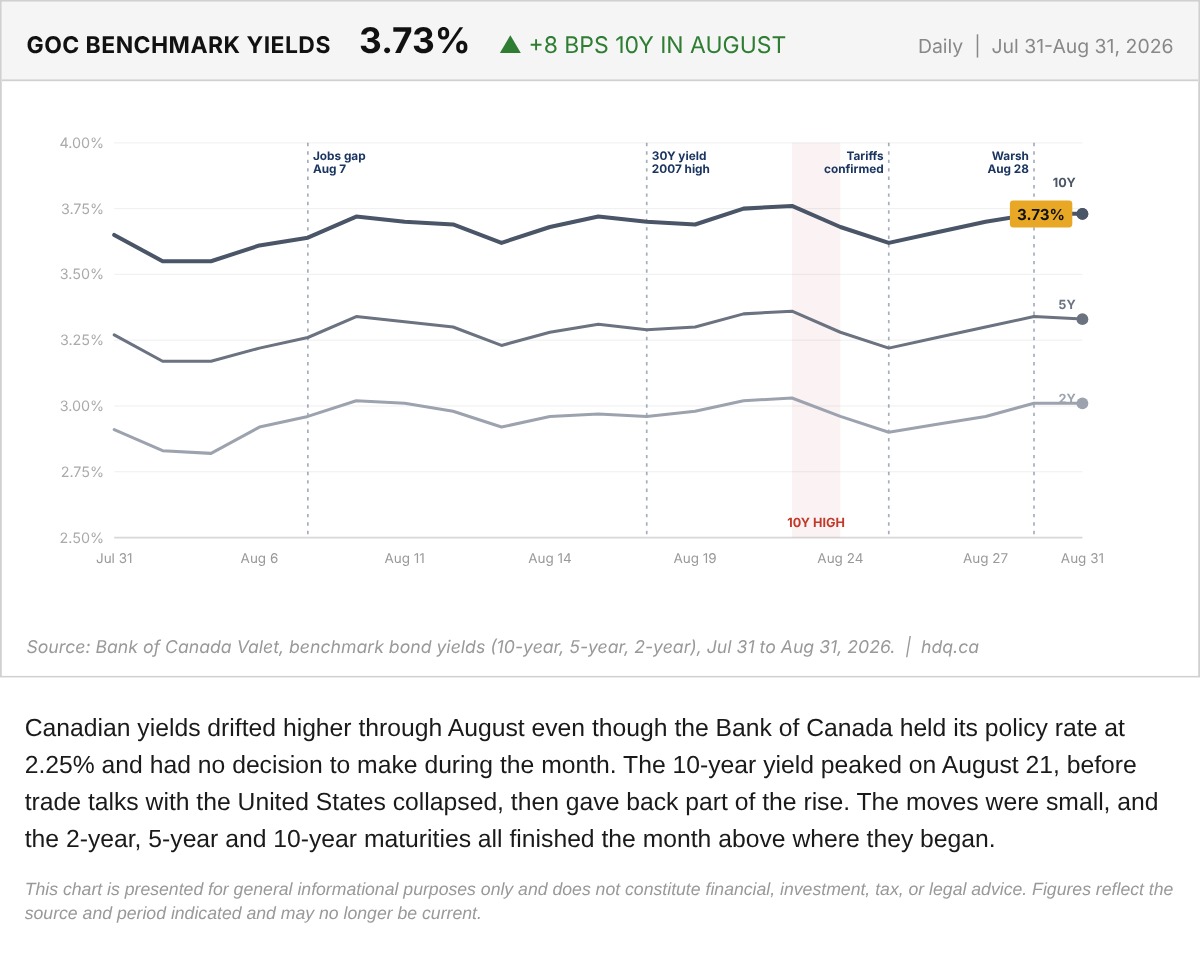
Canadian yields drifted higher through August even though the Bank of Canada held its policy rate at 2.25% and had no decision to make during the month.
Government of Canada Benchmark Yields, August 2026
August 31, 2026
View chart & download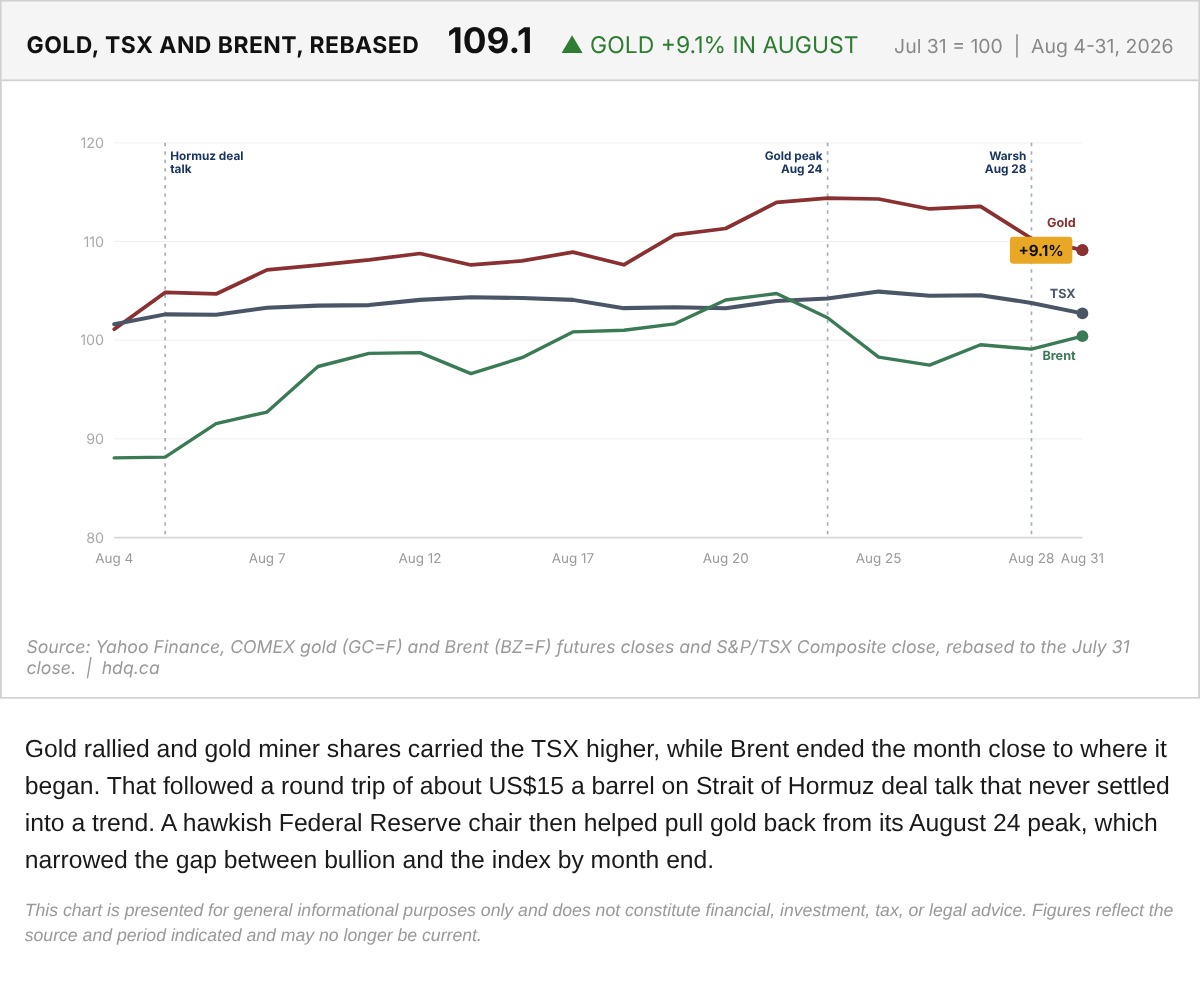
Gold rallied and gold miner shares carried the TSX higher, while Brent ended the month close to where it began.
Gold, TSX and Brent Rebased to the July 31 Close
August 31, 2026
View chart & download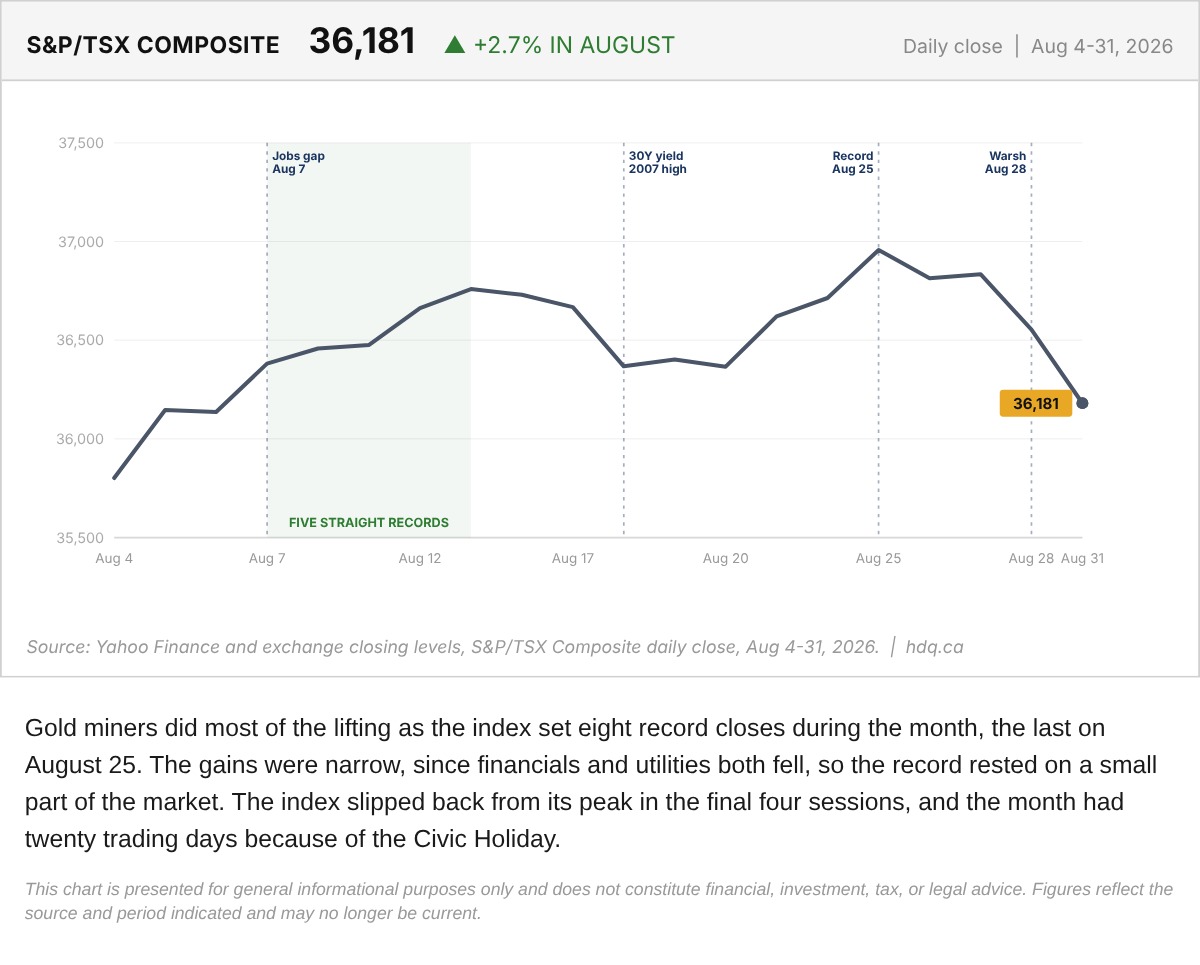
Gold miners did most of the lifting as the index set eight record closes during the month, the last on August 25.
S&P/TSX Composite Daily Close Through August 2026
August 31, 2026
View chart & download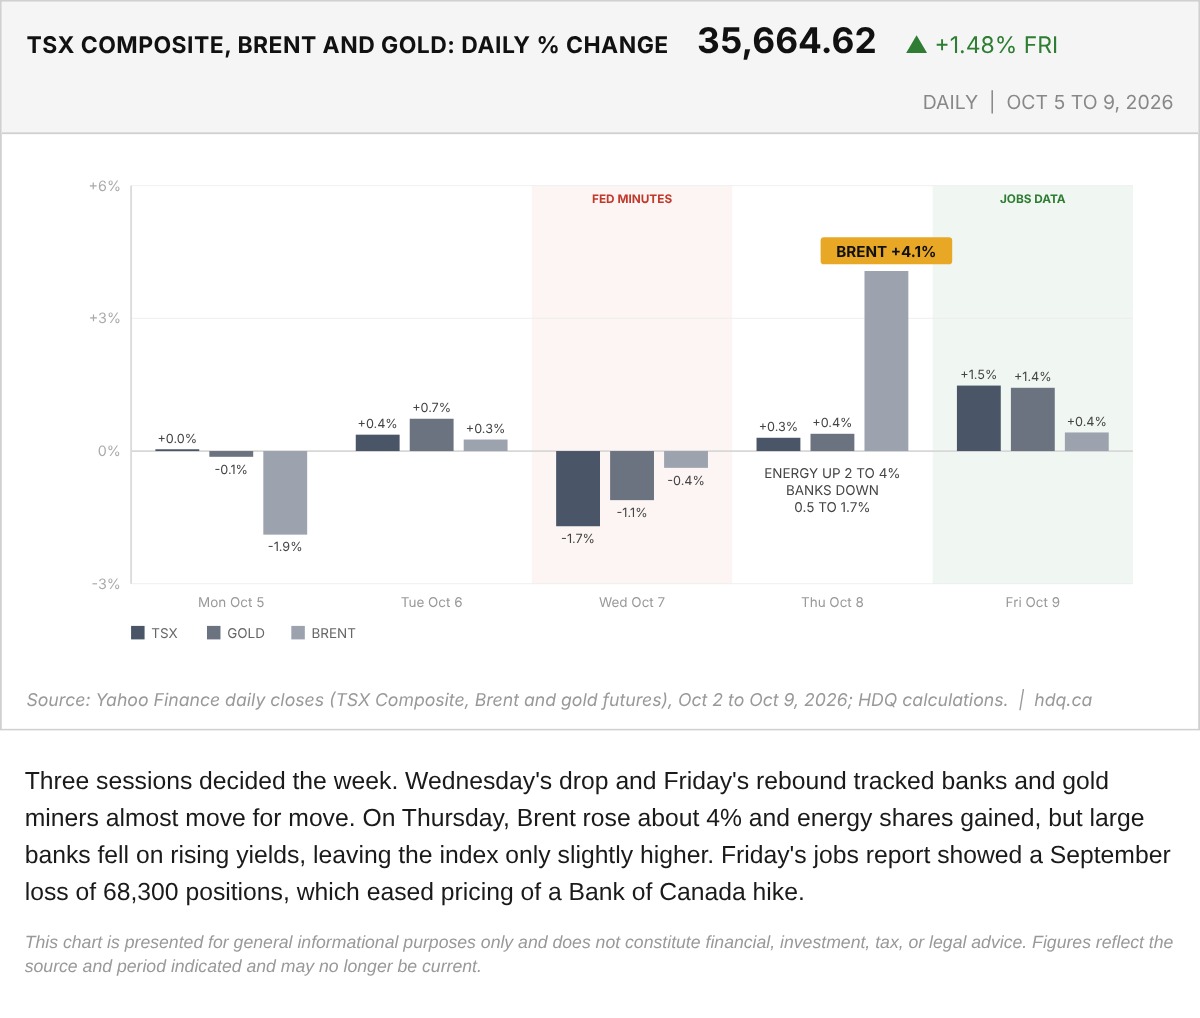
Three sessions decided the week.
TSX, Brent and Gold Daily Percentage Changes, October 5 to 9
October 10, 2026
View chart & download
Brent was the only one of the three to finish above its starting level, while the index and gold both fell.
Brent, TSX and Gold Rebased to the August 31 Close
September 30, 2026
View chart & download
The Bank of Canada held its policy rate at 2.25% for a seventh straight time, yet Canadian yields rose as United States yields surged.
Government of Canada Benchmark Yields, September 2026
September 30, 2026
View chart & download