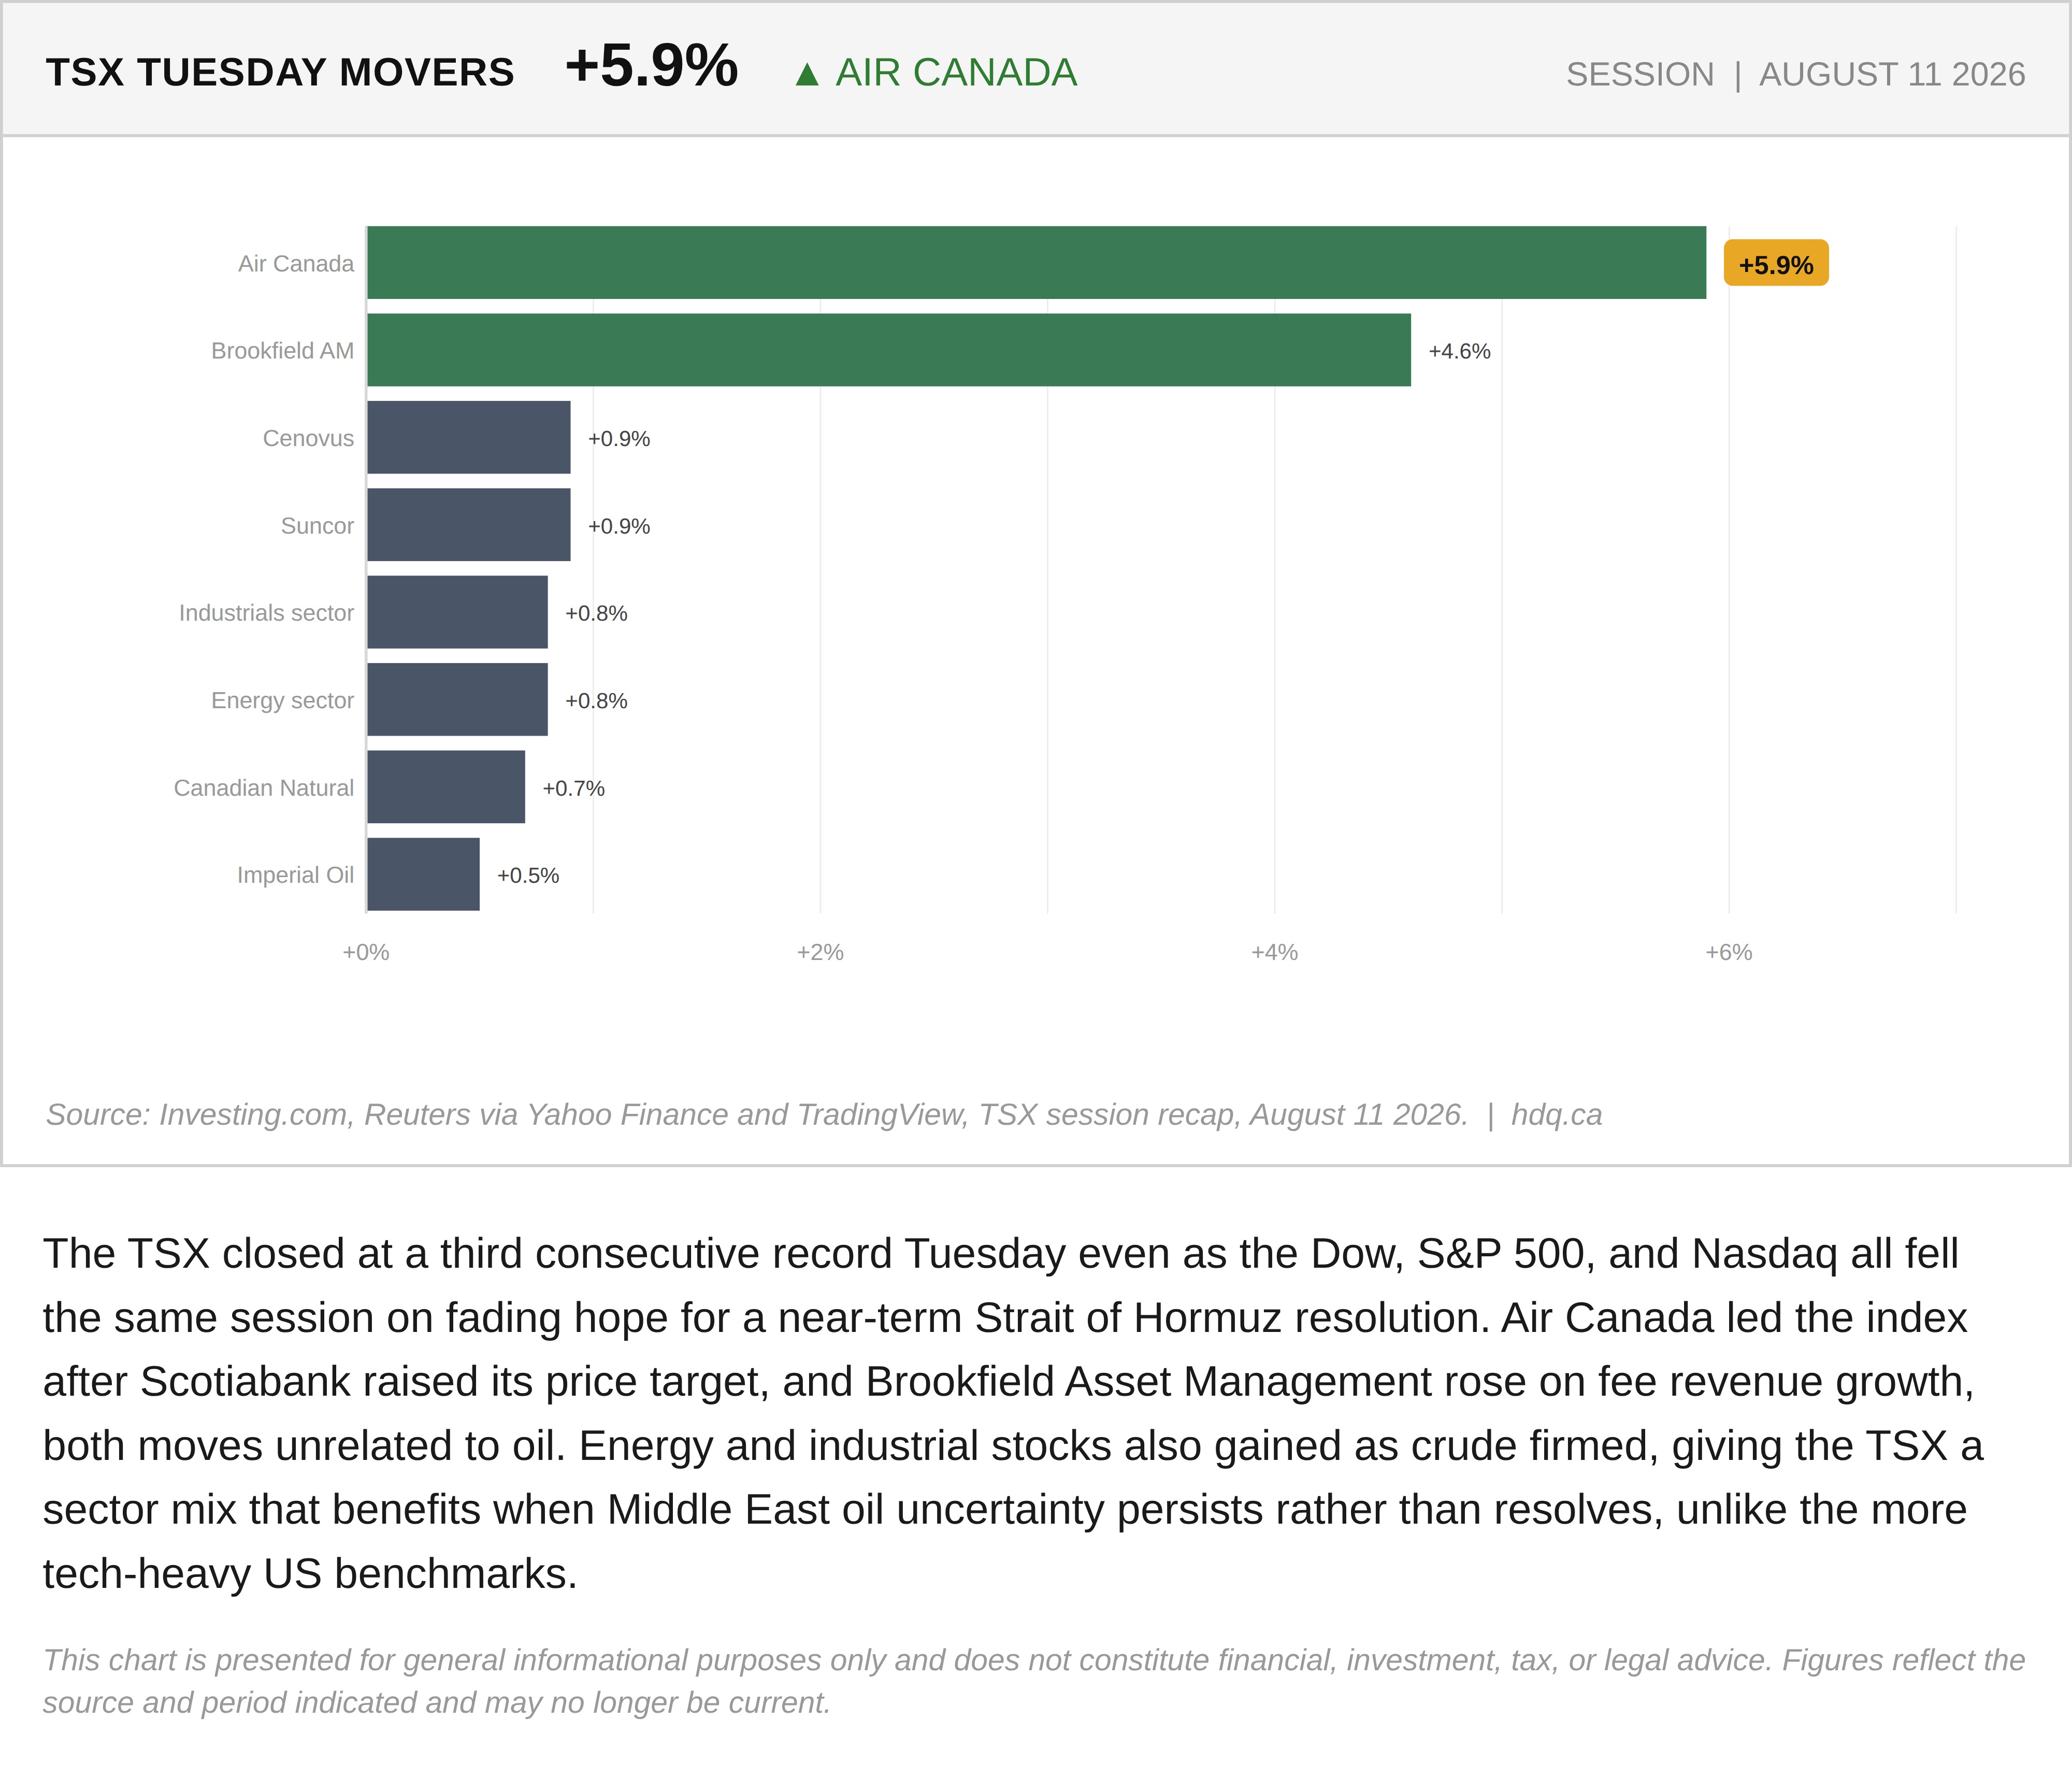
The TSX closed at a third consecutive record Tuesday even as the Dow, S&P 500, and Nasdaq all fell the same session on fading hope for a near-term Strait of Hormuz resolution. Air Canada led the index after Scotiabank raised its price target, and Brookfield Asset Management rose on fee revenue growth, both moves unrelated to oil. Energy and industrial stocks also gained as crude firmed, giving the TSX a sector mix that benefits when Middle East oil uncertainty persists rather than resolves, unlike the more tech-heavy US benchmarks.
This chart is presented for general informational purposes only and does not constitute financial, investment, tax, or legal advice. Figures reflect the source and period indicated and may no longer be current.
Related charts
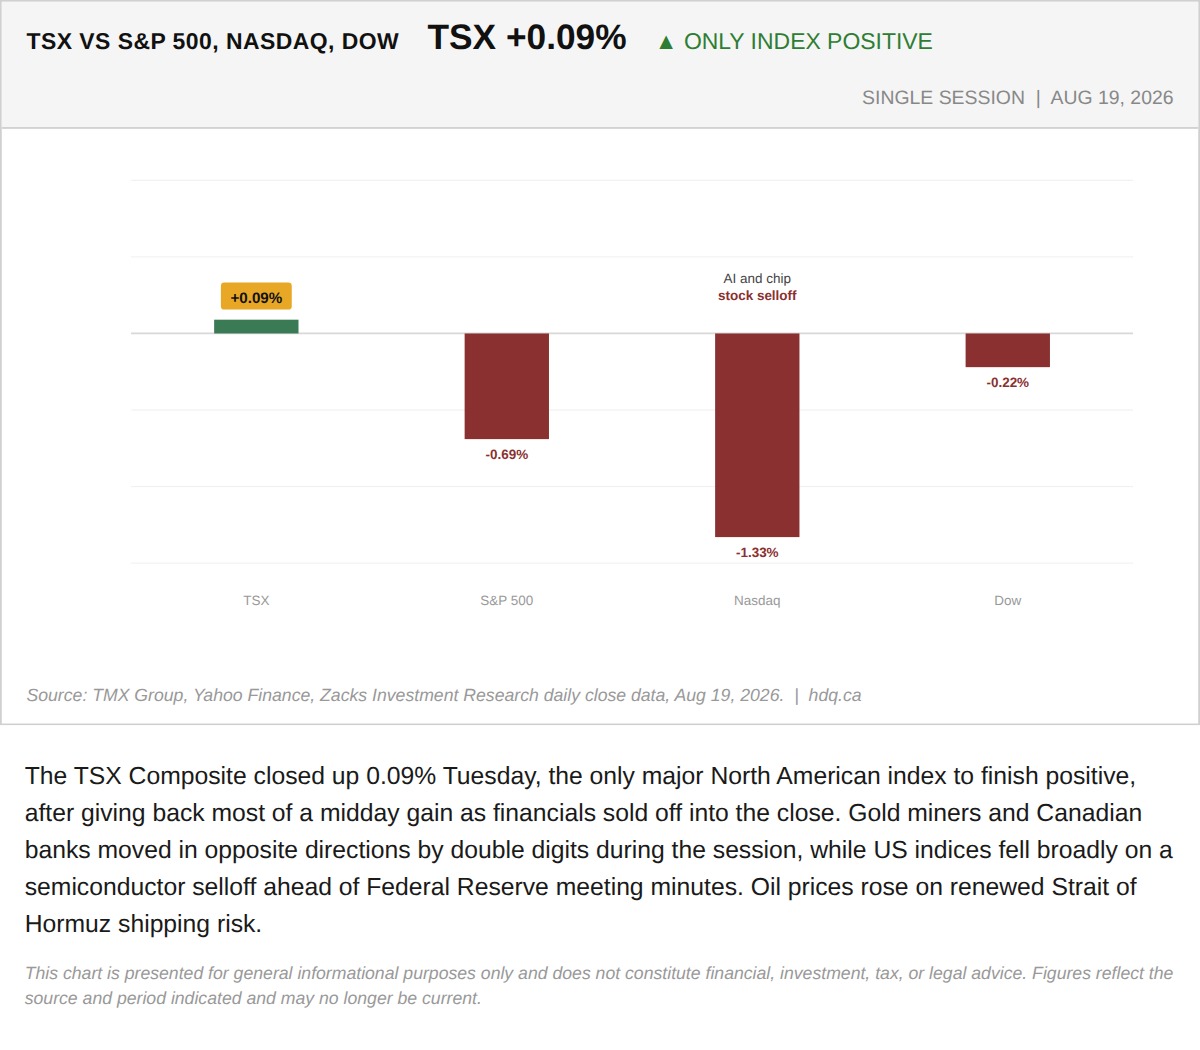
The TSX Composite closed up 0.09% Tuesday, the only major North American index to finish positive, after giving back most of a midday gain as financials sold off into the close.
The TSX Gave Back a 127-Point Tariff Rally as Financials Sold Off Into the Close
August 19, 2026
View chart & download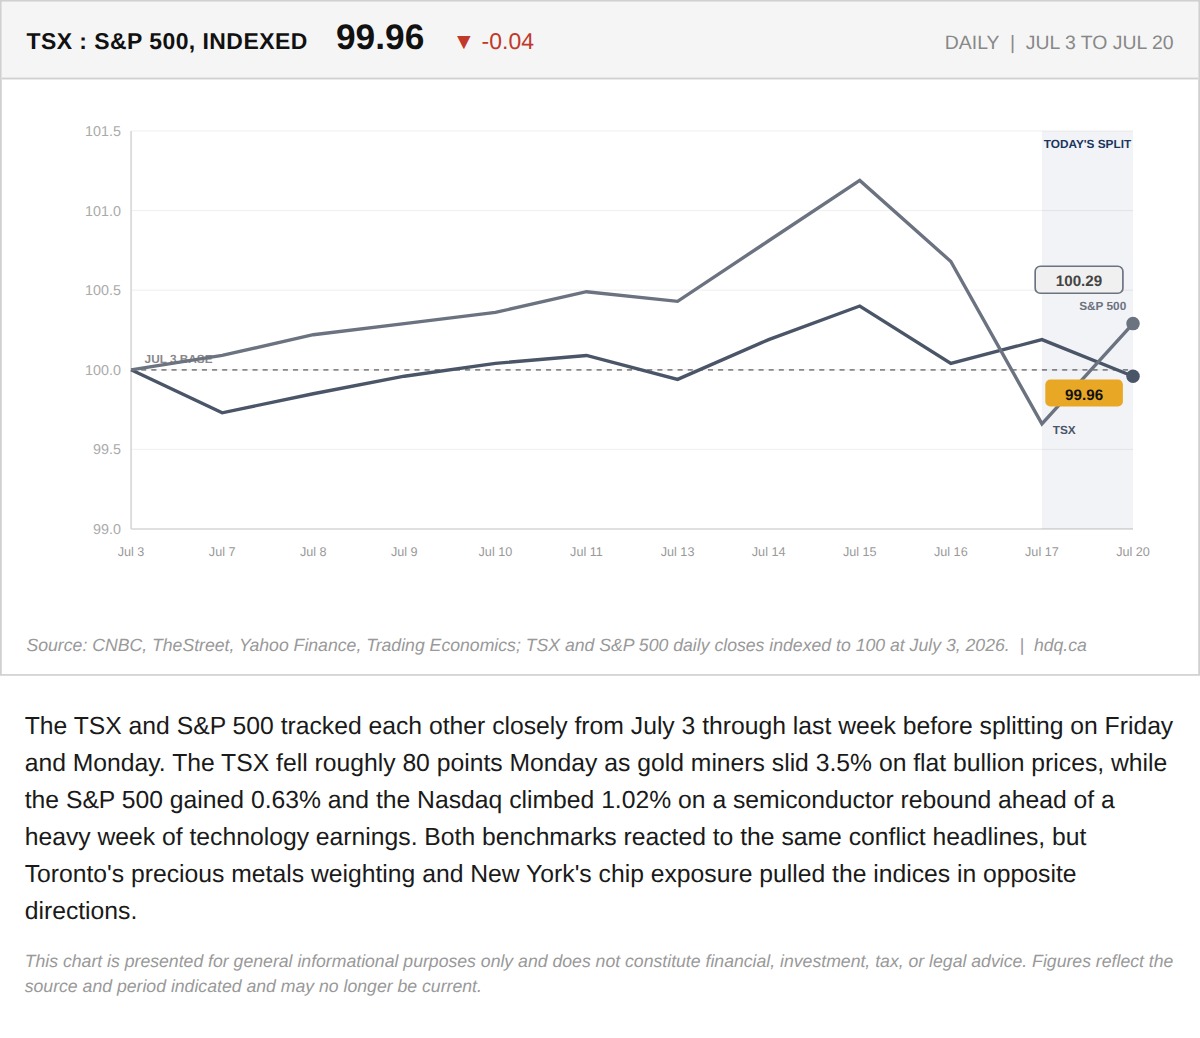
The TSX and S&P 500 tracked each other closely from July 3 through last week before splitting on Friday and Monday.
TSX Falls 80 Points as Gold Miners Slide 3.5%. The S&P 500 Rose 0.6% on the Exact Same Day.
July 20, 2026
View chart & download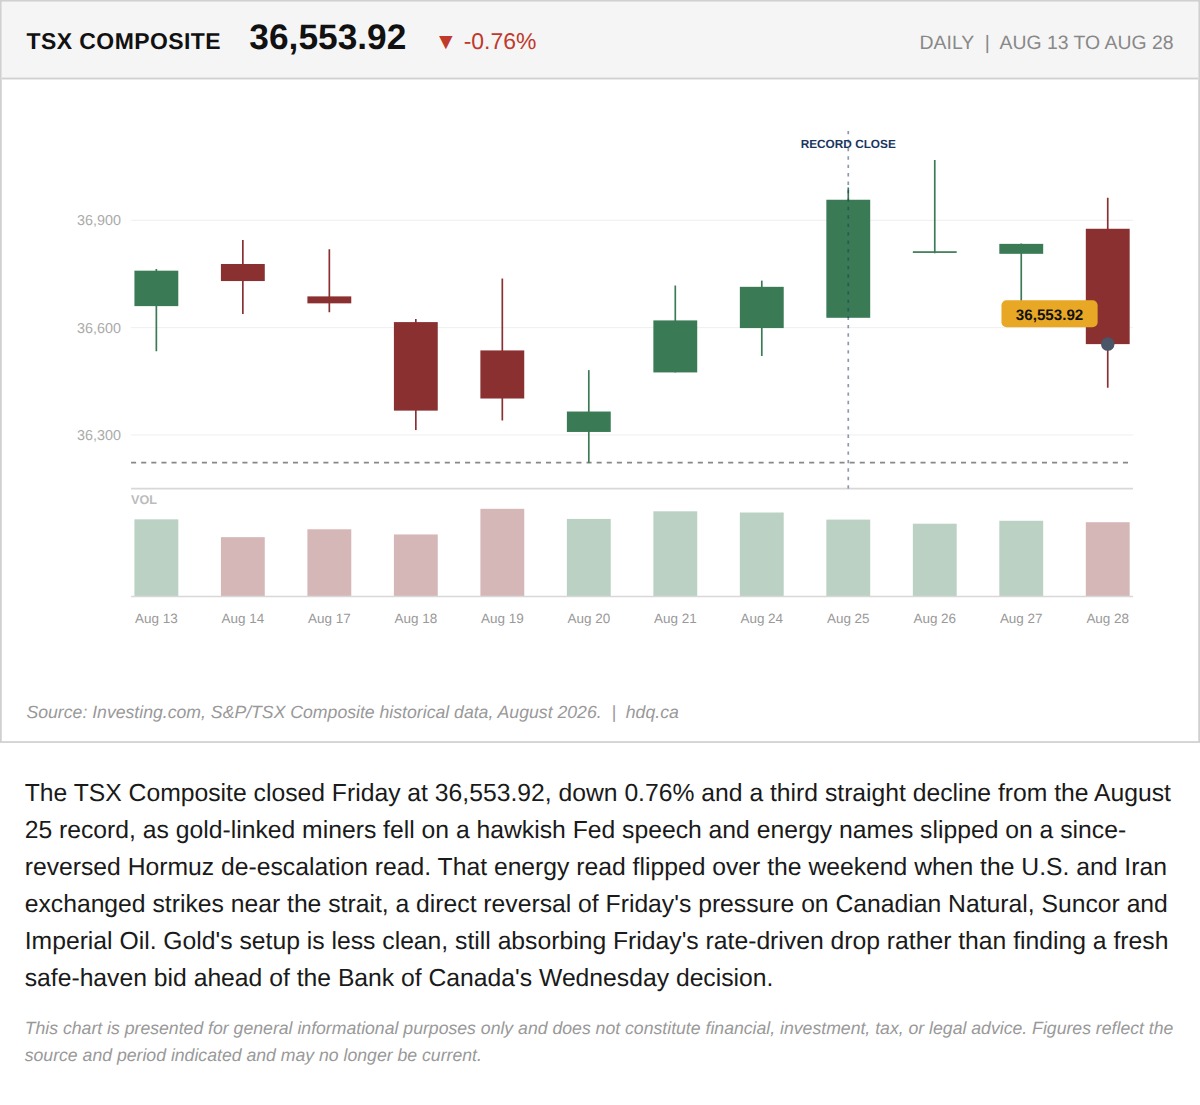
The TSX Composite closed Friday at 36,553.92, down 0.76% and a third straight decline from the August 25 record, as gold-linked miners fell…
The TSX Set a Record Close Six Sessions Ago. It Has Given Back 400 Points Since
August 31, 2026
View chart & download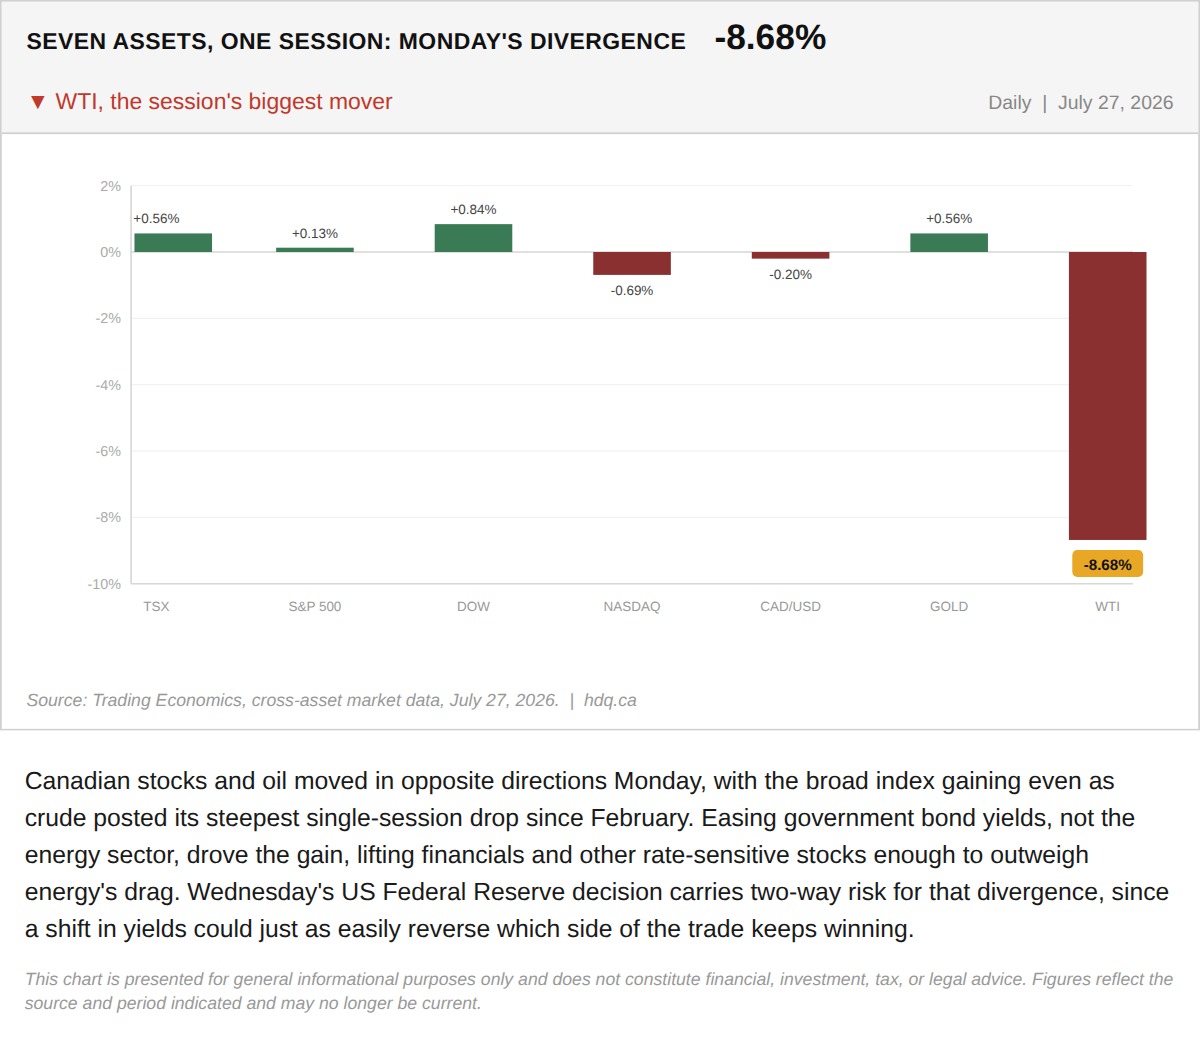
Canadian stocks and oil moved in opposite directions Monday, with the broad index gaining even as crude posted its steepest single-session drop since February.
The TSX Gained 0.56% Monday While Oil Fell 8.7%. That Divergence Is the Trade.
July 28, 2026
View chart & download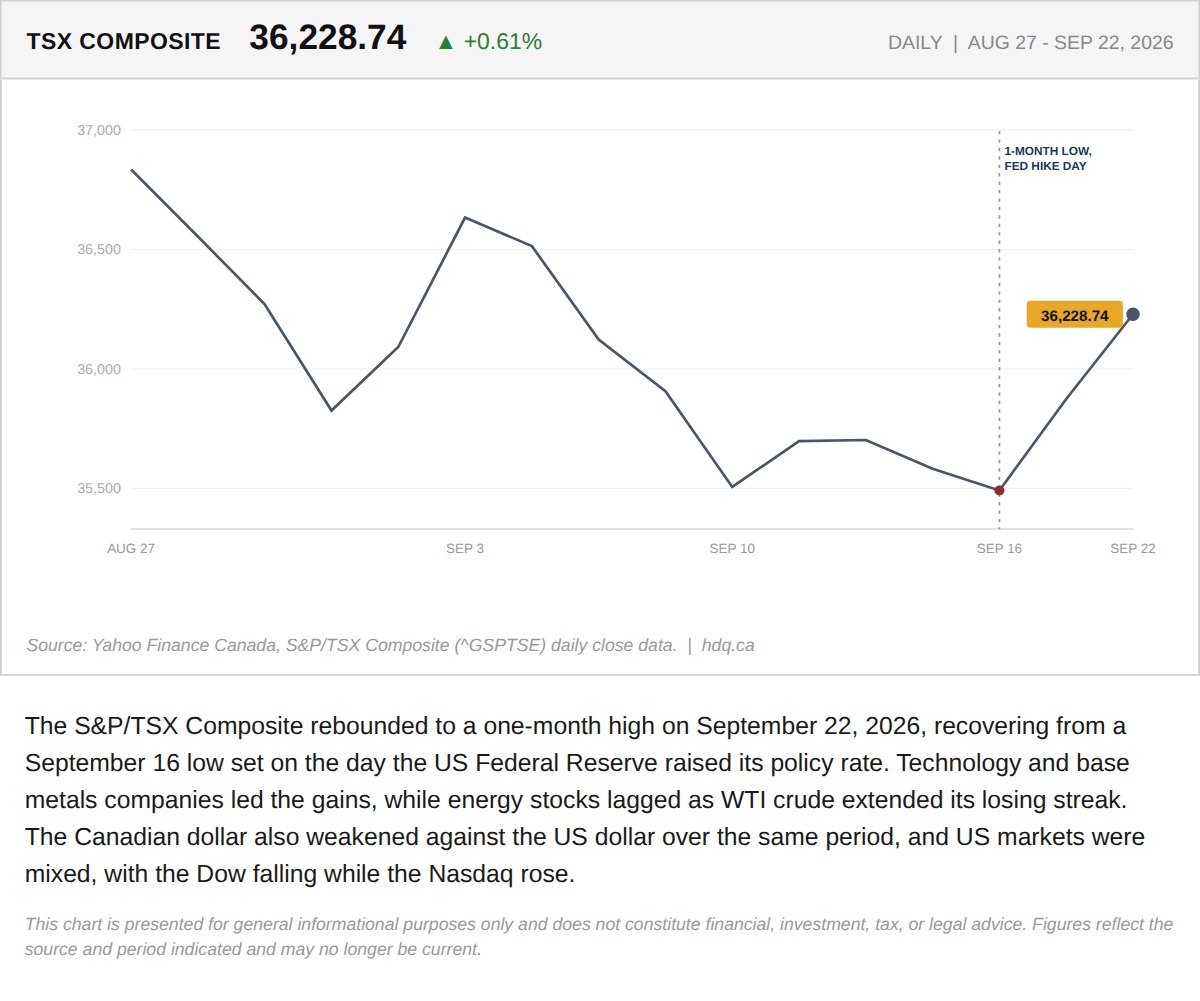
The S&P/TSX Composite rebounded to a one-month high on September 22, 2026, recovering from a September 16 low set on the day the US Federal Reserve raised its policy rate.
The TSX Hit a One-Month High on Tech and Base Metals While Energy Keeps Falling
September 23, 2026
View chart & download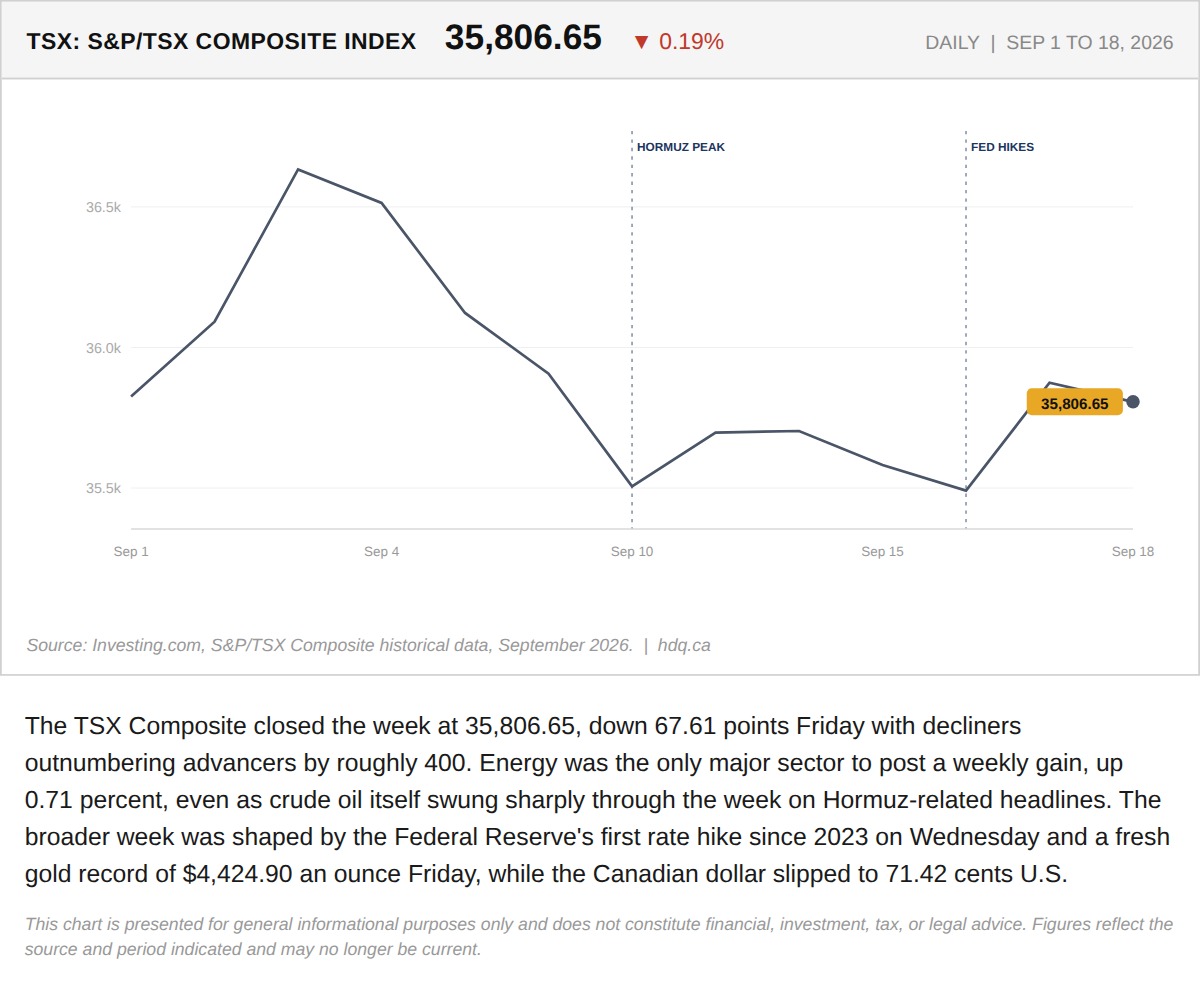
The TSX Composite closed the week at 35,806.65, down 67.61 points Friday with decliners outnumbering advancers by roughly 400.
The TSX Closed a Volatile Week at 35,806.65. Energy Was the Only Sector That Actually Held.
September 21, 2026
View chart & download