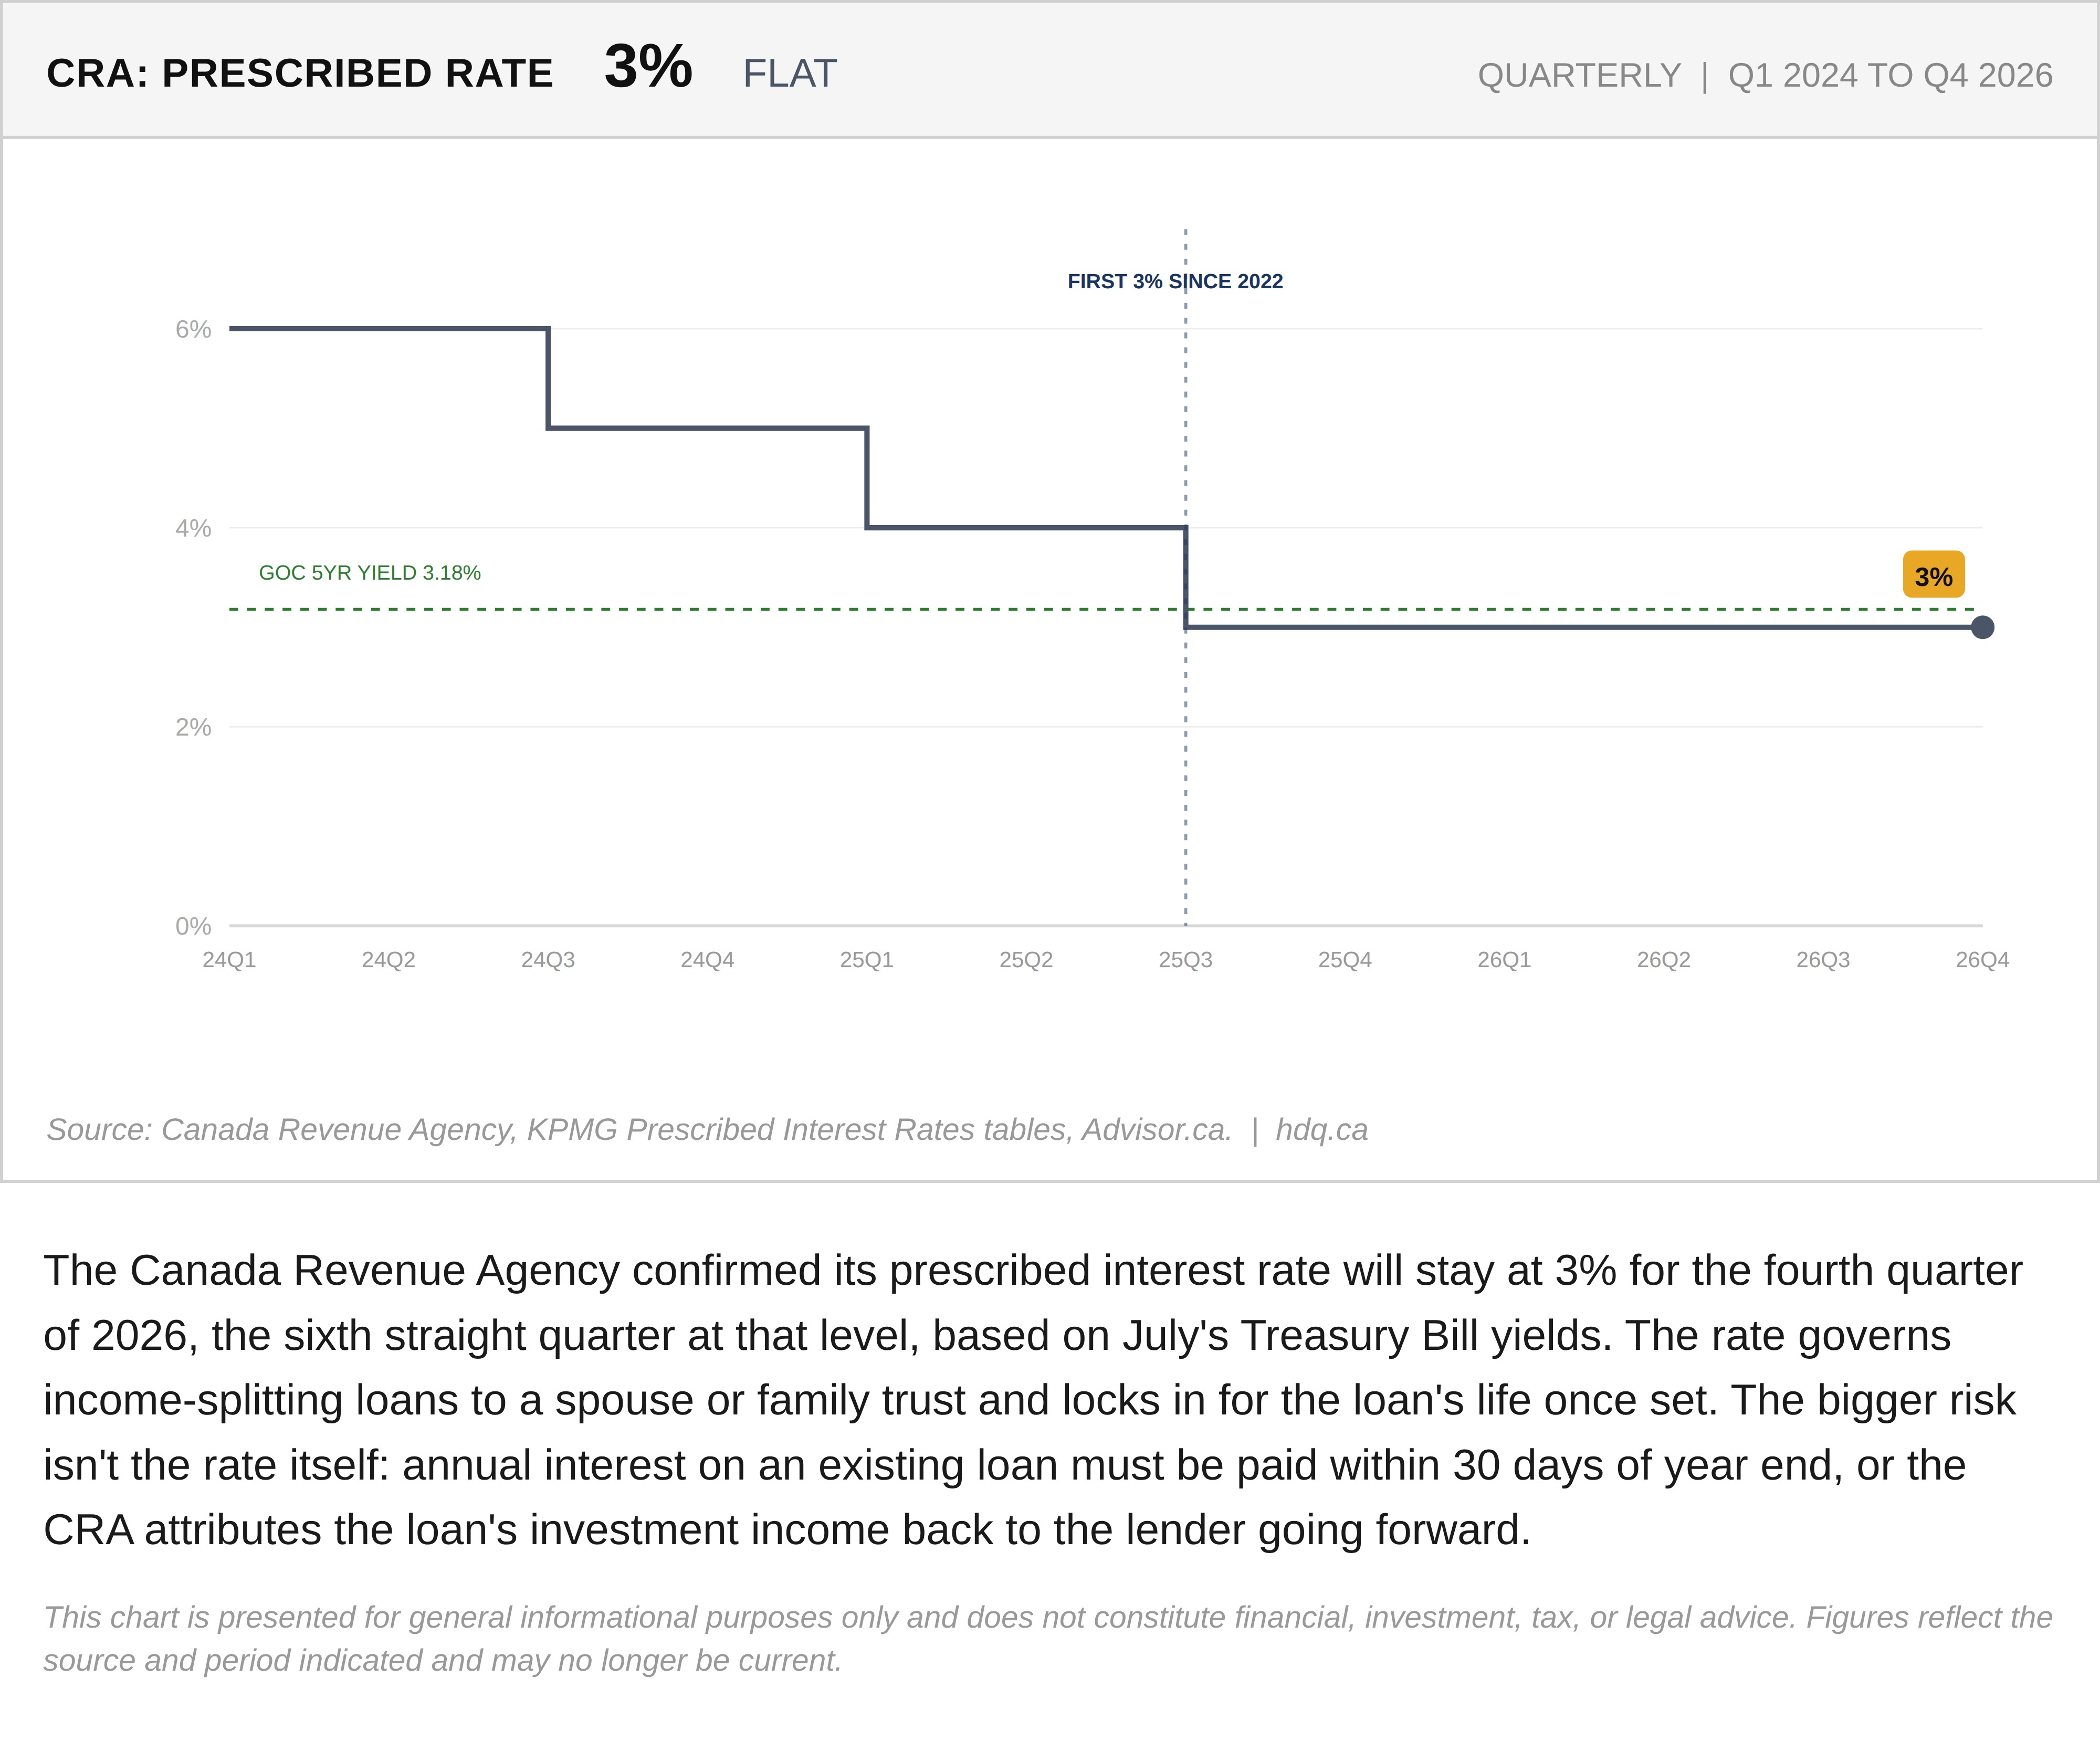
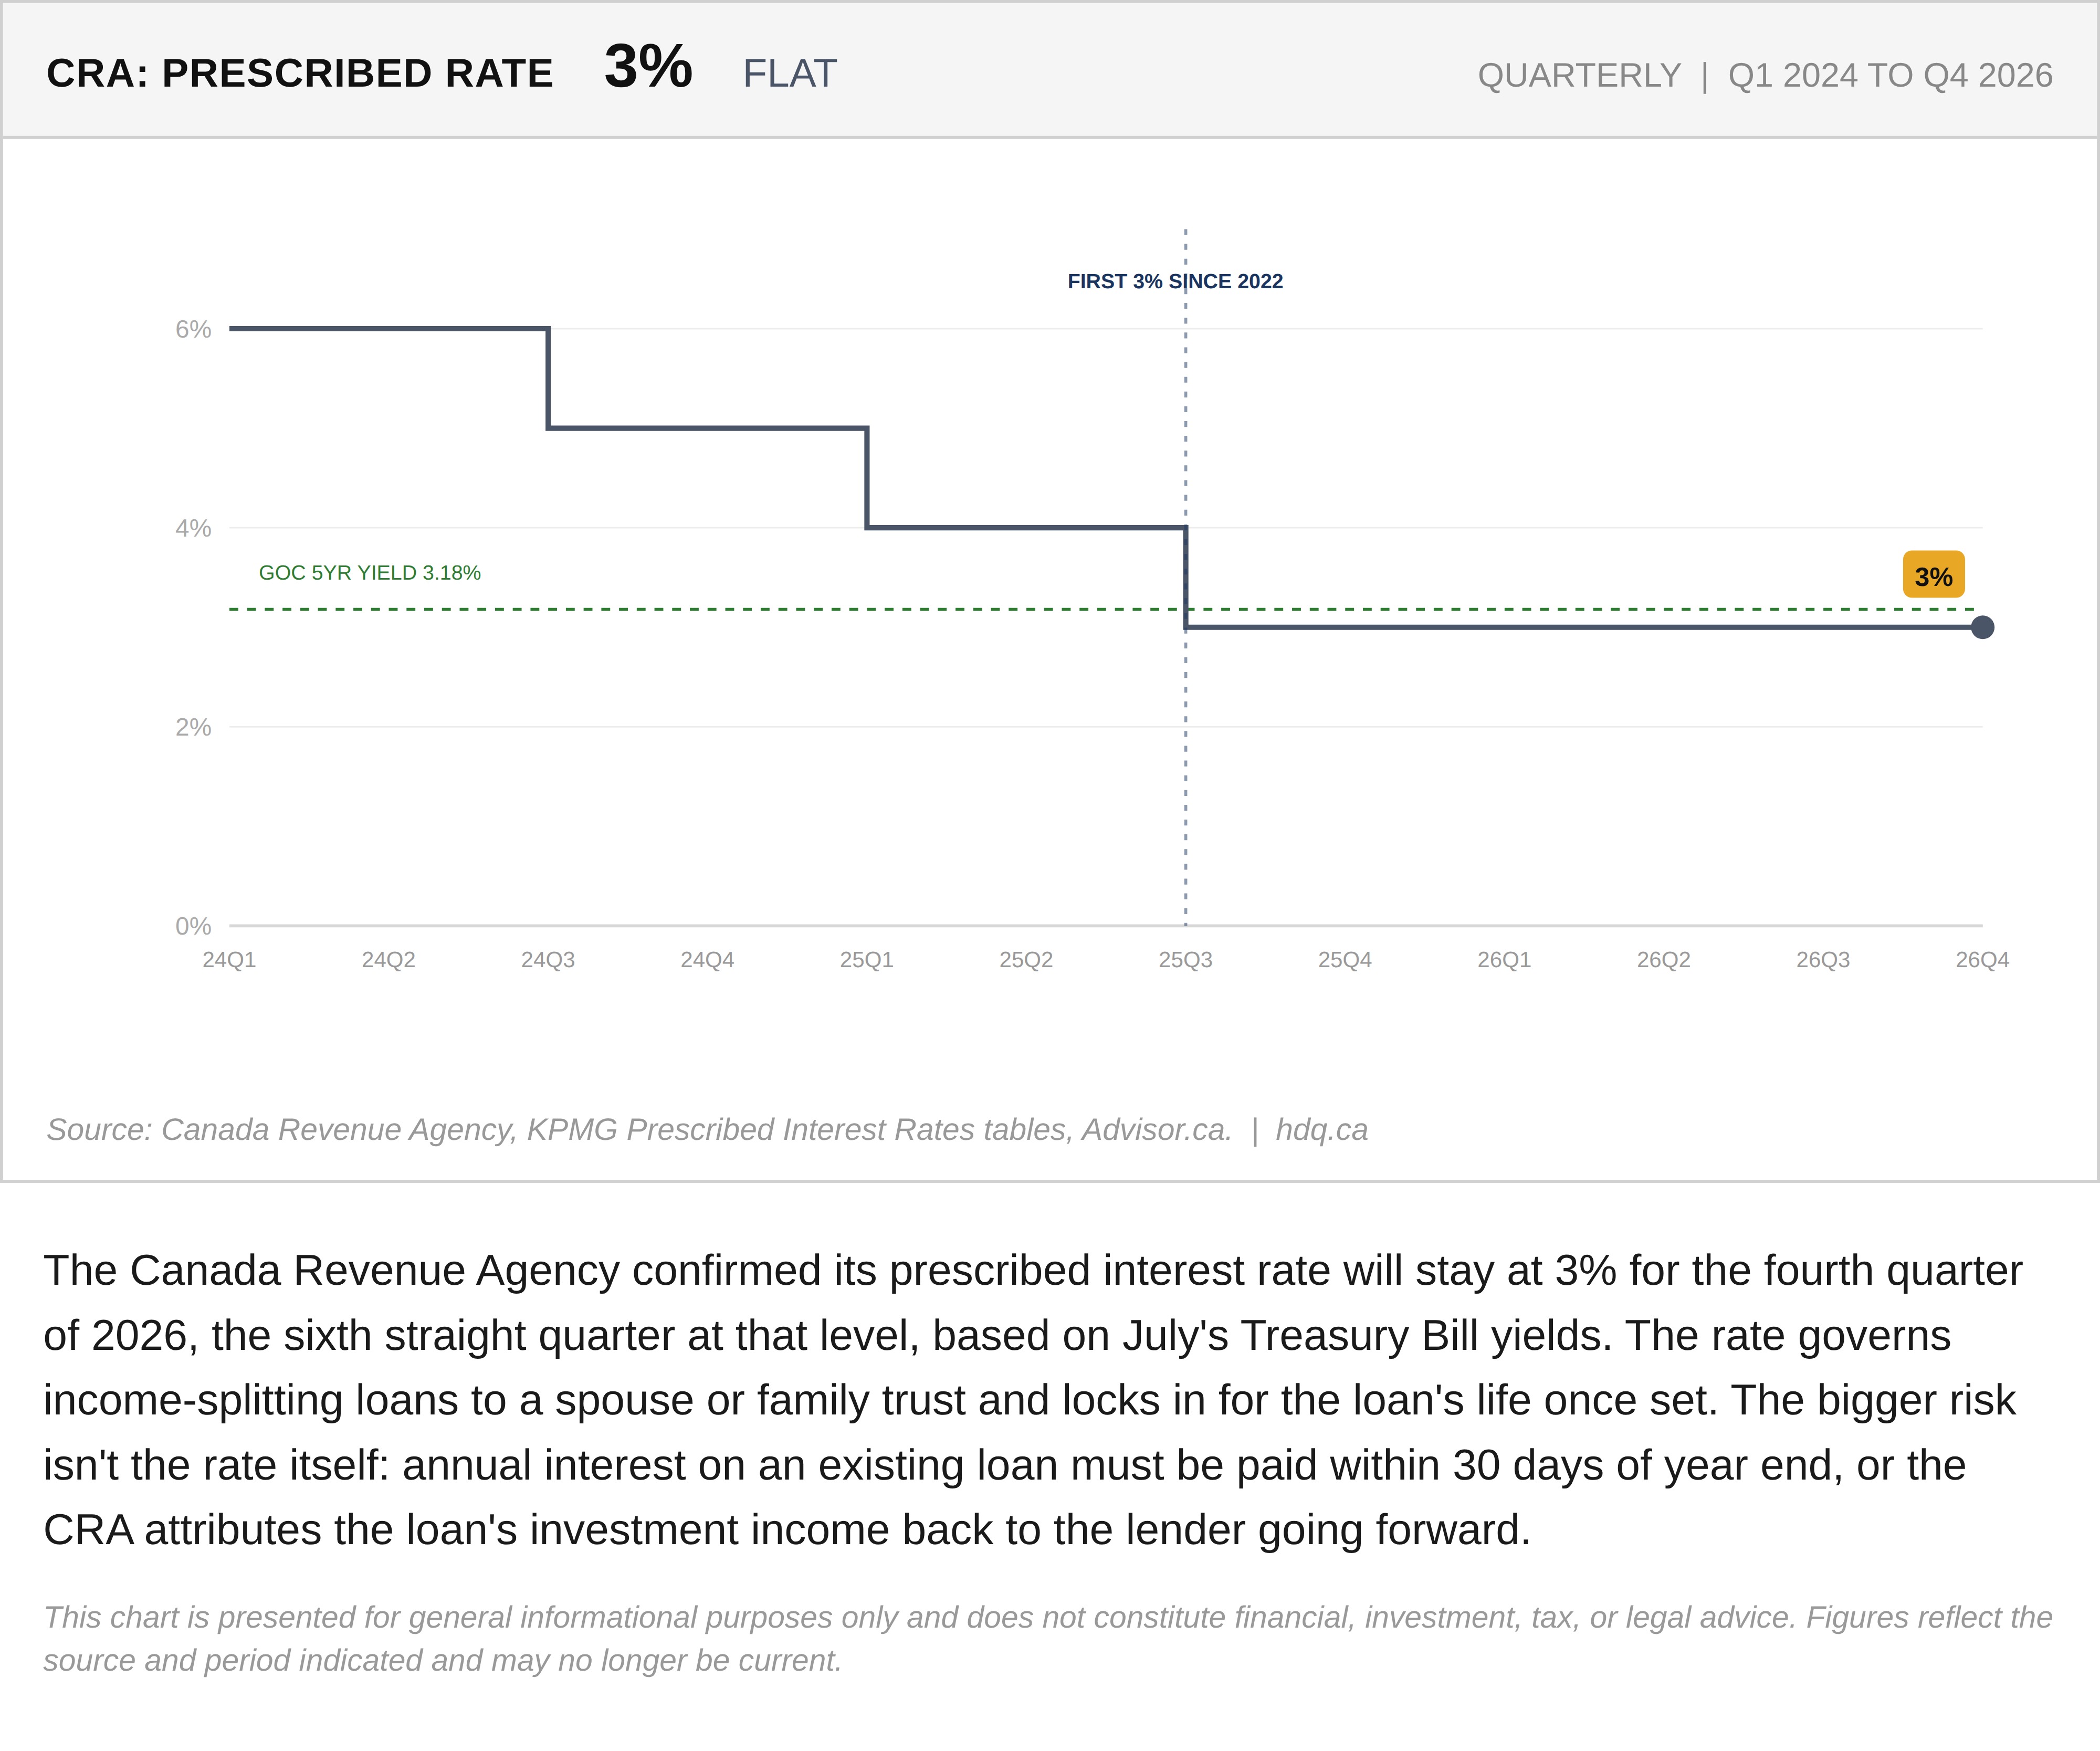
The Canada Revenue Agency confirmed its prescribed interest rate will stay at 3% for the fourth quarter of 2026, the sixth straight quarter at that level, based on July's Treasury Bill yields. The rate governs income-splitting loans to a spouse or family trust and locks in for the loan's life once set. The bigger risk isn't the rate itself: annual interest on an existing loan must be paid within 30 days of year end, or the CRA attributes the loan's investment income back to the lender going forward.
This chart is presented for general informational purposes only and does not constitute financial, investment, tax, or legal advice. Figures reflect the source and period indicated and may no longer be current.
Related charts
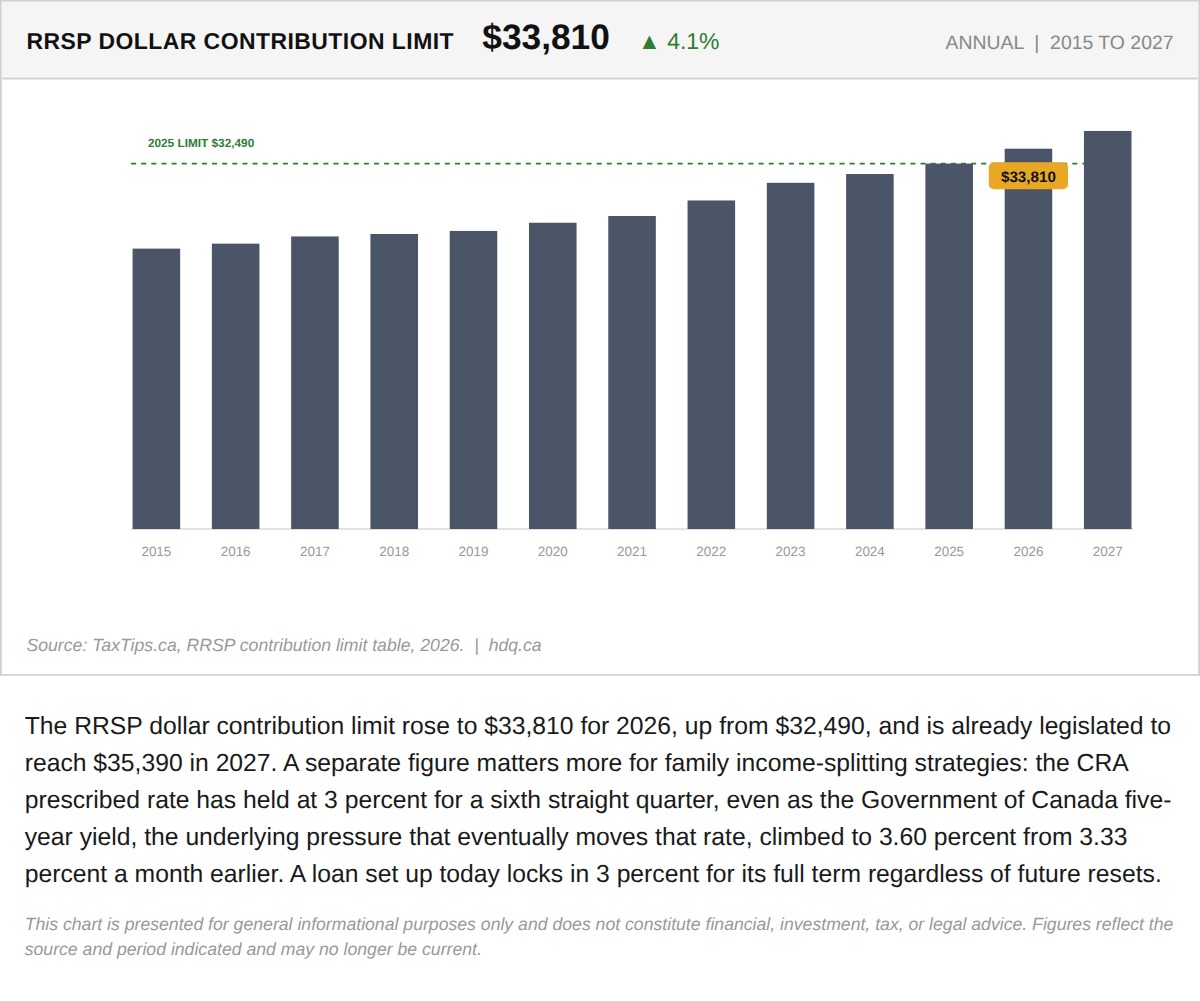
The RRSP dollar contribution limit rose to $33,810 for 2026, up from $32,490, and is already legislated to reach $35,390 in 2027.
The Prescribed Rate Has Not Moved in Six Quarters. The Bond Market Suggests That Is About to Change
September 21, 2026
View chart & download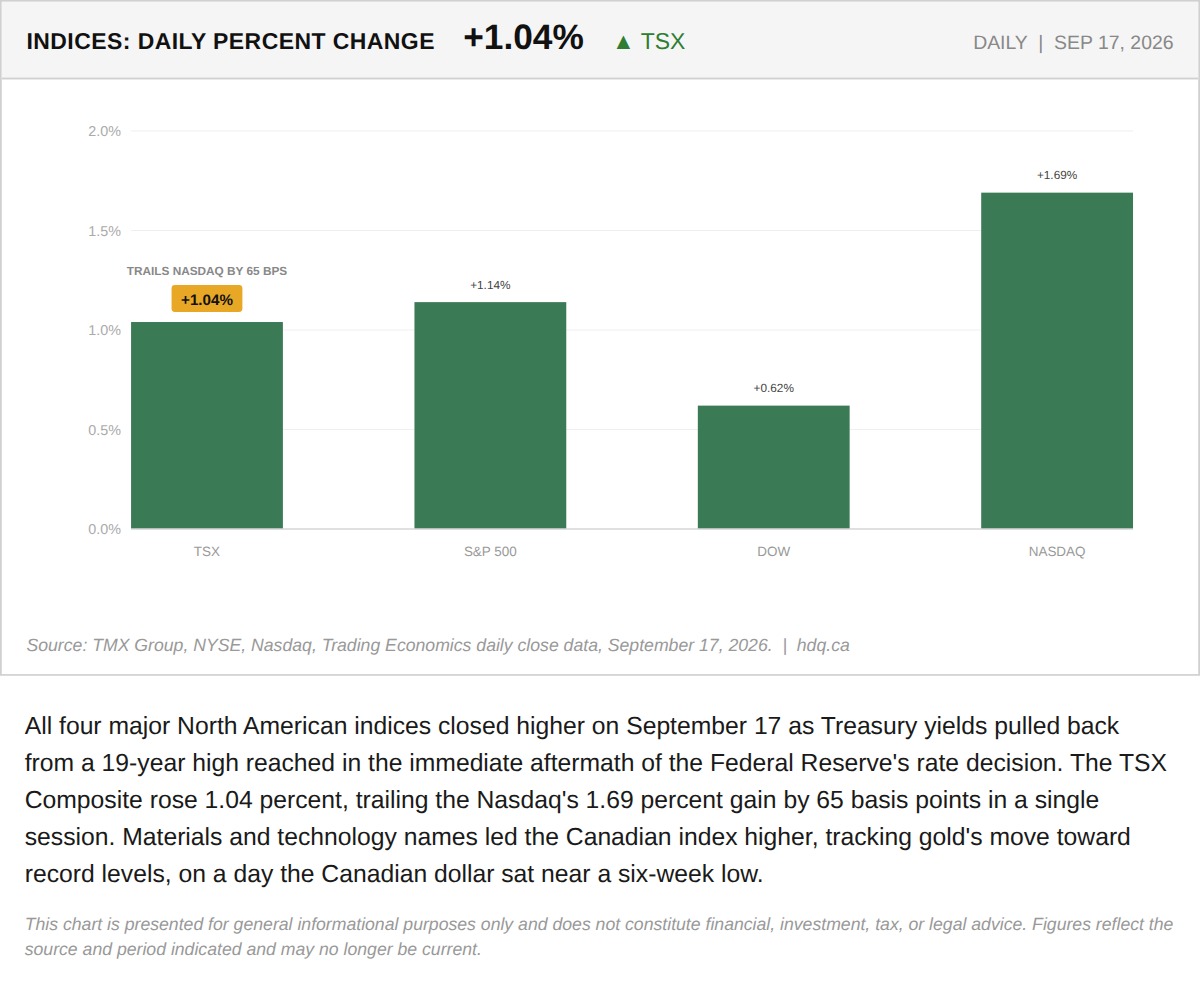
All four major North American indices closed higher on September 17 as Treasury yields pulled back from a 19-year high reached in the…
September 18, 2026
View chart & download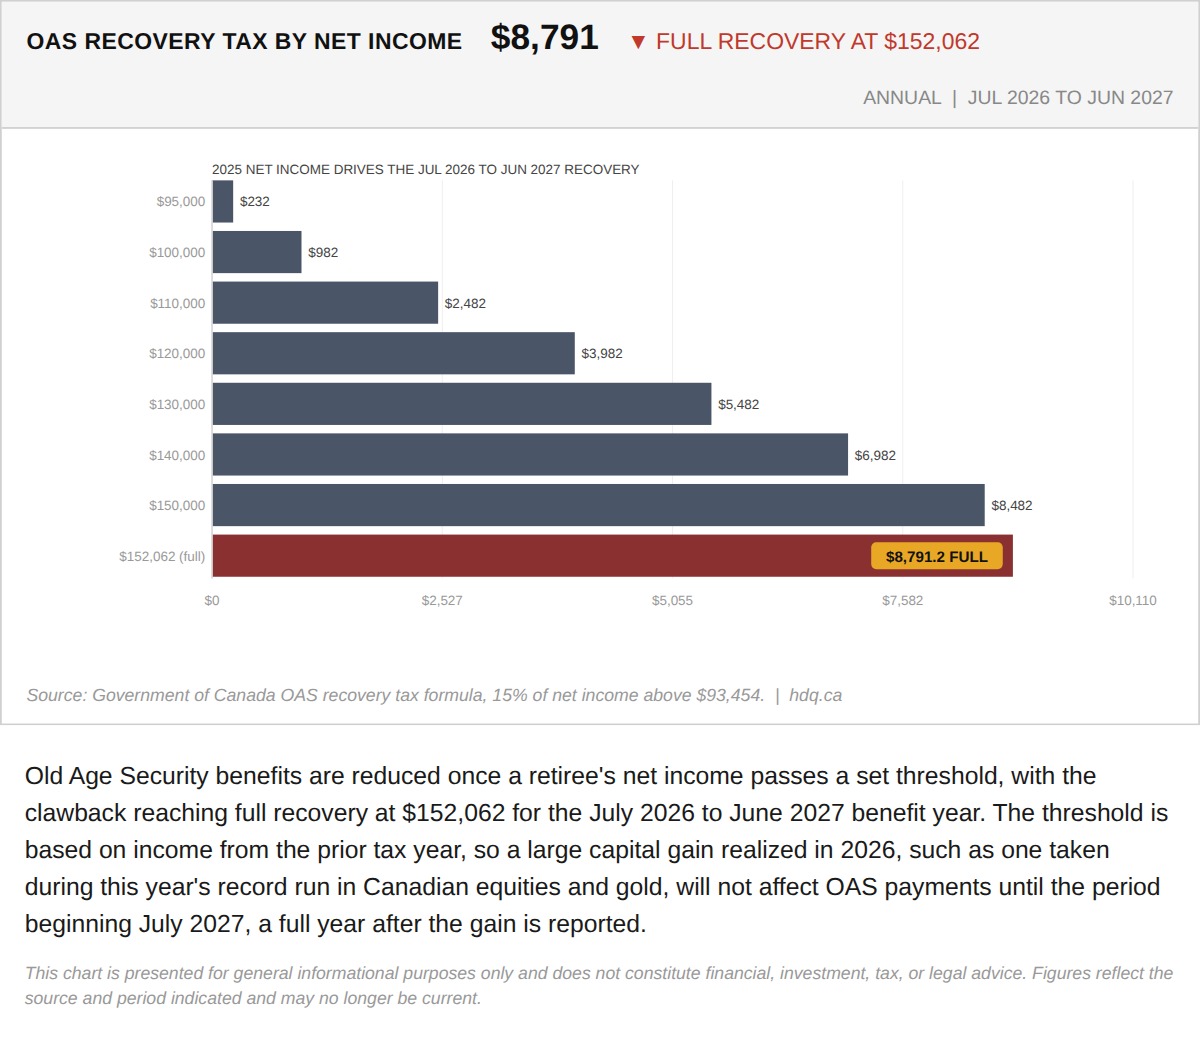
Old Age Security benefits are reduced once a retiree's net income passes a set threshold, with the clawback reaching full recovery at…
This Year's Record Run Makes Selling Tempting. Two Tax Clocks Start the Moment You Do.
August 17, 2026
View chart & download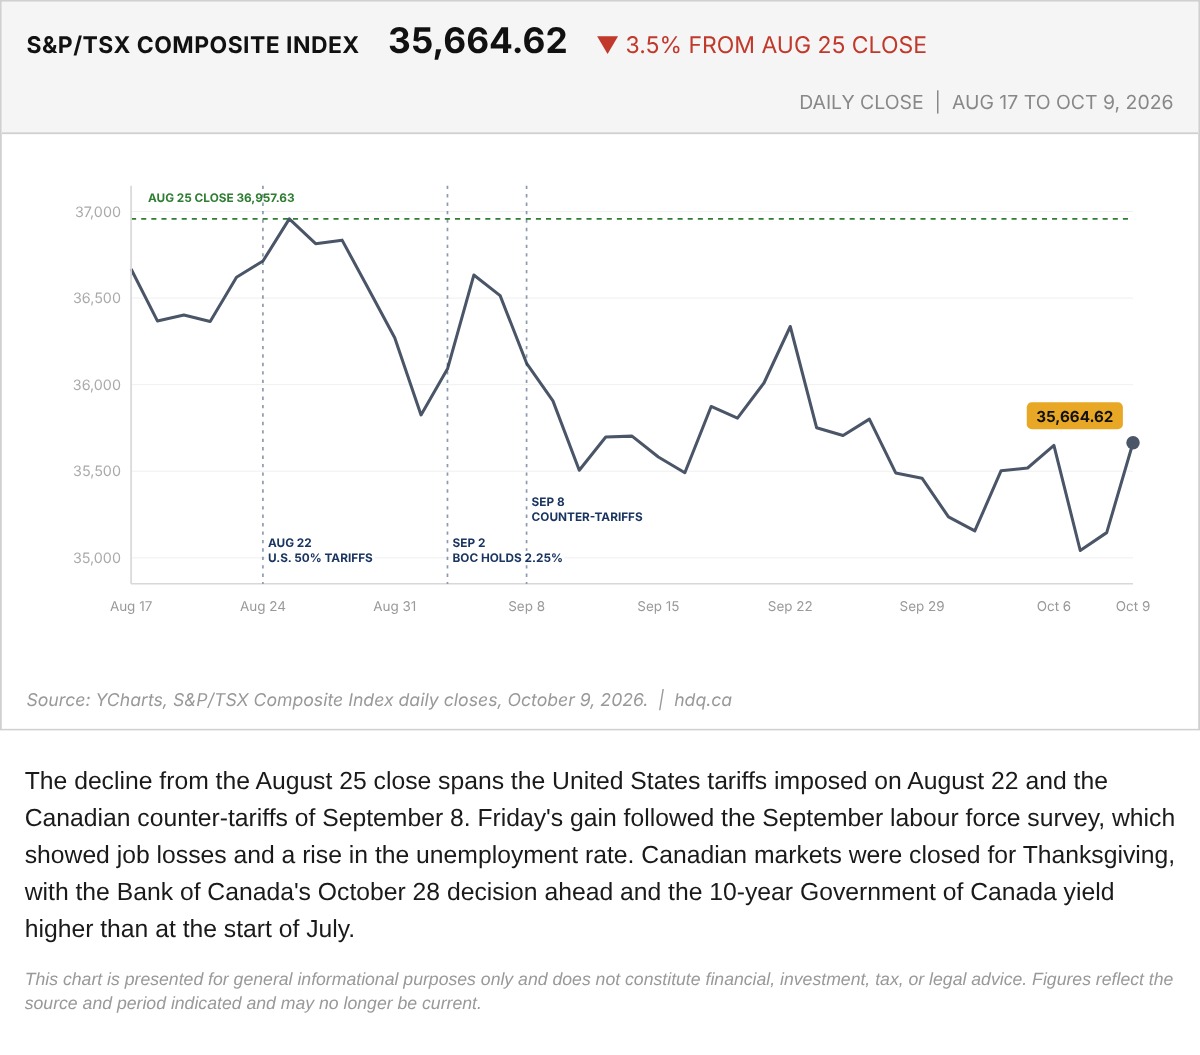
The decline from the August 25 close spans the United States tariffs imposed on August 22 and the Canadian counter-tariffs of September 8.
S&P/TSX Composite From August 17 to October 9, Before Thanksgiving
October 12, 2026
View chart & download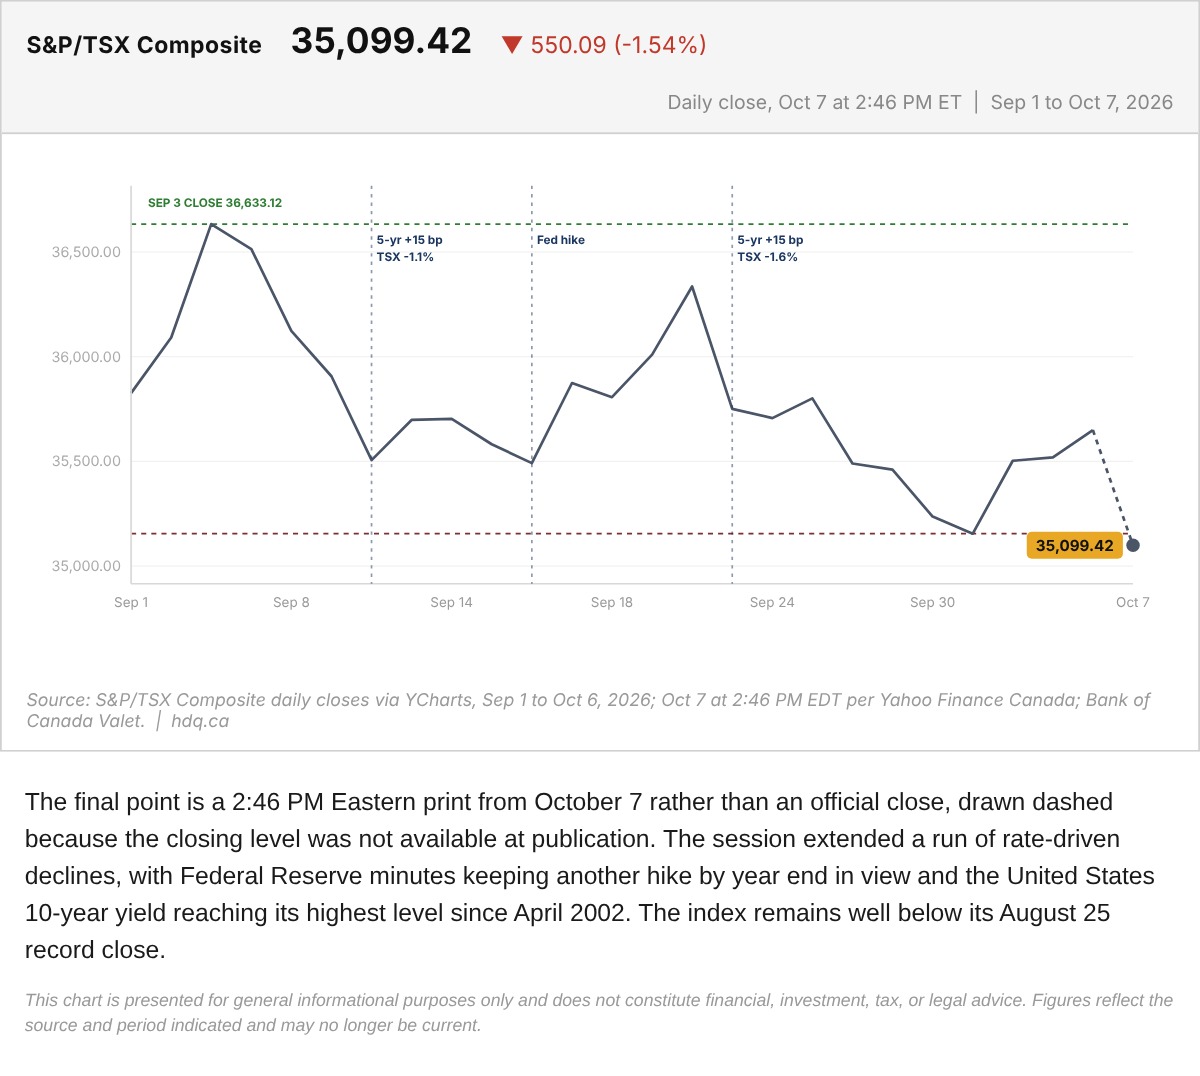
The final point is a 2:46 PM Eastern print from October 7 rather than an official close, drawn dashed because the closing level was not available at publication.
S&P/TSX Composite With the October 7 Midday Print
October 7, 2026
View chart & download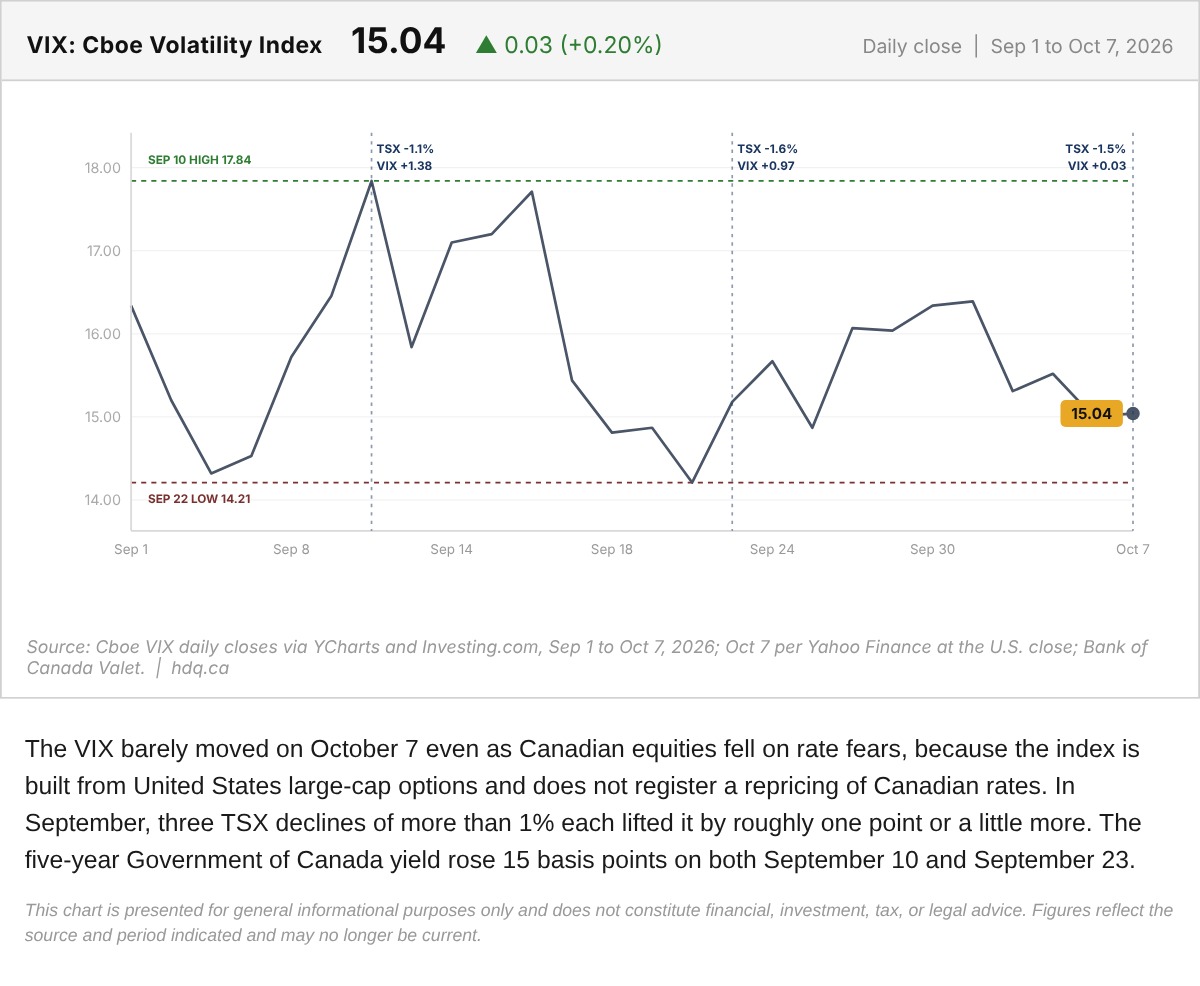
The VIX barely moved on October 7 even as Canadian equities fell on rate fears, because the index is built from United States large-cap…
VIX Daily Close on the Day Rate Fear Hit the TSX
October 7, 2026
View chart & download