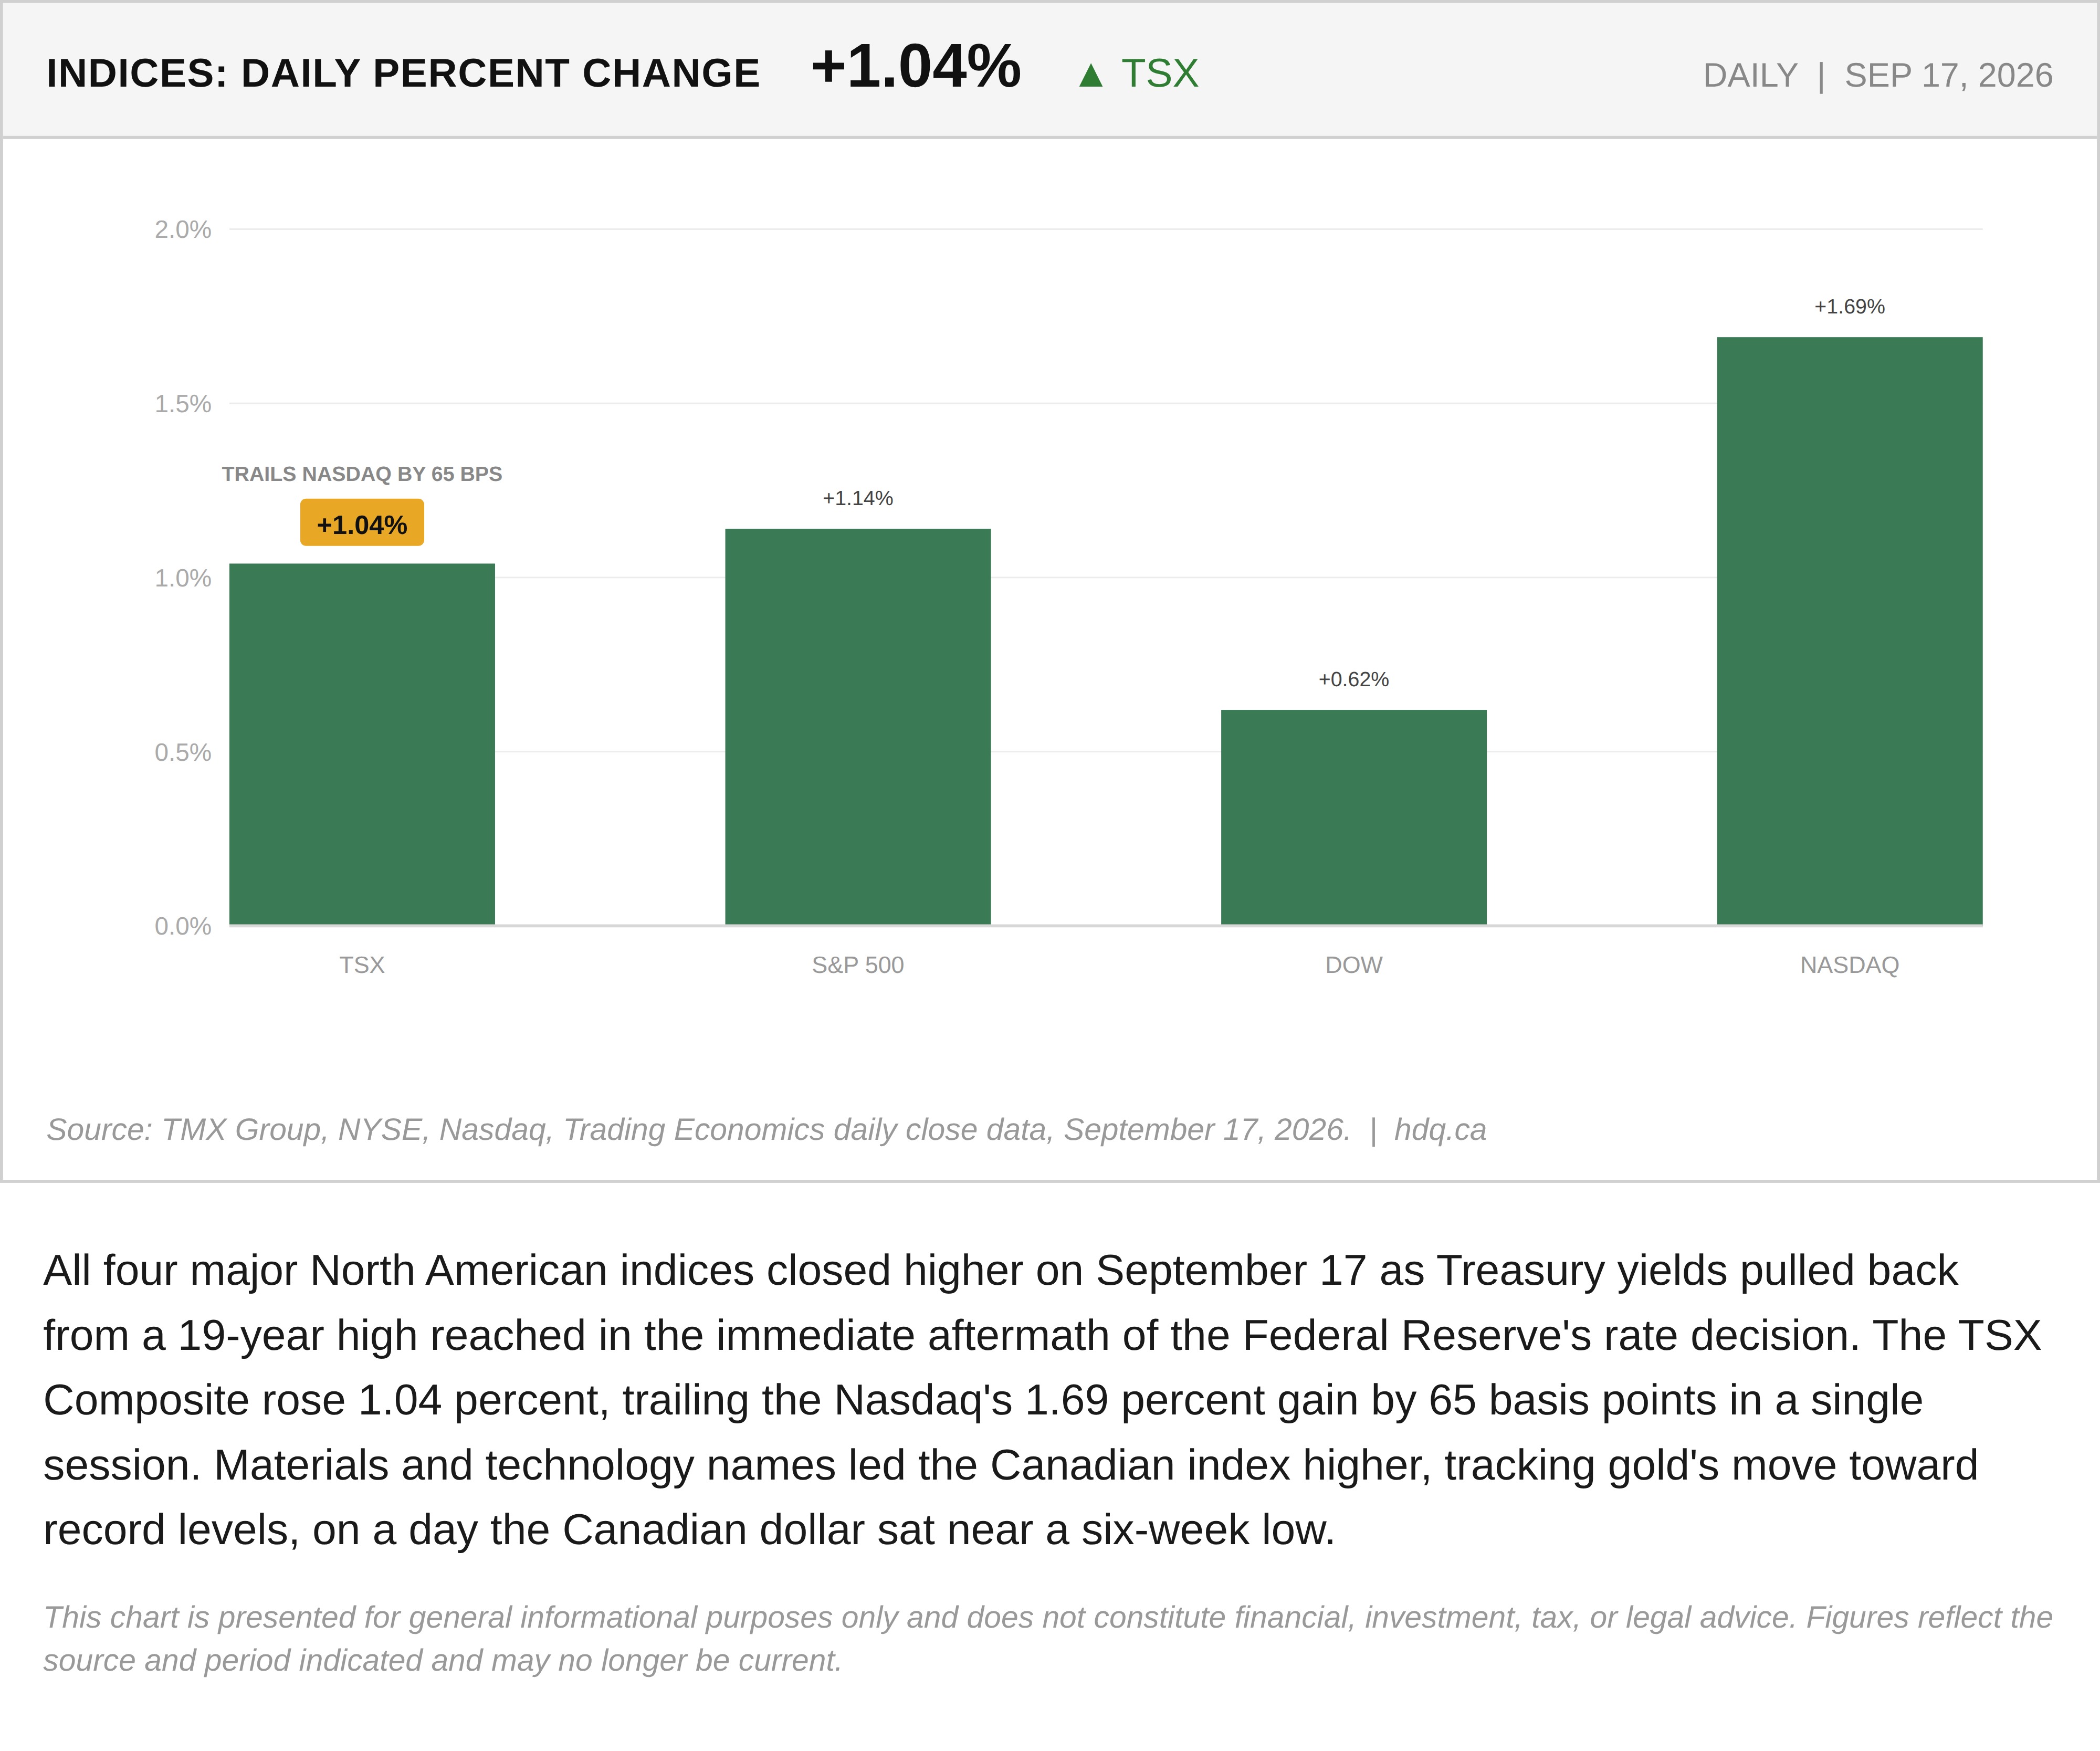
All four major North American indices closed higher on September 17 as Treasury yields pulled back from a 19-year high reached in the immediate aftermath of the Federal Reserve's rate decision. The TSX Composite rose 1.04 percent, trailing the Nasdaq's 1.69 percent gain by 65 basis points in a single session. Materials and technology names led the Canadian index higher, tracking gold's move toward record levels, on a day the Canadian dollar sat near a six-week low.
This chart is presented for general informational purposes only and does not constitute financial, investment, tax, or legal advice. Figures reflect the source and period indicated and may no longer be current.
Related charts
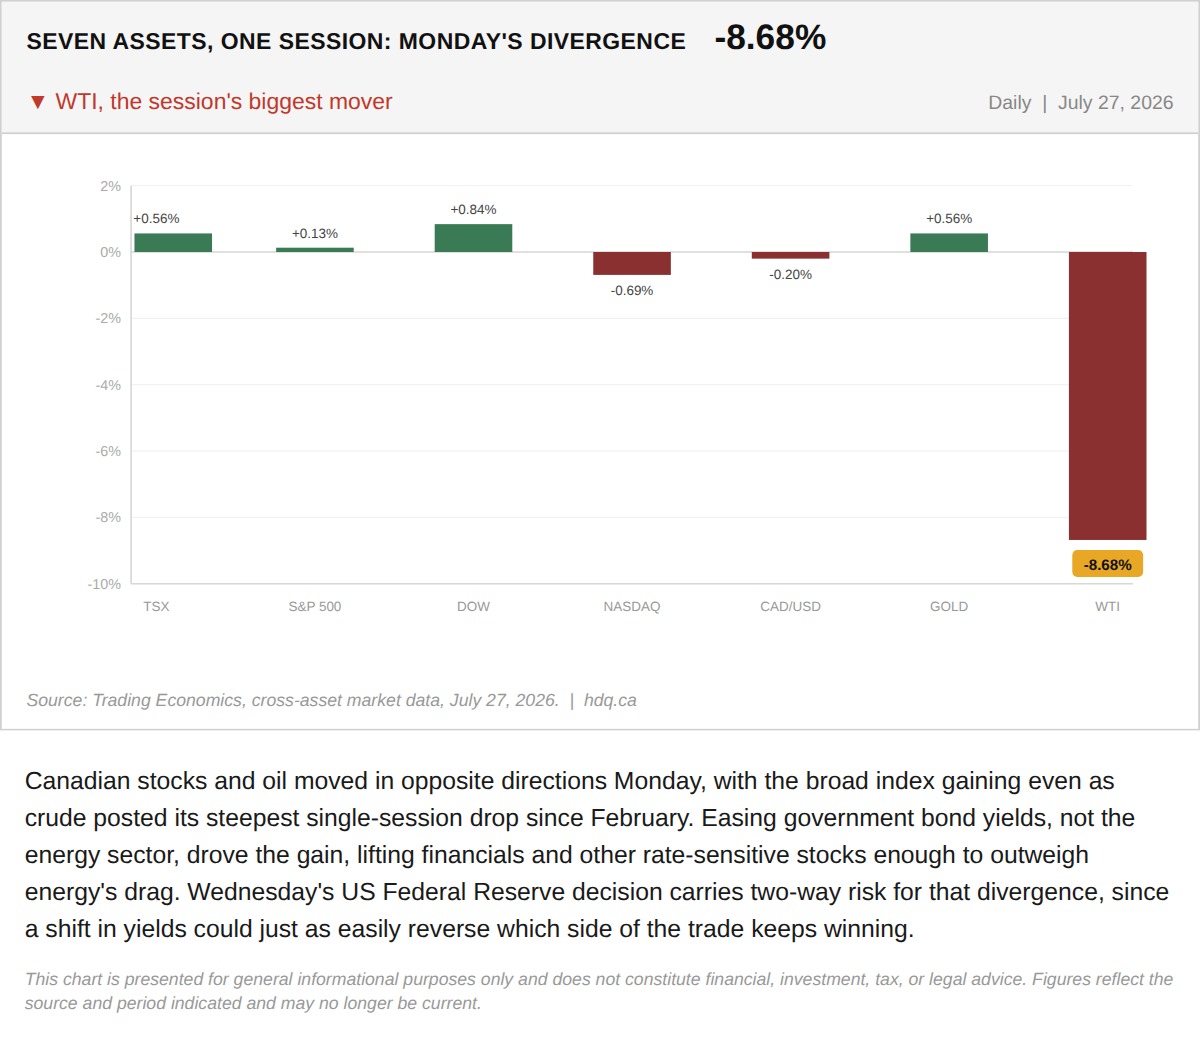
Canadian stocks and oil moved in opposite directions Monday, with the broad index gaining even as crude posted its steepest single-session drop since February.
The TSX Gained 0.56% Monday While Oil Fell 8.7%. That Divergence Is the Trade.
July 28, 2026
View chart & download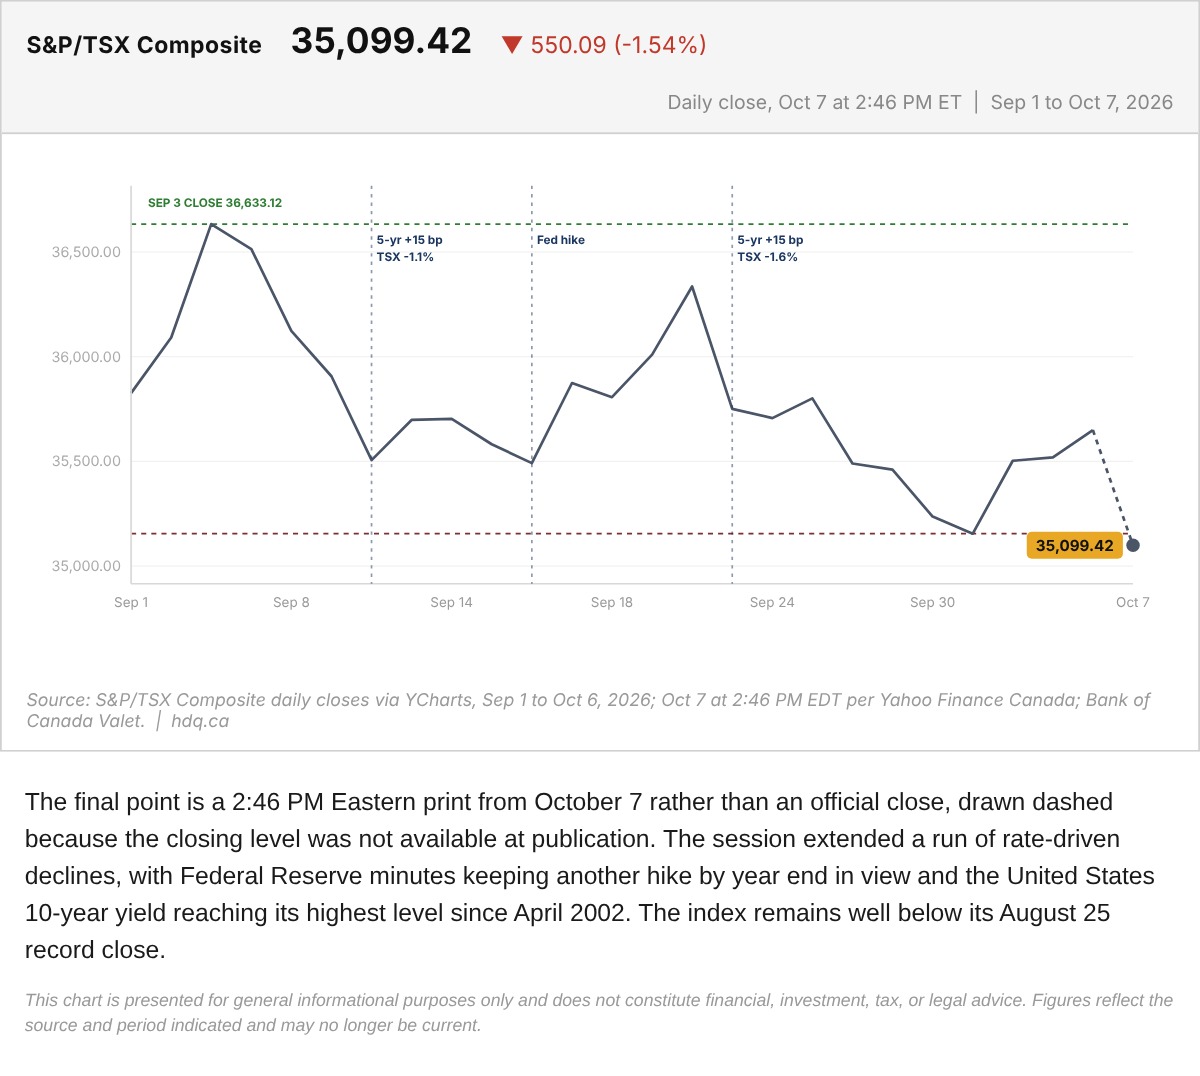
The final point is a 2:46 PM Eastern print from October 7 rather than an official close, drawn dashed because the closing level was not available at publication.
S&P/TSX Composite With the October 7 Midday Print
October 7, 2026
View chart & download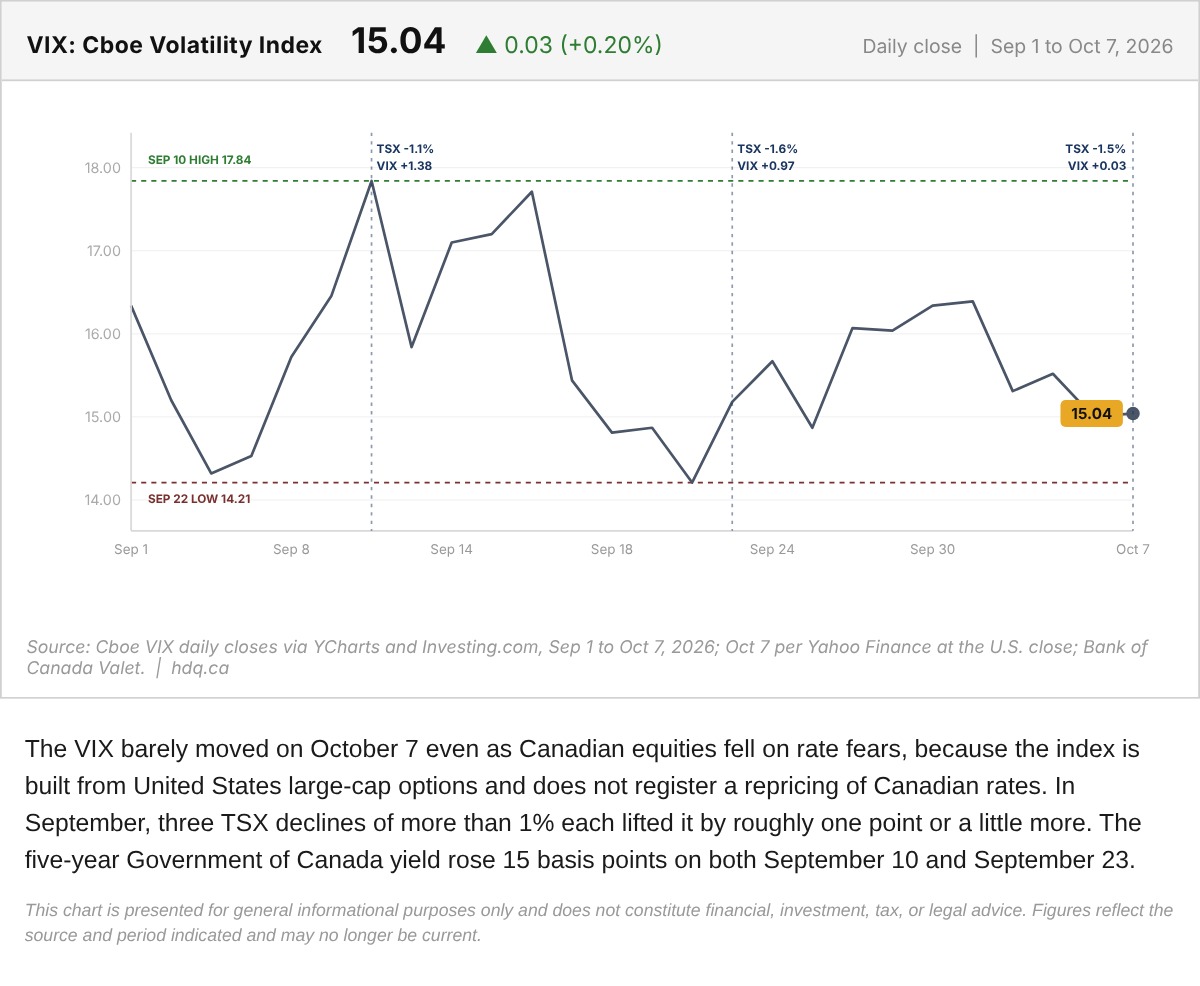
The VIX barely moved on October 7 even as Canadian equities fell on rate fears, because the index is built from United States large-cap…
VIX Daily Close on the Day Rate Fear Hit the TSX
October 7, 2026
View chart & download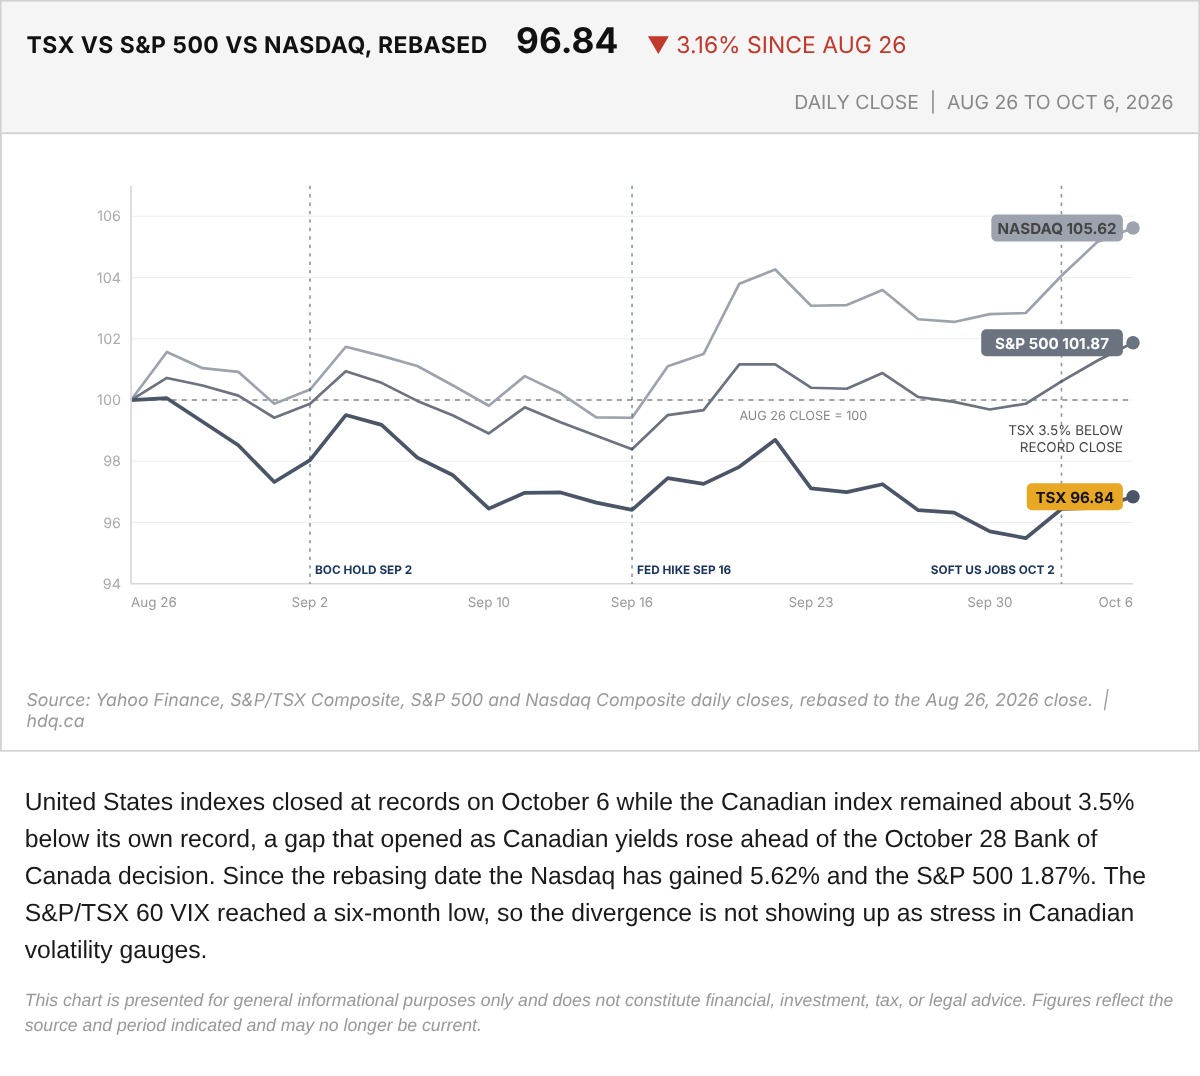
United States indexes closed at records on October 6 while the Canadian index remained about 3.5% below its own record, a gap that opened…
TSX, S&P 500 and Nasdaq Rebased to the August 26 Close
October 7, 2026
View chart & download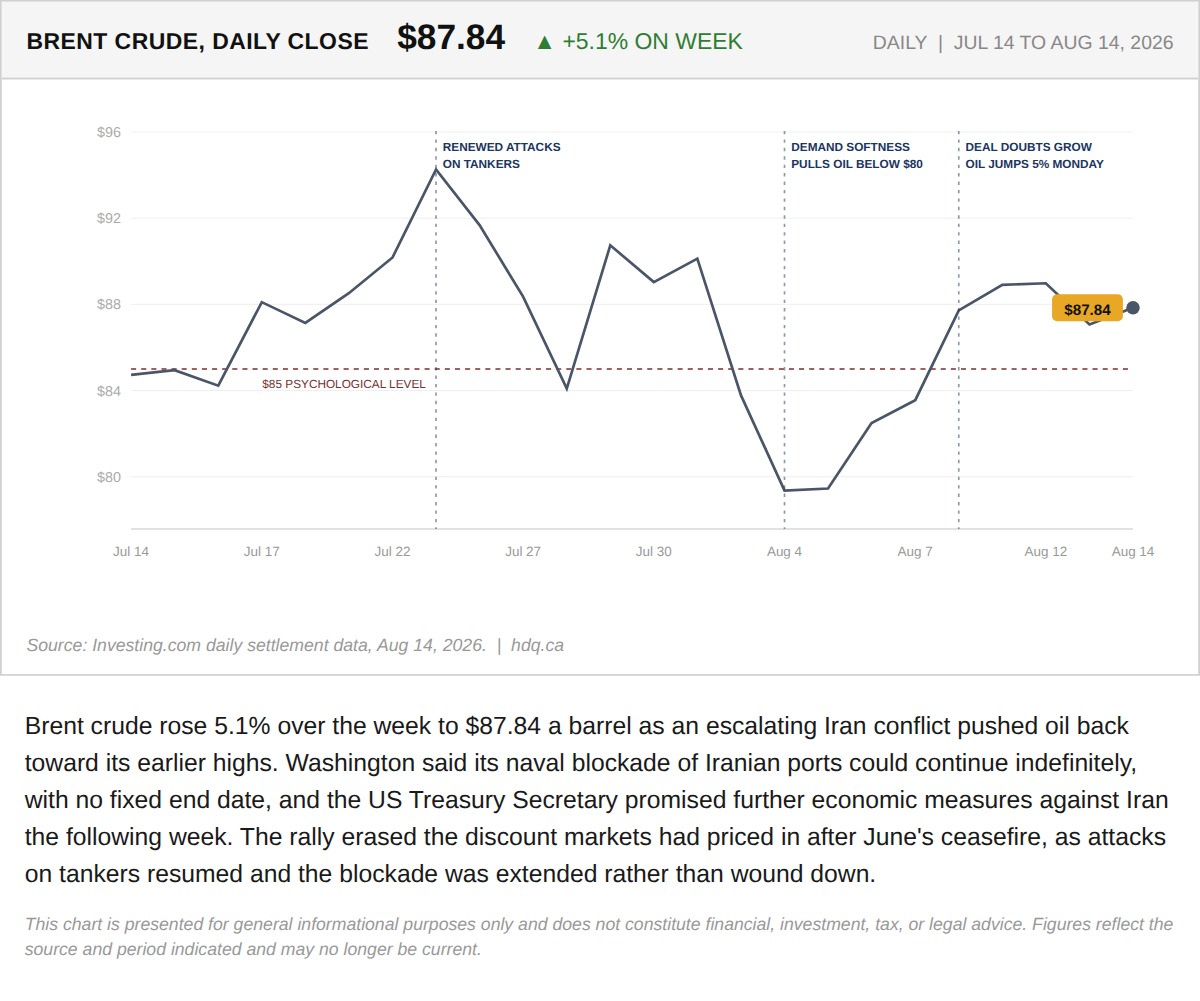
Brent crude rose 5.1% over the week to $87.84 a barrel as an escalating Iran conflict pushed oil back toward its earlier highs.
The TSX and Gold Both Set Records This Week. That Should Not Happen Together.
August 15, 2026
View chart & download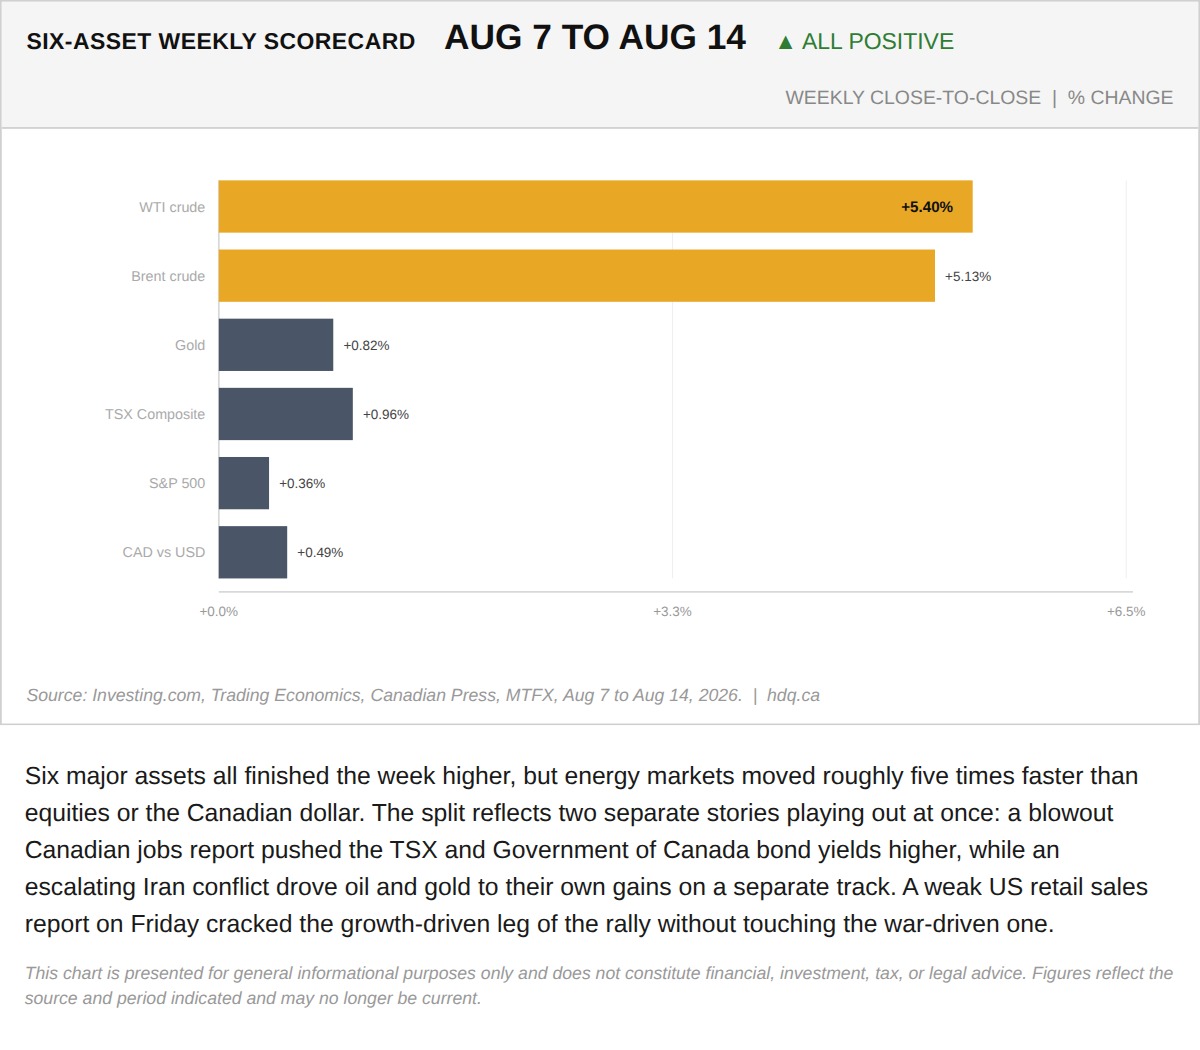
Six major assets all finished the week higher, but energy markets moved roughly five times faster than equities or the Canadian dollar.
The TSX and Gold Both Set Records This Week. That Should Not Happen Together.
August 15, 2026
View chart & download