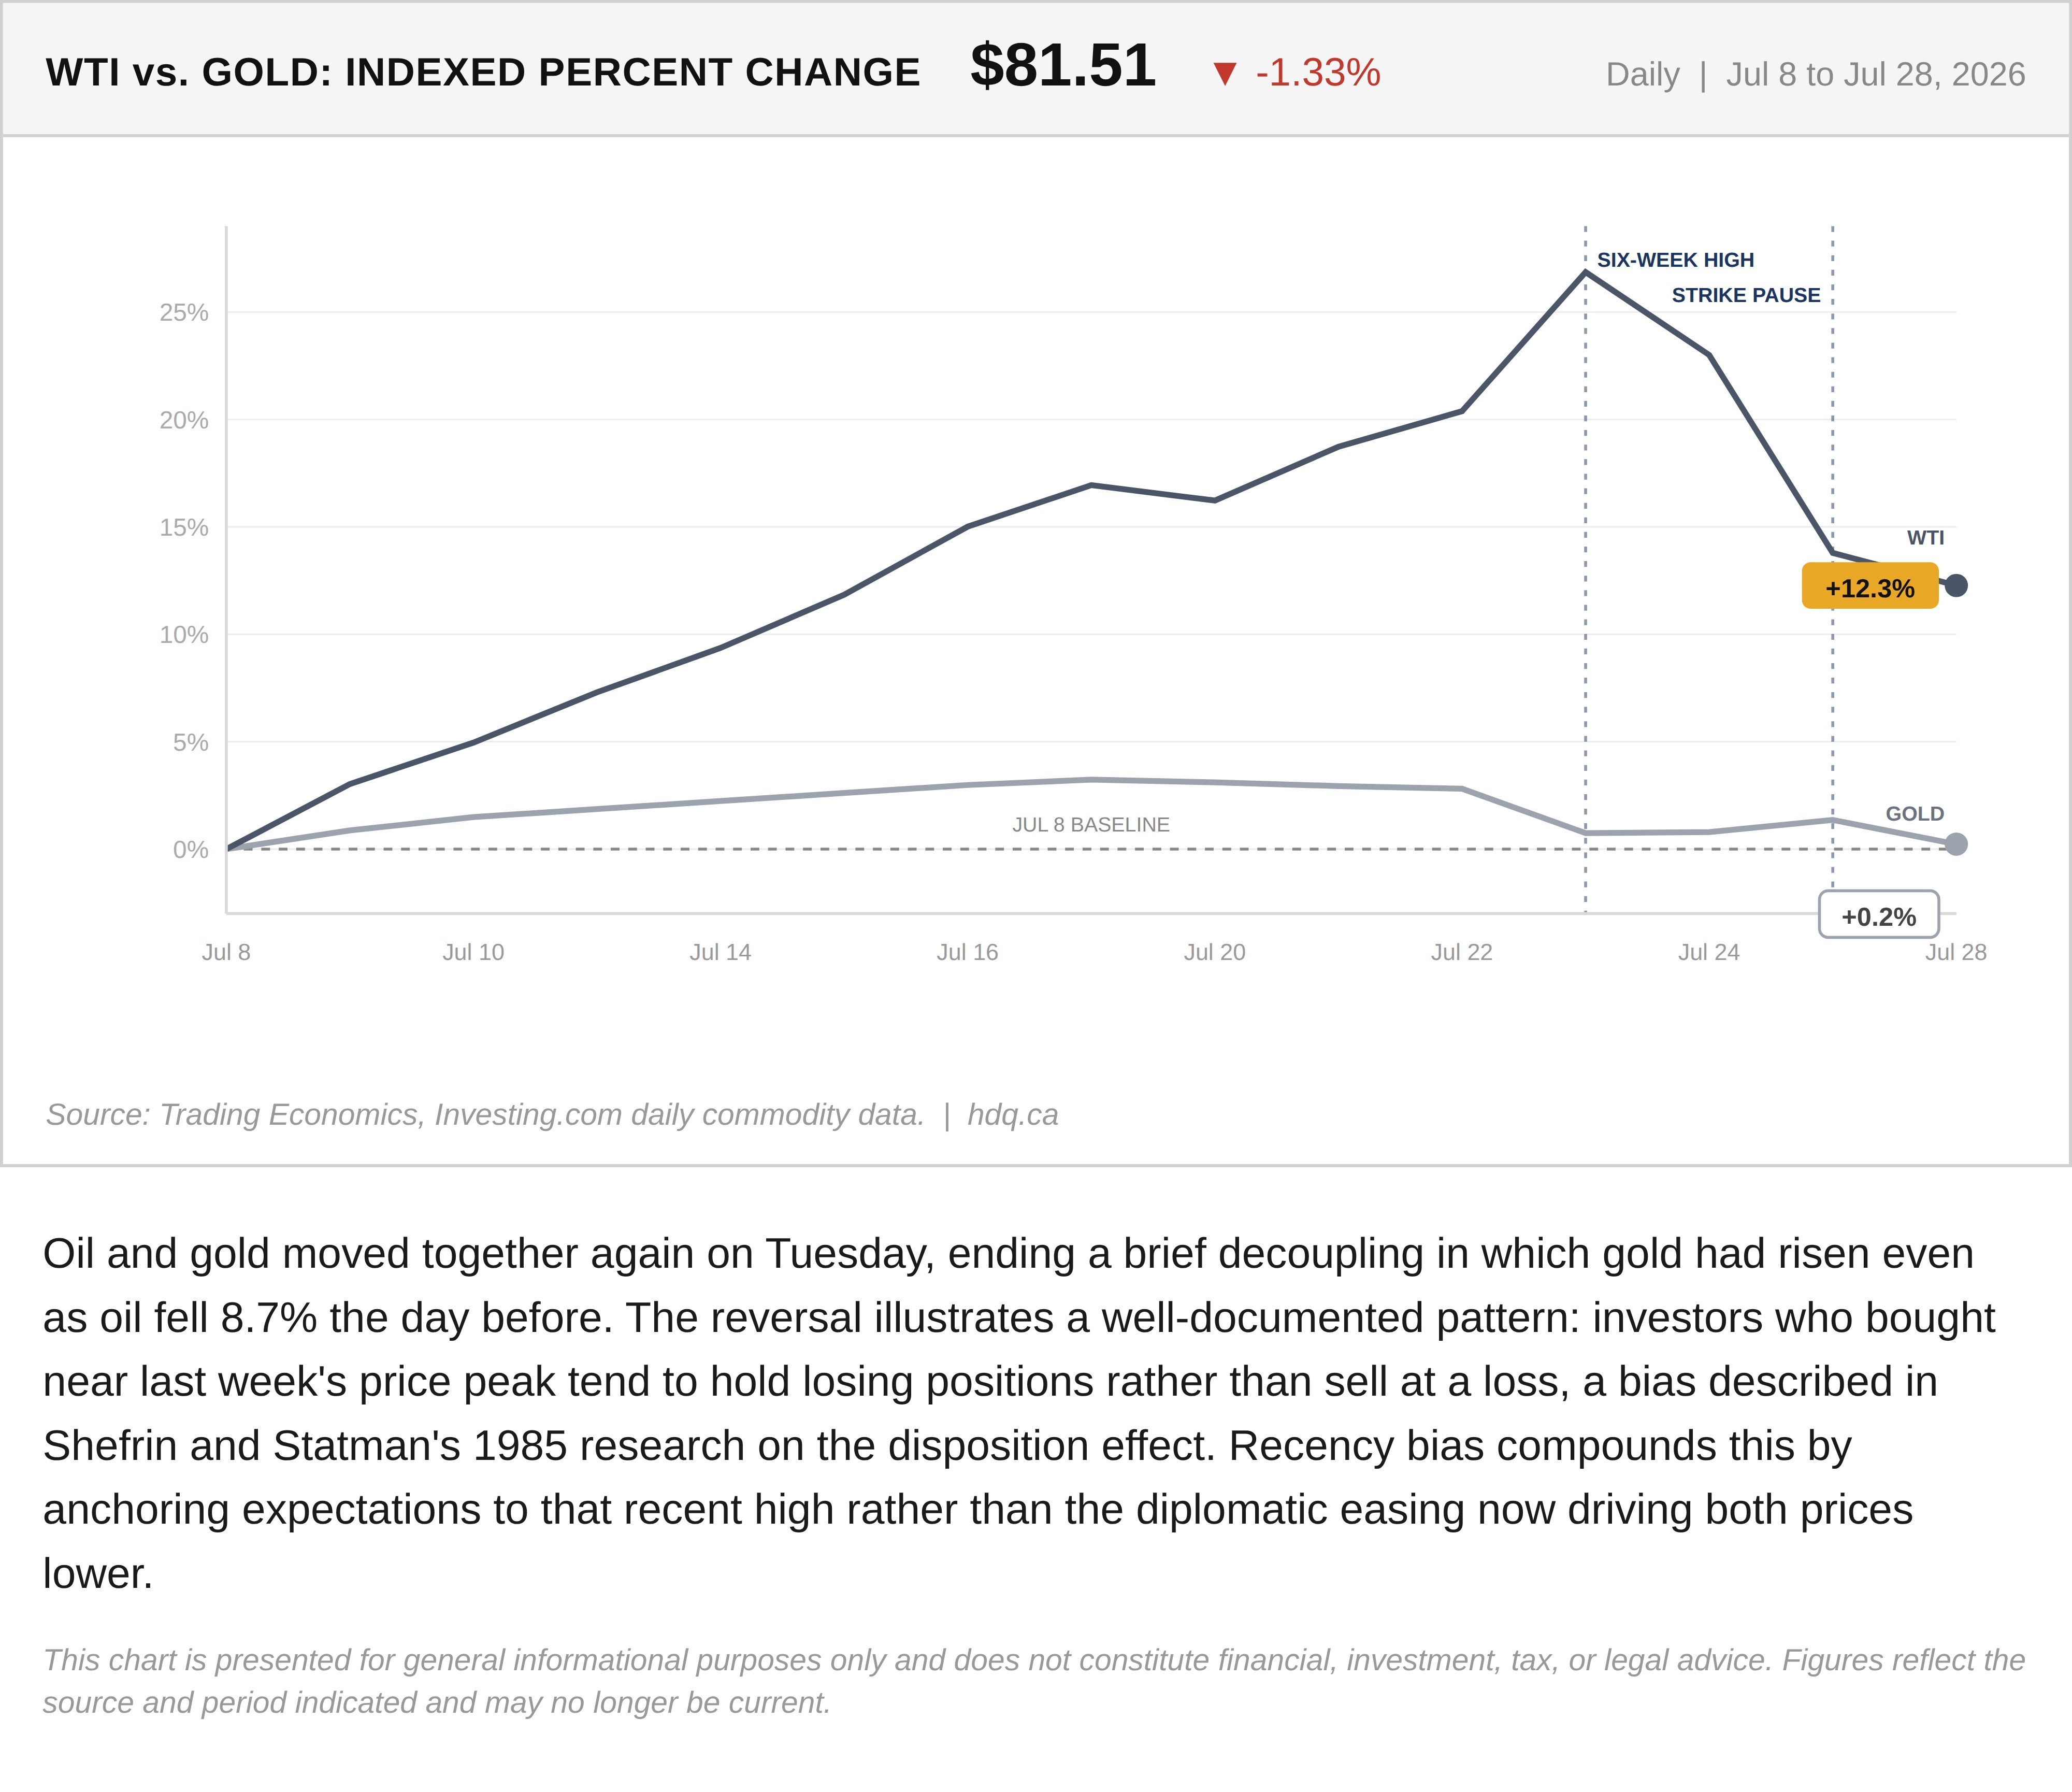
Oil and gold moved together again on Tuesday, ending a brief decoupling in which gold had risen even as oil fell 8.7% the day before. The reversal illustrates a well-documented pattern: investors who bought near last week's price peak tend to hold losing positions rather than sell at a loss, a bias described in Shefrin and Statman's 1985 research on the disposition effect. Recency bias compounds this by anchoring expectations to that recent high rather than the diplomatic easing now driving both prices lower.
This chart is presented for general informational purposes only and does not constitute financial, investment, tax, or legal advice. Figures reflect the source and period indicated and may no longer be current.
Related charts
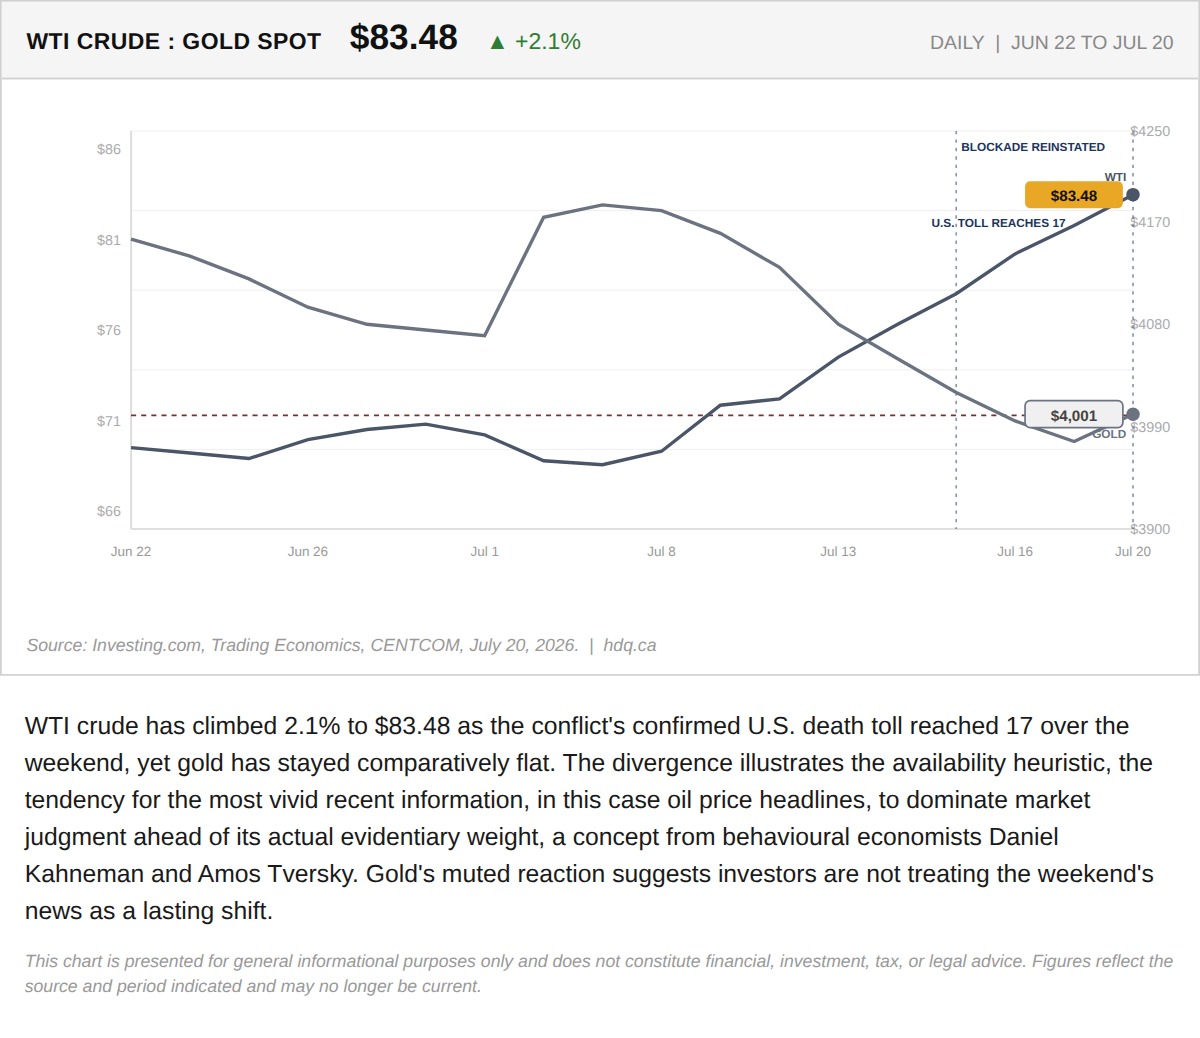
WTI crude has climbed 2.1% to $83.48 as the conflict's confirmed U.S.
Oil Spiked Past $85 as the War's U.S. Death Toll Hit 17. It Gave Back Most of the Move by Noon.
July 20, 2026
View chart & download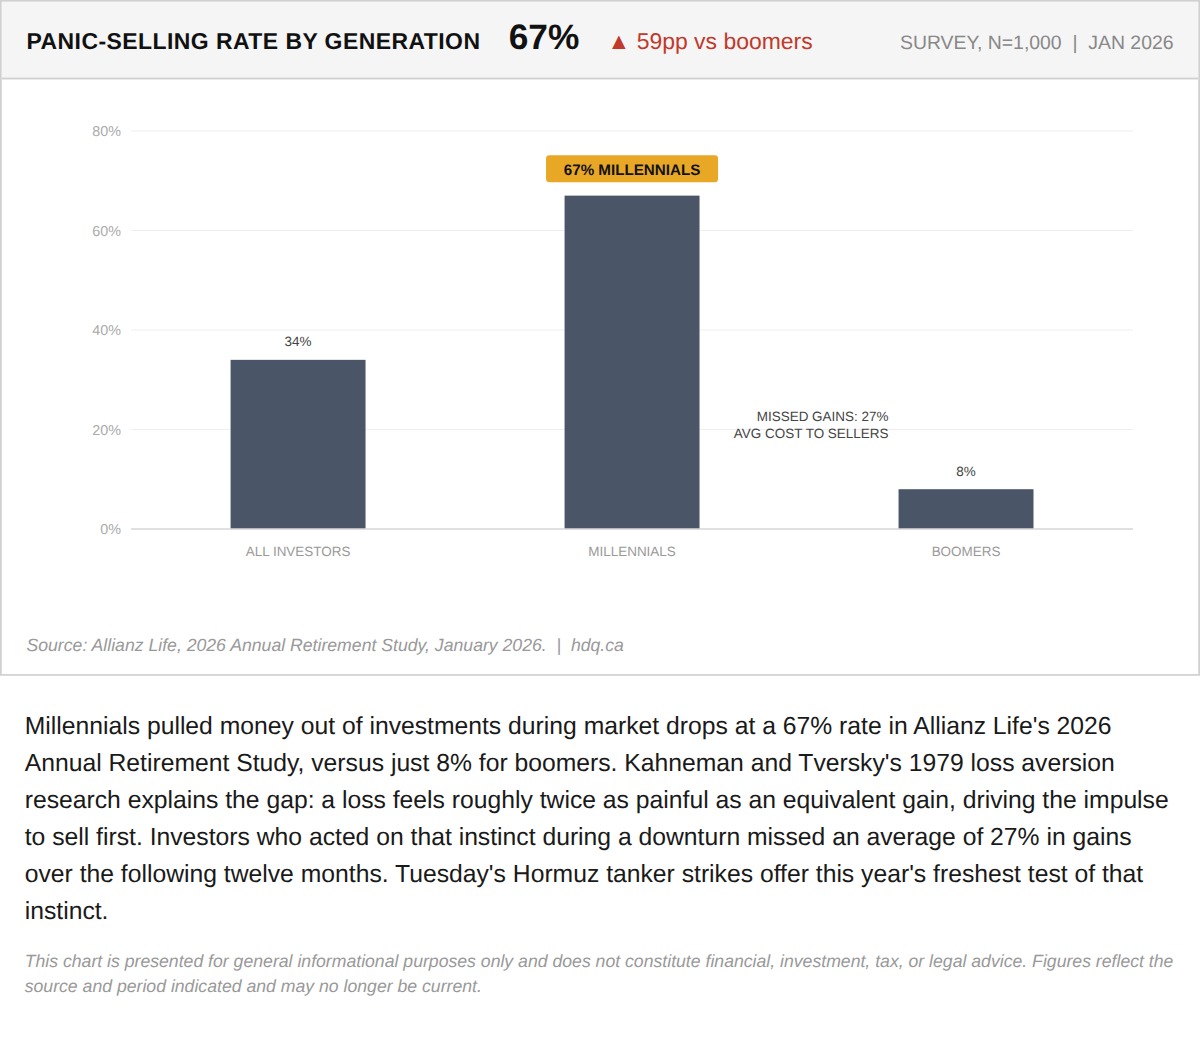
Millennials pulled money out of investments during market drops at a 67% rate in Allianz Life's 2026 Annual Retirement Study, versus just 8% for boomers.
Why Millennials Panic-Sell Eight Times More Than Boomers
September 1, 2026
View chart & download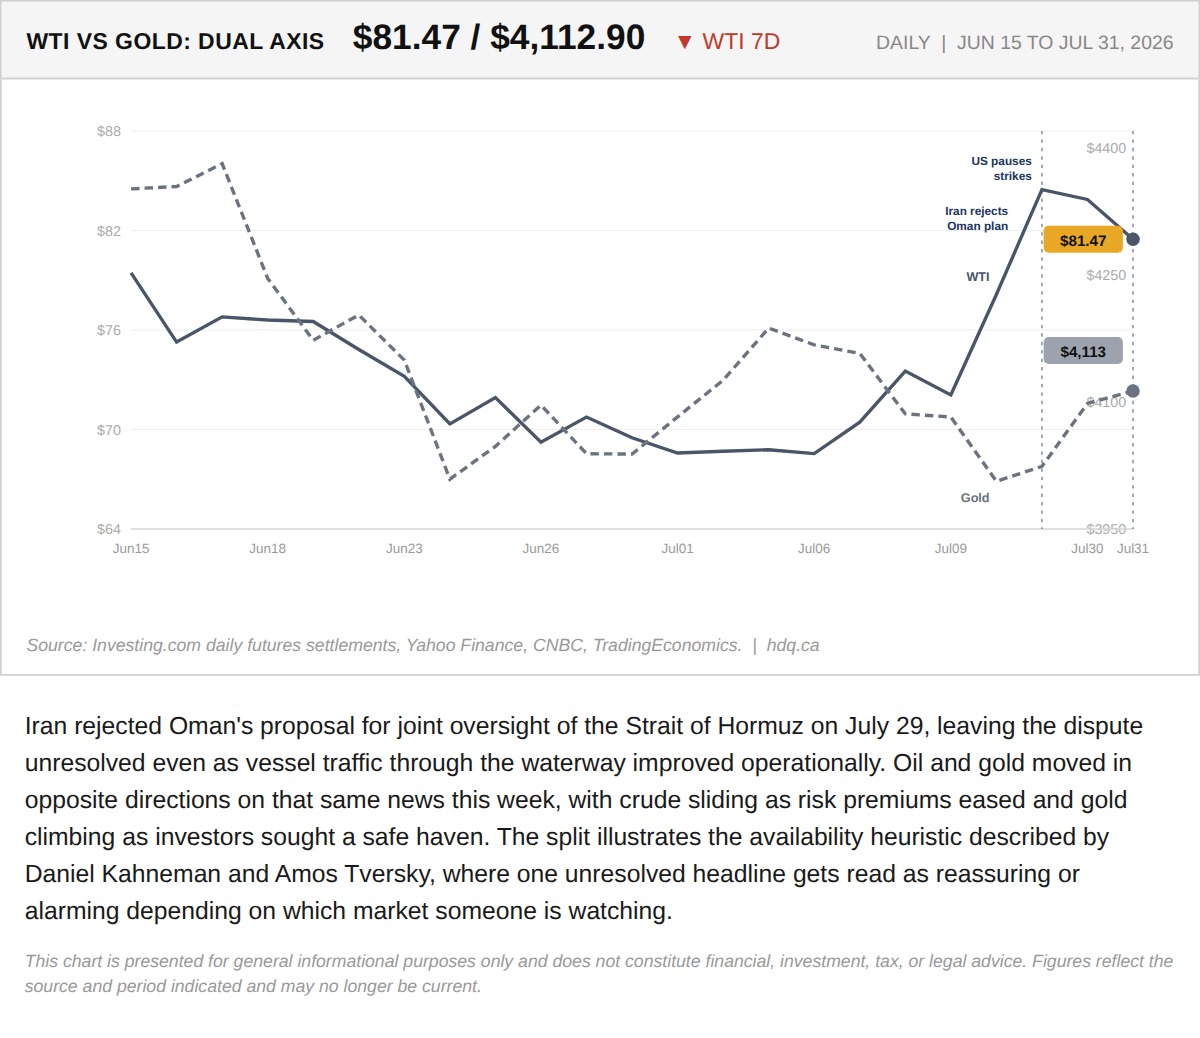
Iran rejected Oman's proposal for joint oversight of the Strait of Hormuz on July 29, leaving the dispute unresolved even as vessel traffic…
Oil Fell 9.5% This Week. Gold Rose Through $4,100. Same Headline Did Both.
July 31, 2026
View chart & download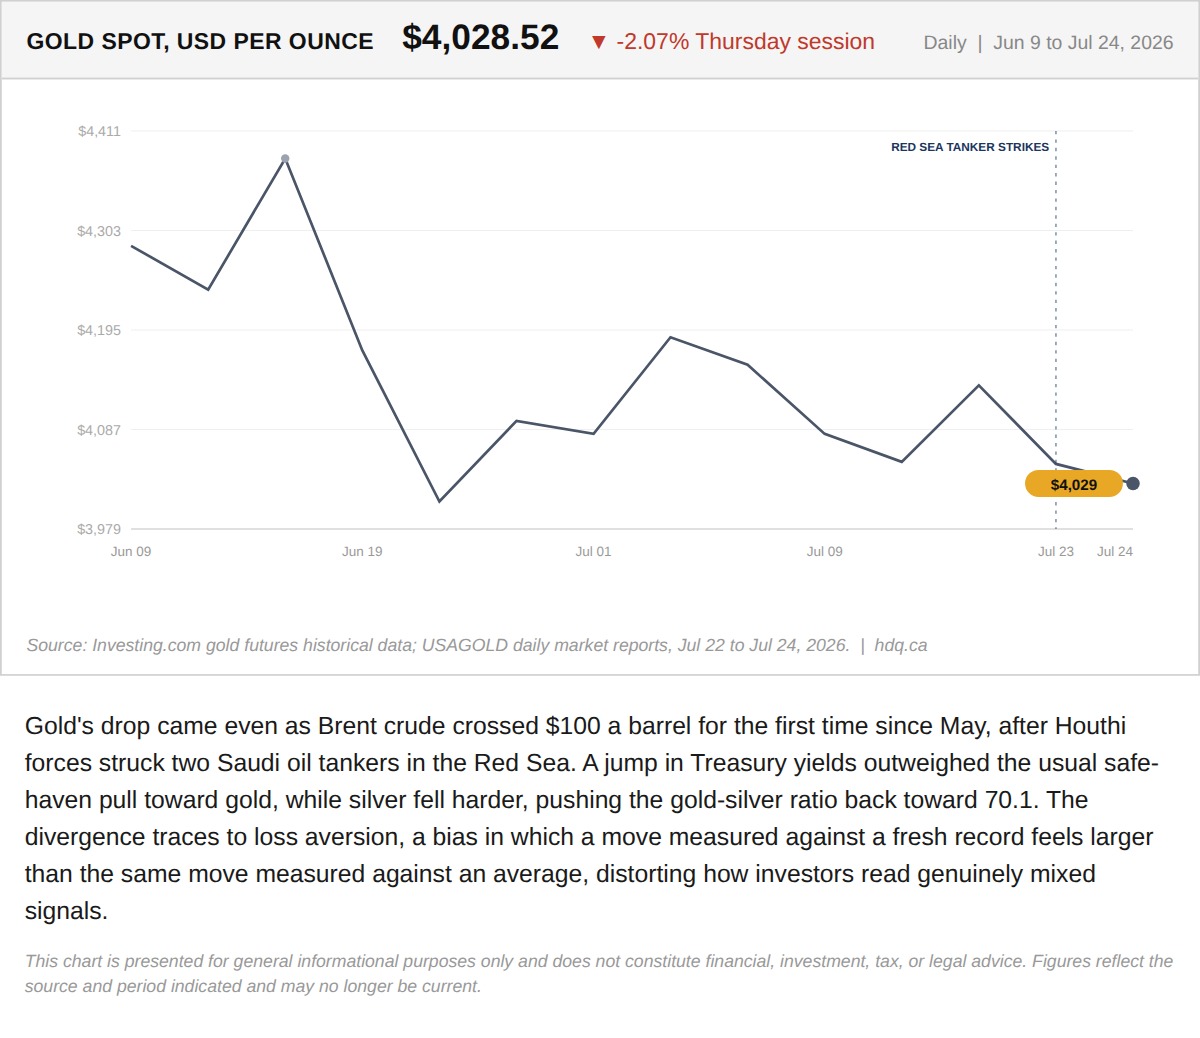
Gold's drop came even as Brent crude crossed $100 a barrel for the first time since May, after Houthi forces struck two Saudi oil tankers in the Red Sea.
Record High, Sharp Reversal: A Lesson in Loss Aversion
July 24, 2026
View chart & download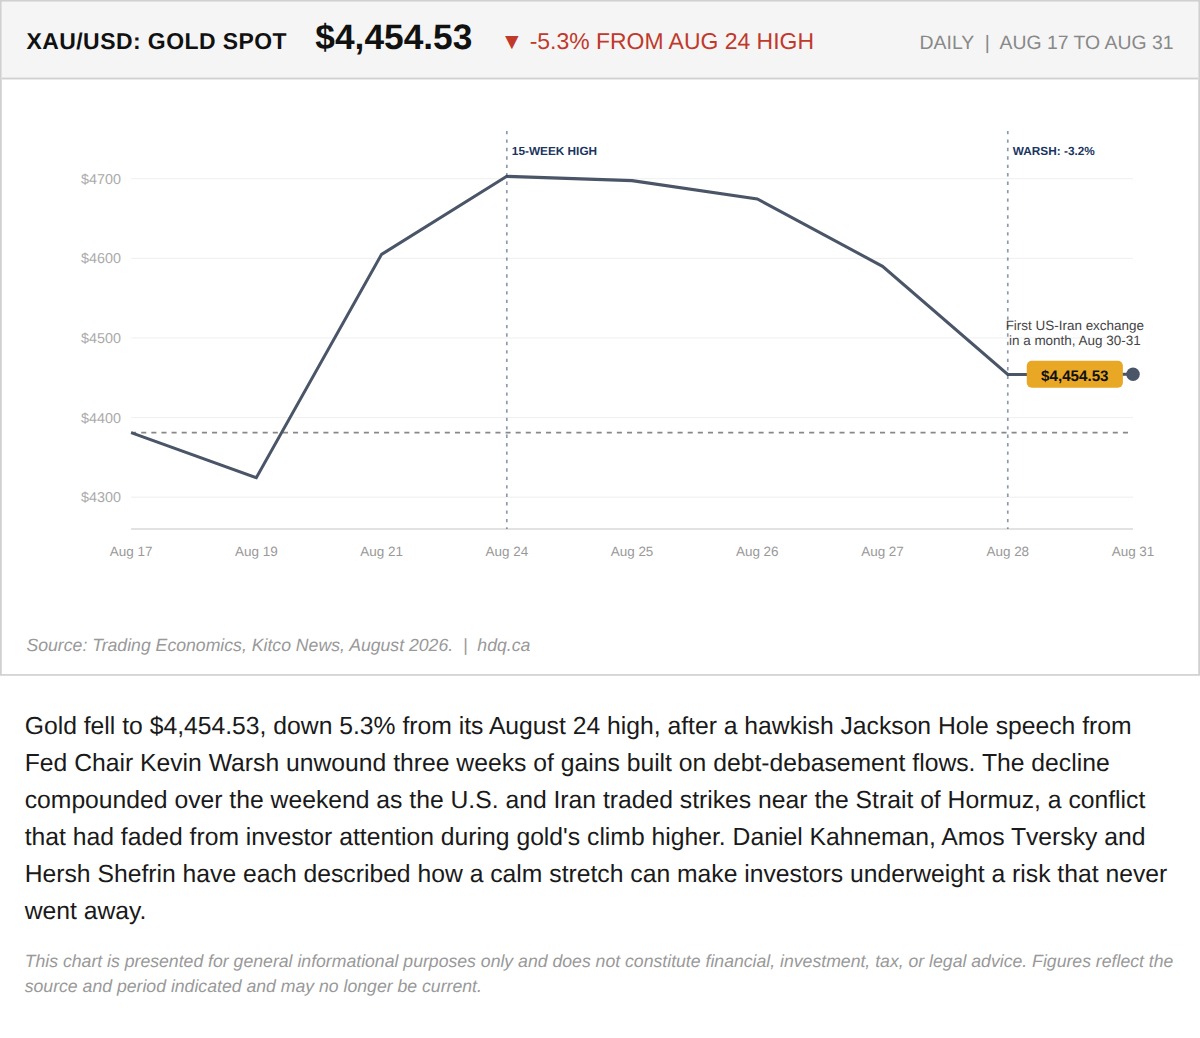
Gold fell to $4,454.53, down 5.3% from its August 24 high, after a hawkish Jackson Hole speech from Fed Chair Kevin Warsh unwound three weeks of gains built on debt-debasement flows.
Gold's Quiet Climb to a 15-Week High Hid the Risk That Just Came Back
August 31, 2026
View chart & download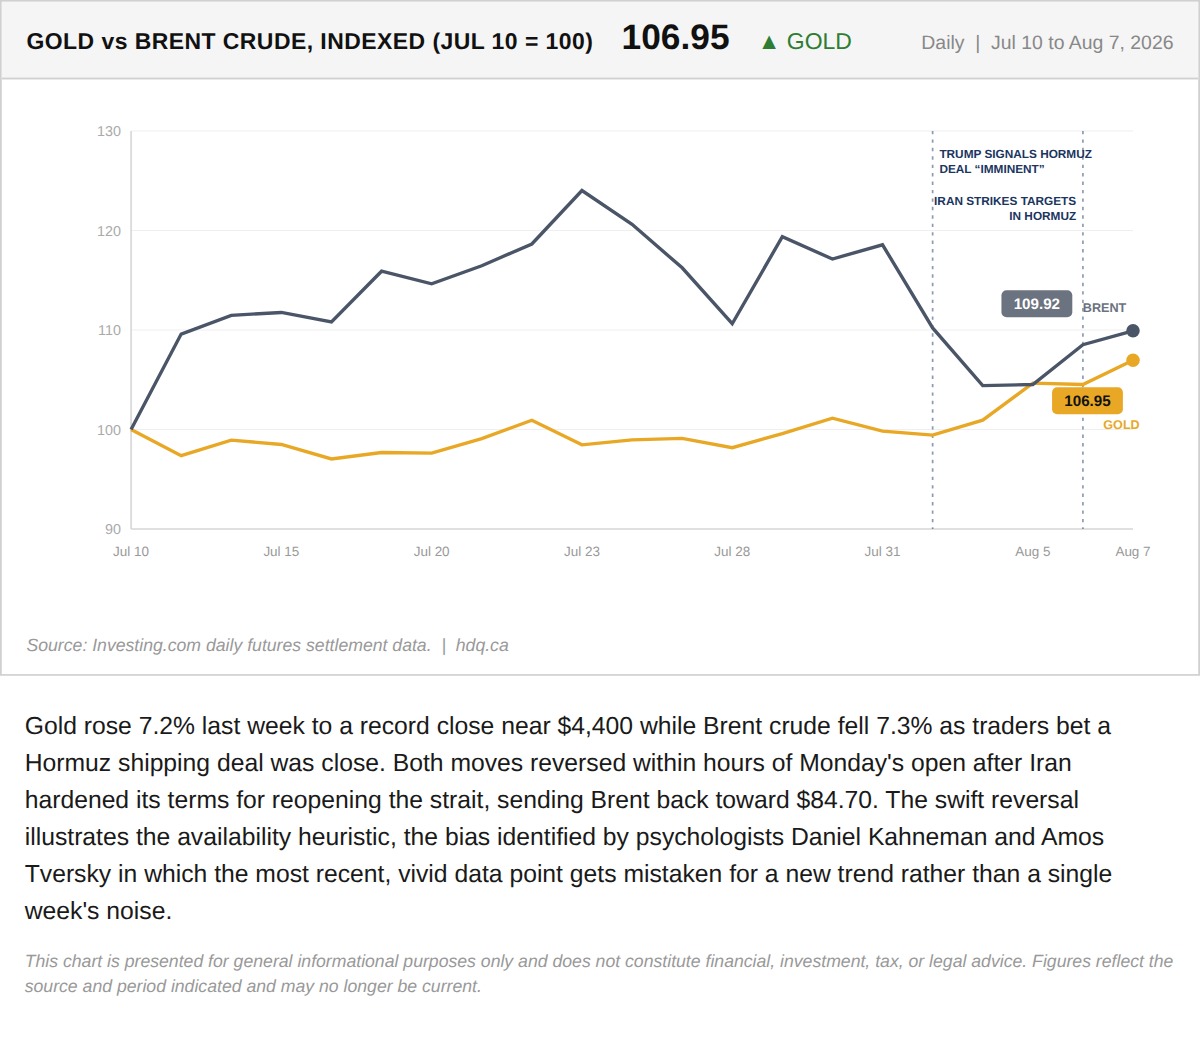
Gold rose 7.2% last week to a record close near $4,400 while Brent crude fell 7.3% as traders bet a Hormuz shipping deal was close.
Gold's Record Week Made the Story Feel Settled. Monday Already Disagrees.
August 10, 2026
View chart & download