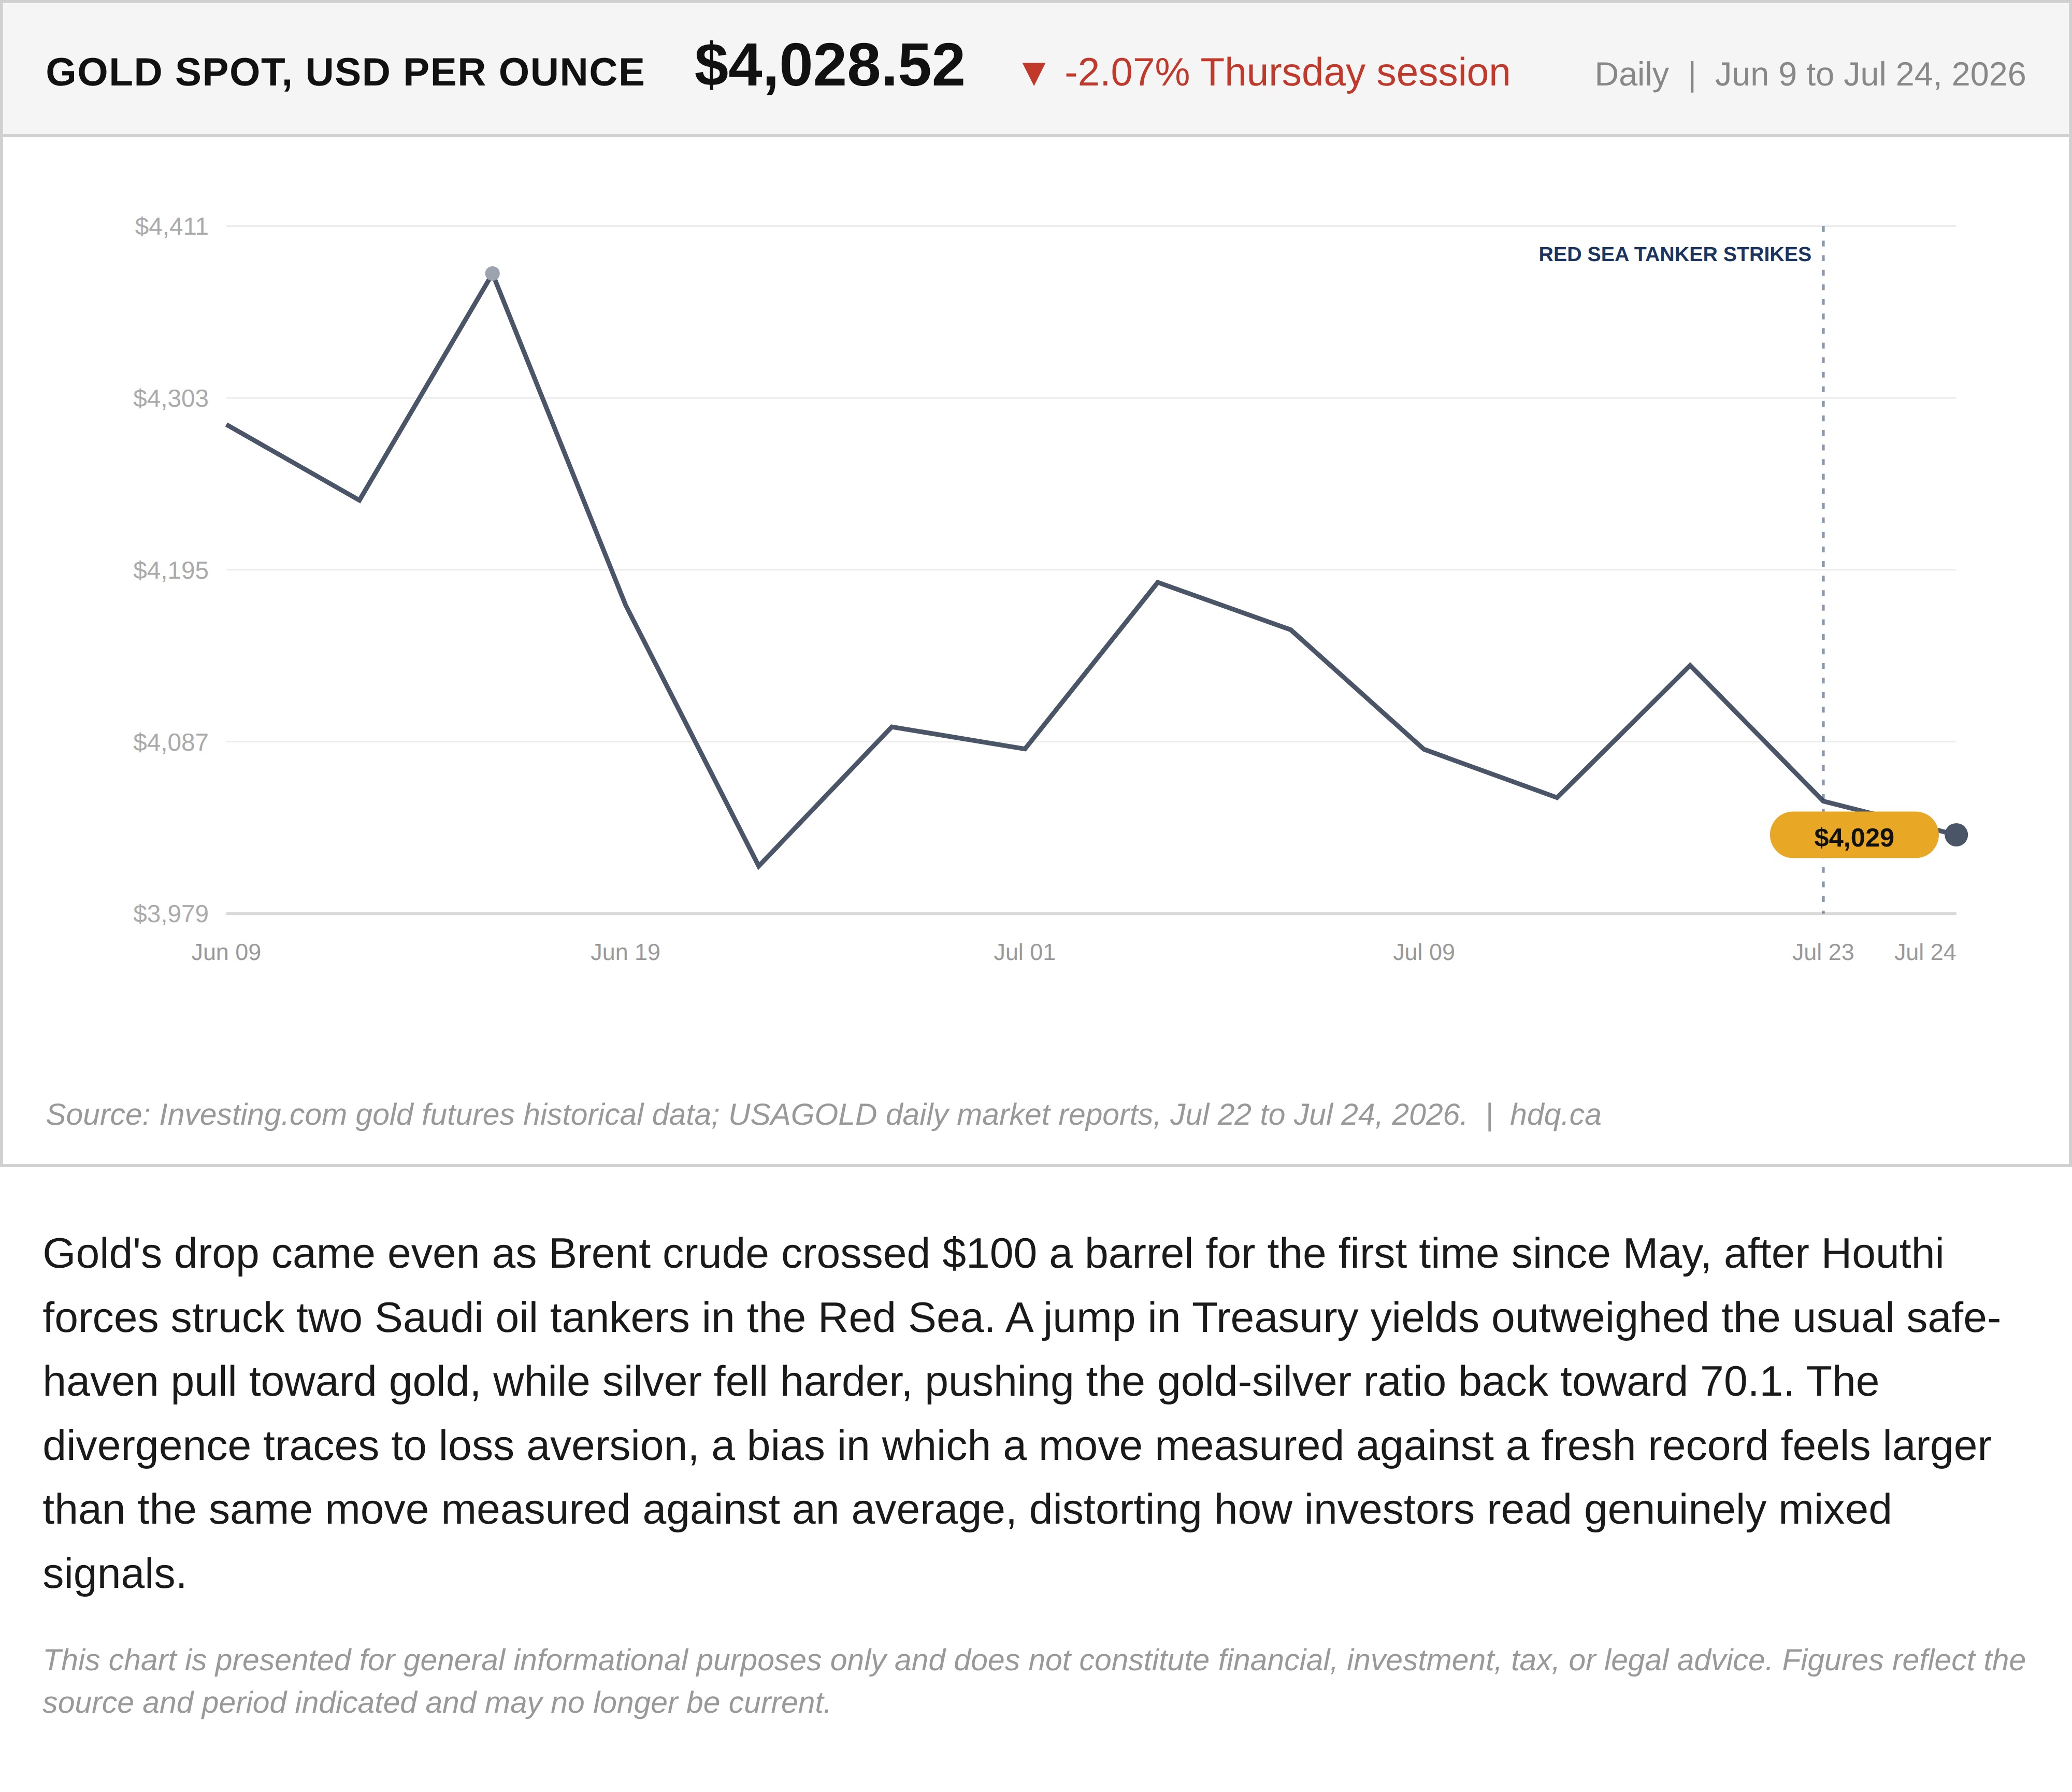
Gold's drop came even as Brent crude crossed $100 a barrel for the first time since May, after Houthi forces struck two Saudi oil tankers in the Red Sea. A jump in Treasury yields outweighed the usual safe-haven pull toward gold, while silver fell harder, pushing the gold-silver ratio back toward 70.1. The divergence traces to loss aversion, a bias in which a move measured against a fresh record feels larger than the same move measured against an average, distorting how investors read genuinely mixed signals.
This chart is presented for general informational purposes only and does not constitute financial, investment, tax, or legal advice. Figures reflect the source and period indicated and may no longer be current.

Related charts
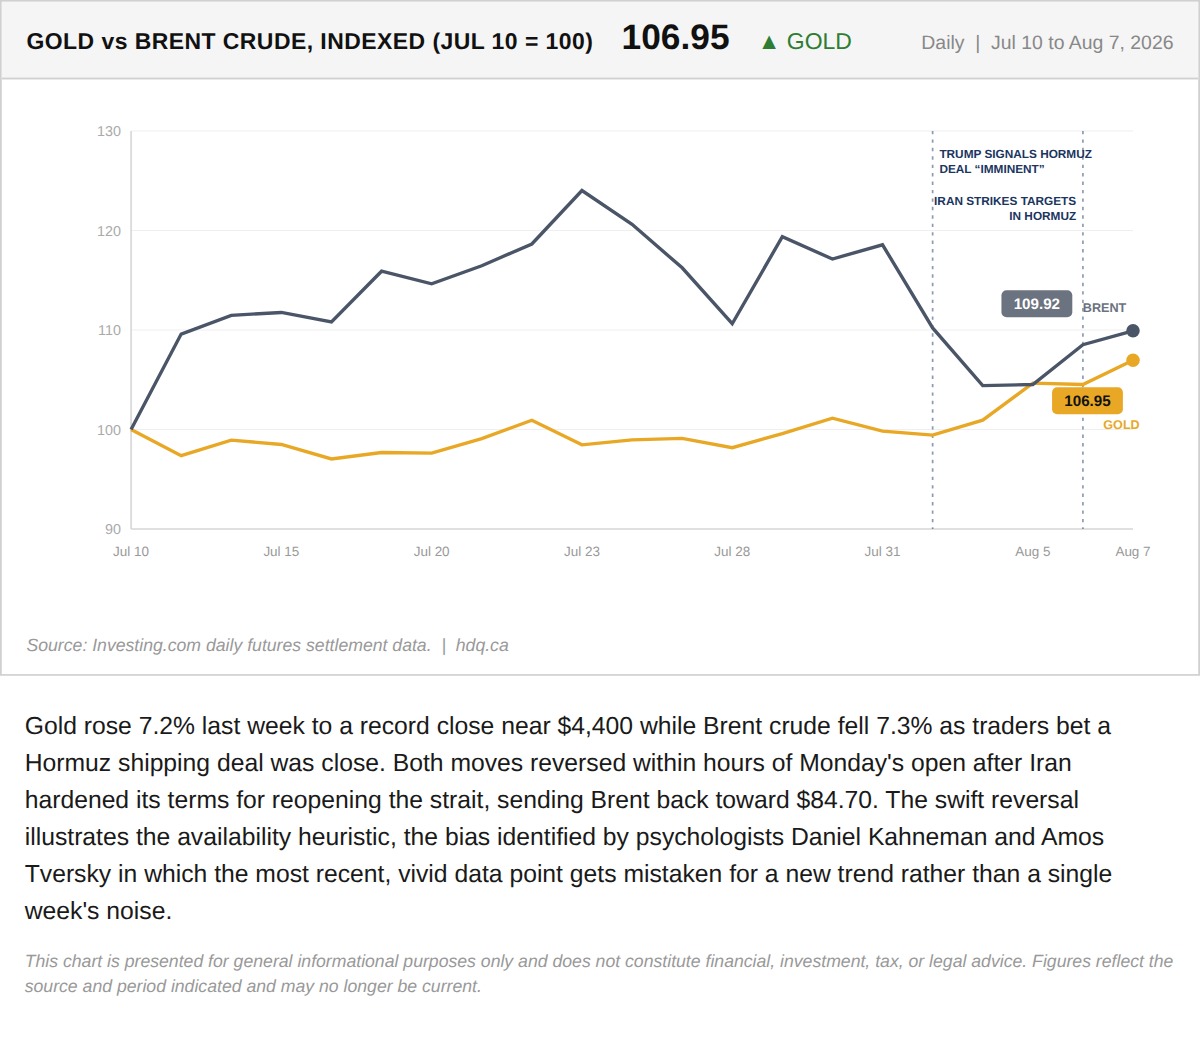
Gold rose 7.2% last week to a record close near $4,400 while Brent crude fell 7.3% as traders bet a Hormuz shipping deal was close.
Gold's Record Week Made the Story Feel Settled. Monday Already Disagrees.
August 10, 2026
View chart & download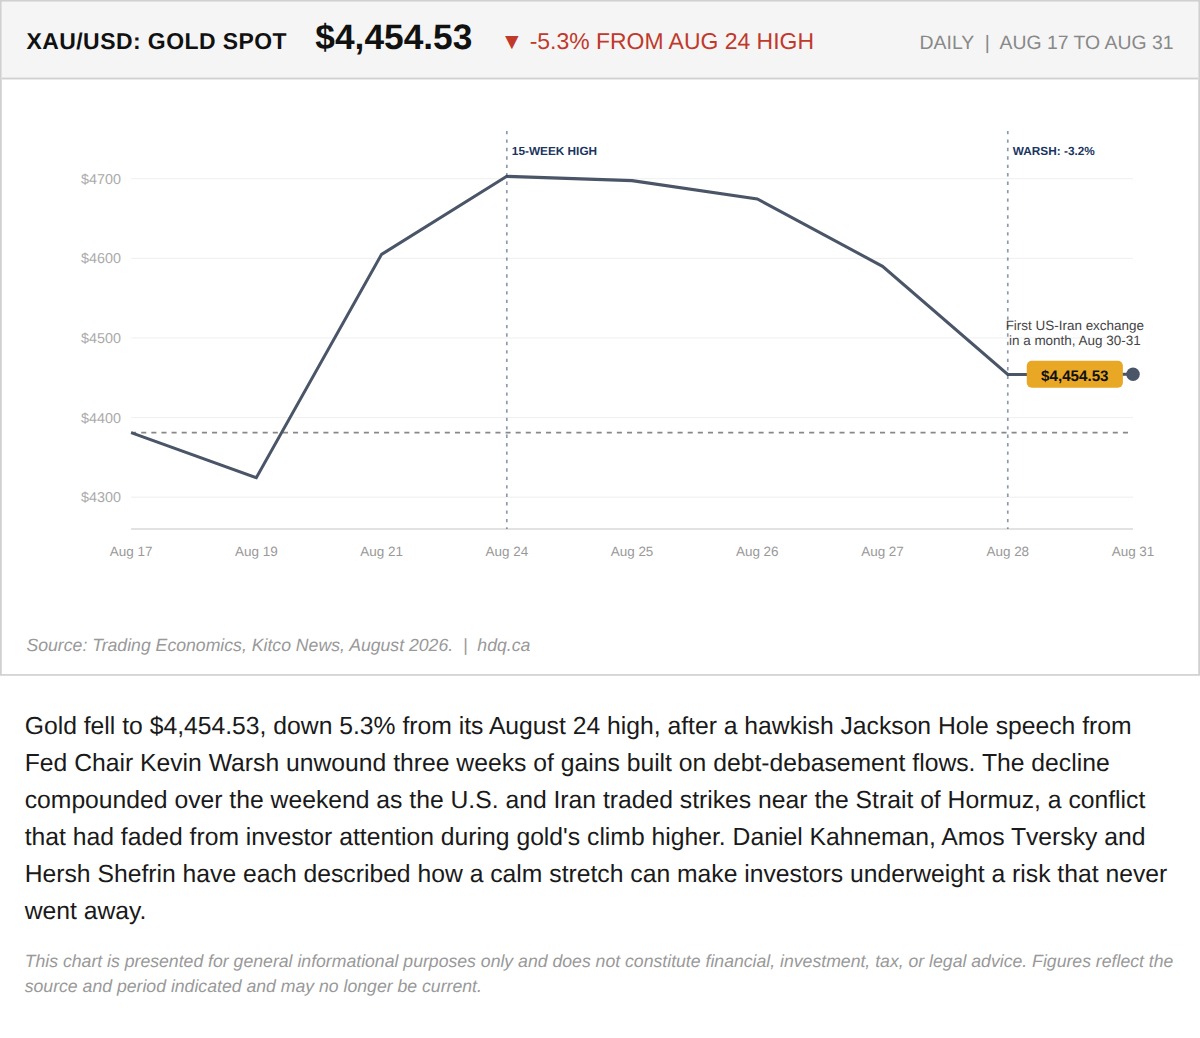
Gold fell to $4,454.53, down 5.3% from its August 24 high, after a hawkish Jackson Hole speech from Fed Chair Kevin Warsh unwound three weeks of gains built on debt-debasement flows.
Gold's Quiet Climb to a 15-Week High Hid the Risk That Just Came Back
August 31, 2026
View chart & download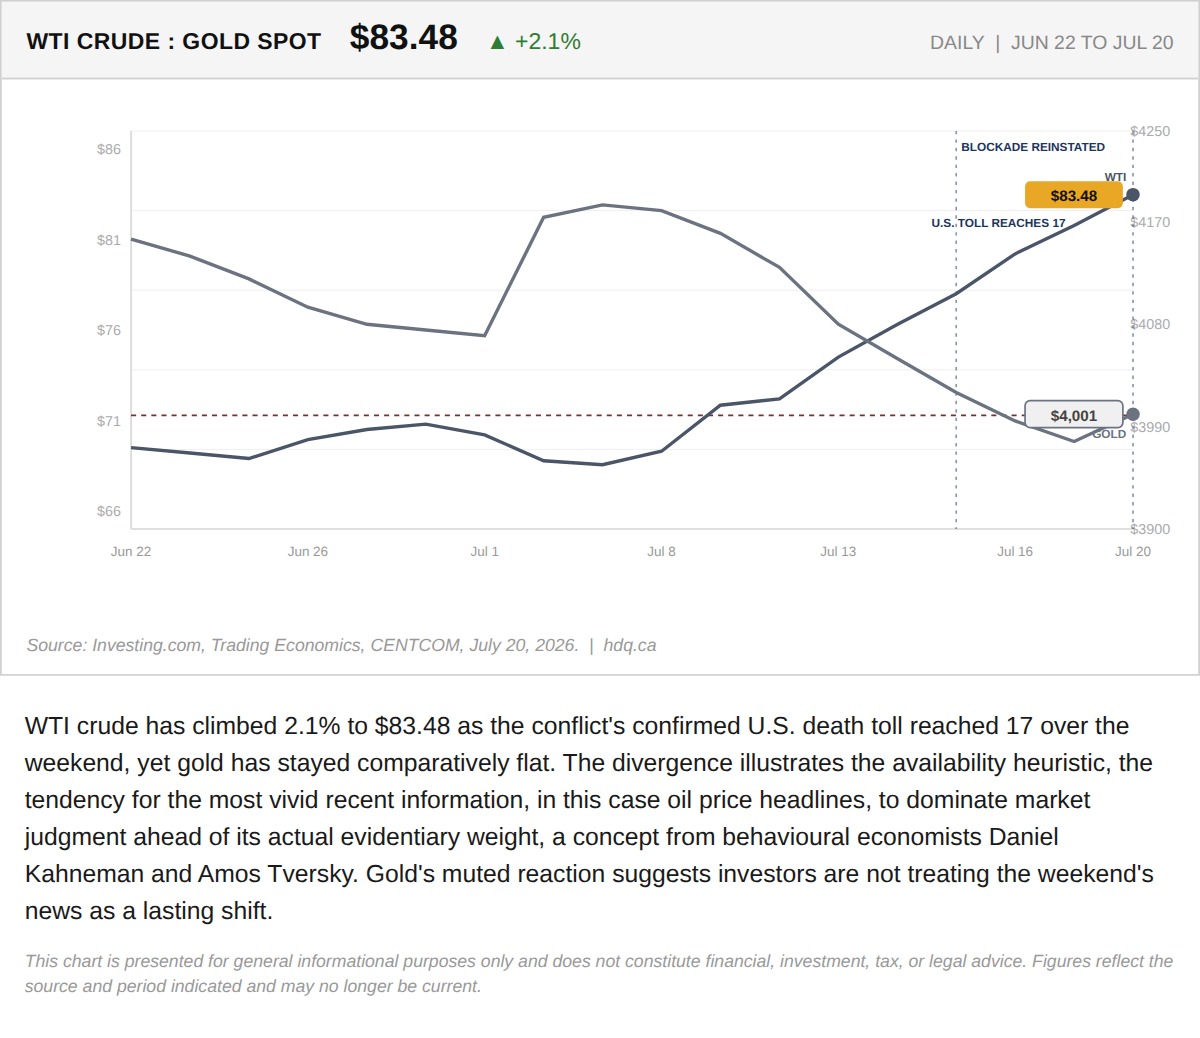
WTI crude has climbed 2.1% to $83.48 as the conflict's confirmed U.S.
Oil Spiked Past $85 as the War's U.S. Death Toll Hit 17. It Gave Back Most of the Move by Noon.
July 20, 2026
View chart & download
The S&P/TSX Composite closed July at 35,226, up 1.06% for the month, a modest headline figure that conceals sharp intra-month swings.
S&P/TSX Composite closes July up 1.06% after a volatile month
July 31, 2026
View chart & download
Brent and WTI crude both surged in July, with WTI ending the month at $85.47, up 23.0%, after round-tripping from a five-month low near $68.74.
WTI and Brent crude surge in July as the Iran ceasefire collapses
July 31, 2026
View chart & download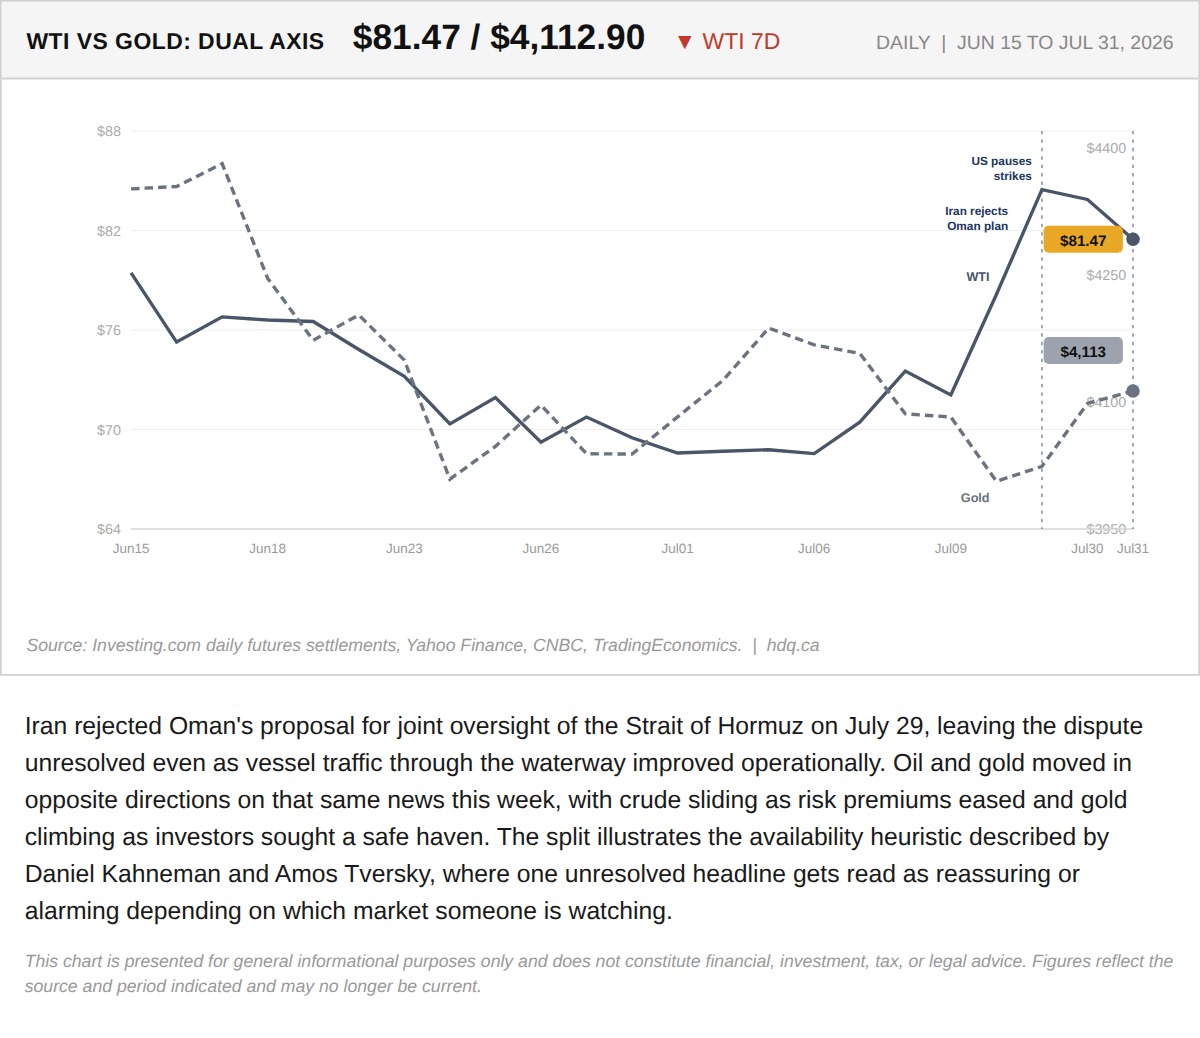
Iran rejected Oman's proposal for joint oversight of the Strait of Hormuz on July 29, leaving the dispute unresolved even as vessel traffic…
Oil Fell 9.5% This Week. Gold Rose Through $4,100. Same Headline Did Both.
July 31, 2026
View chart & download