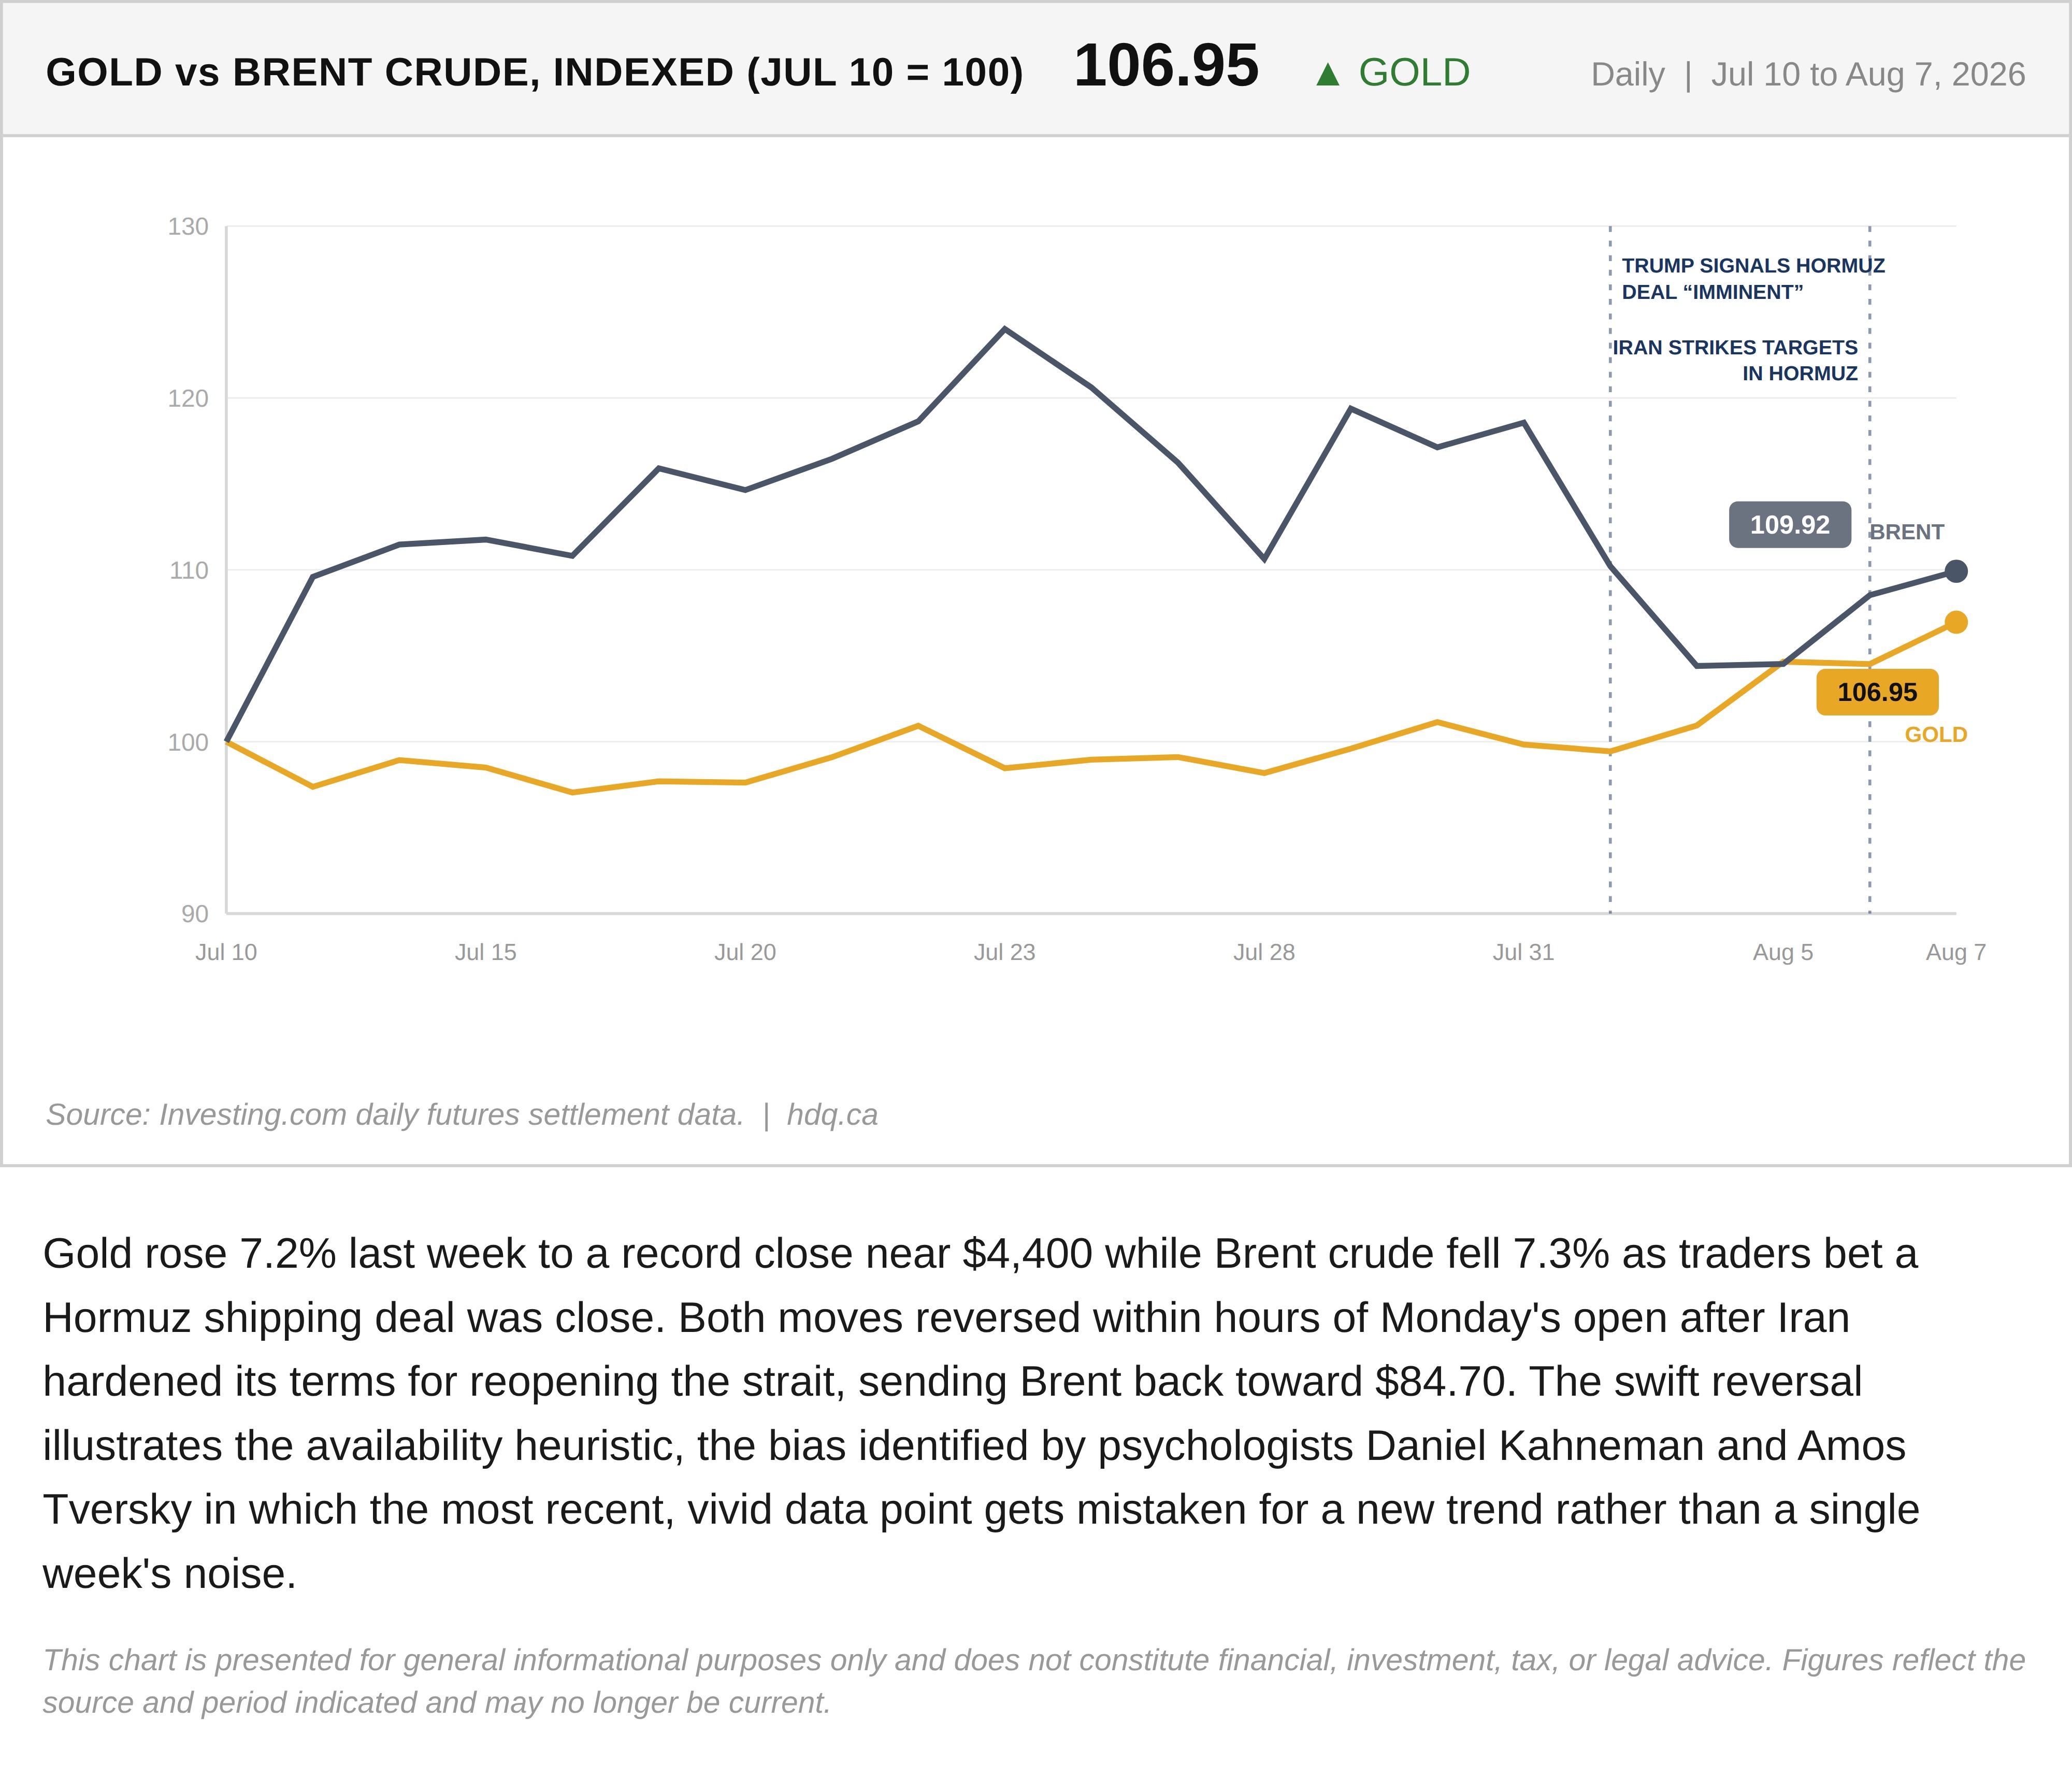
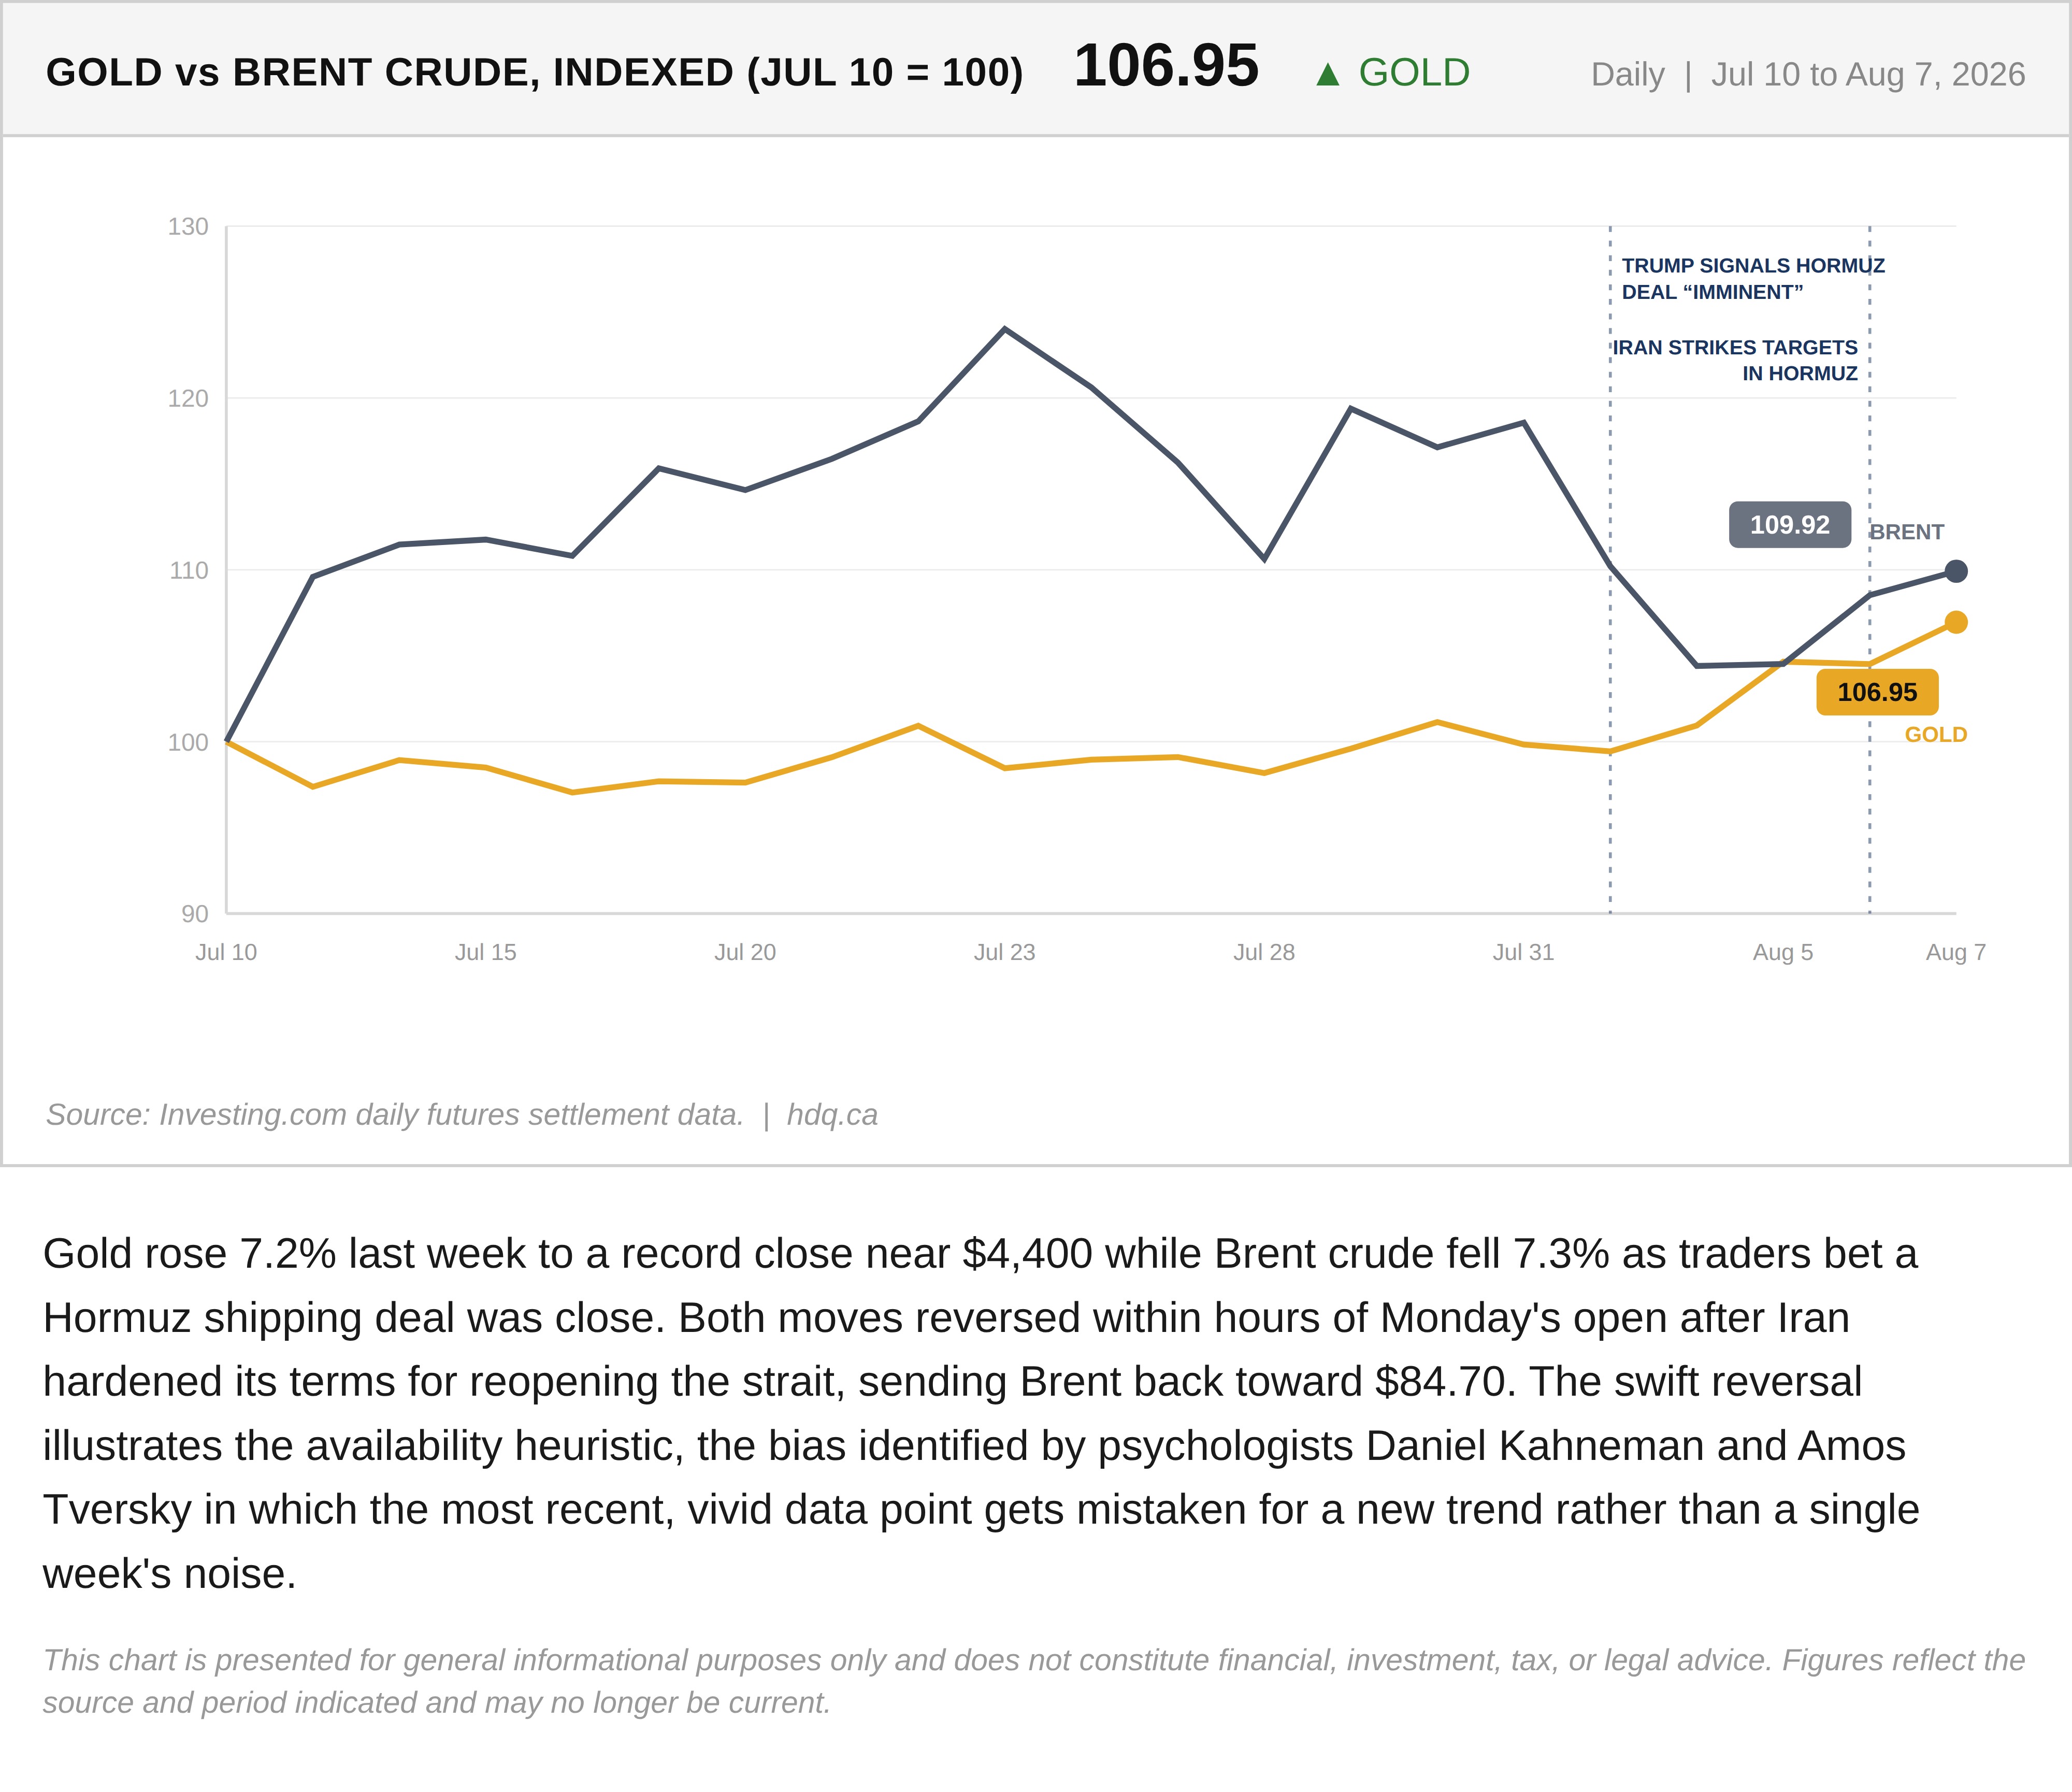
Gold rose 7.2% last week to a record close near $4,400 while Brent crude fell 7.3% as traders bet a Hormuz shipping deal was close. Both moves reversed within hours of Monday's open after Iran hardened its terms for reopening the strait, sending Brent back toward $84.70. The swift reversal illustrates the availability heuristic, the bias identified by psychologists Daniel Kahneman and Amos Tversky in which the most recent, vivid data point gets mistaken for a new trend rather than a single week's noise.
This chart is presented for general informational purposes only and does not constitute financial, investment, tax, or legal advice. Figures reflect the source and period indicated and may no longer be current.
Related charts
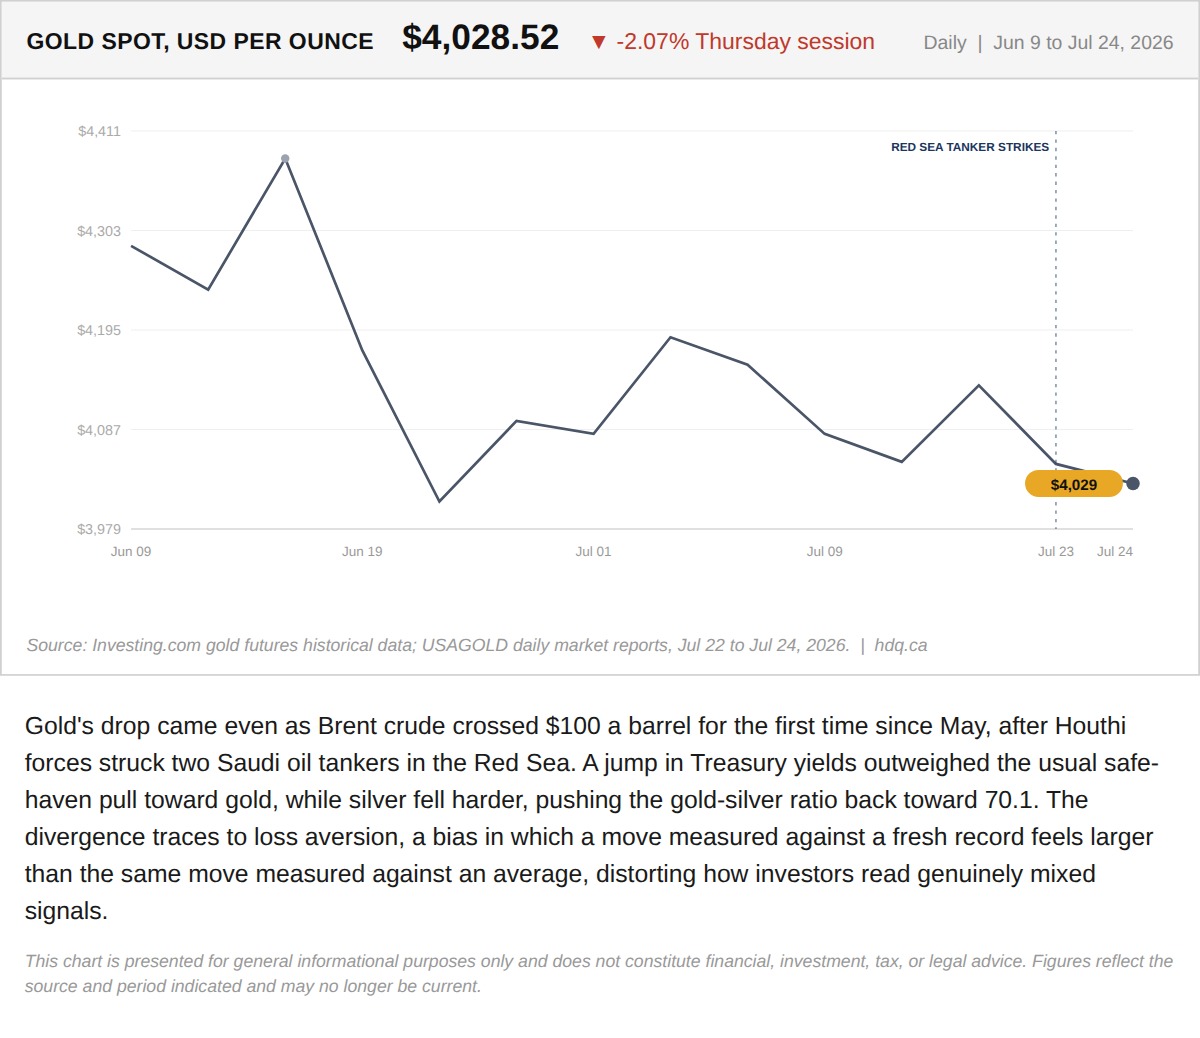
Gold's drop came even as Brent crude crossed $100 a barrel for the first time since May, after Houthi forces struck two Saudi oil tankers in the Red Sea.
Record High, Sharp Reversal: A Lesson in Loss Aversion
July 24, 2026
View chart & download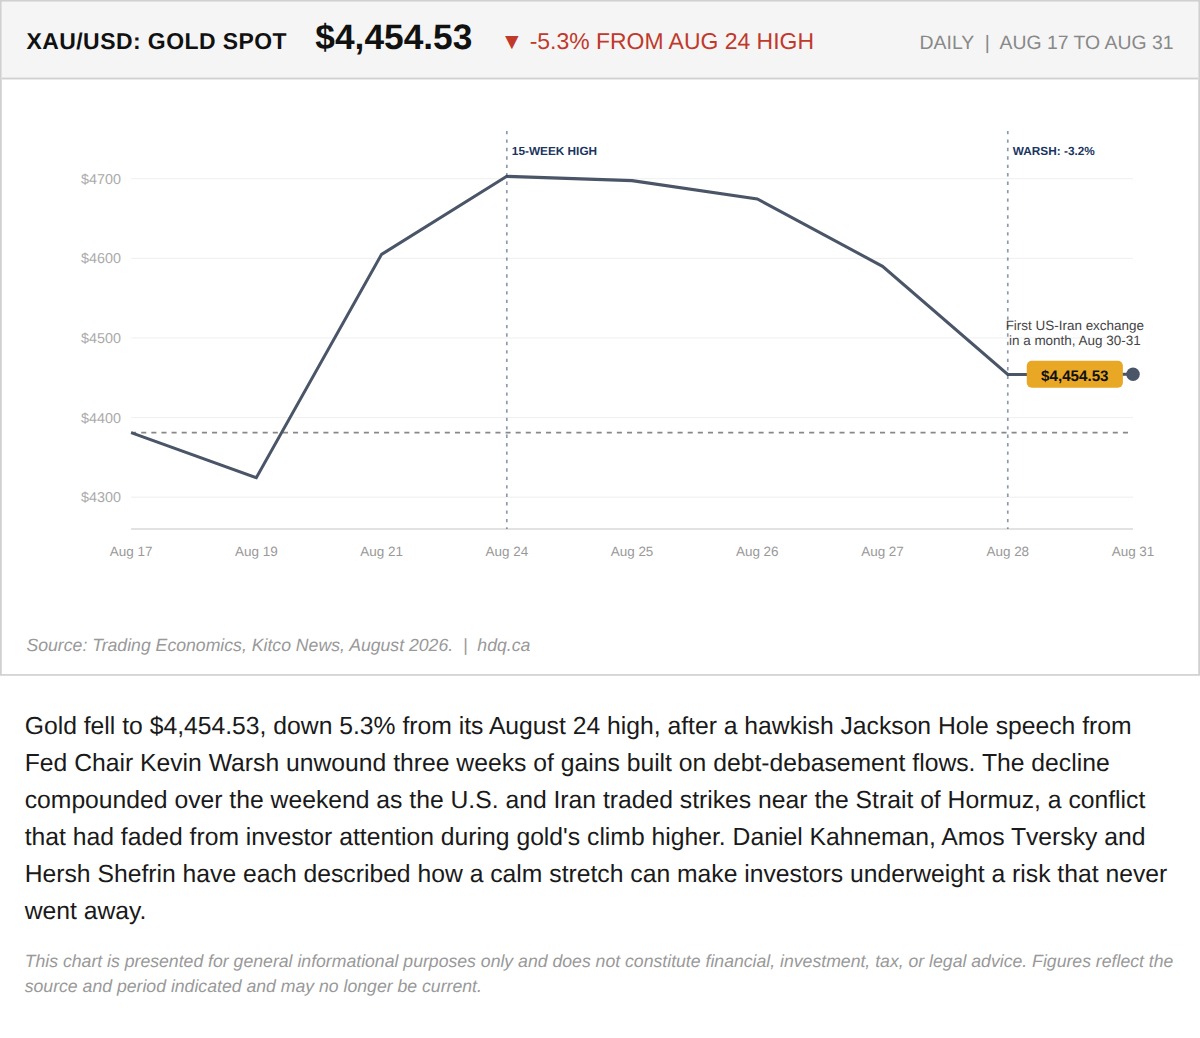
Gold fell to $4,454.53, down 5.3% from its August 24 high, after a hawkish Jackson Hole speech from Fed Chair Kevin Warsh unwound three weeks of gains built on debt-debasement flows.
Gold's Quiet Climb to a 15-Week High Hid the Risk That Just Came Back
August 31, 2026
View chart & download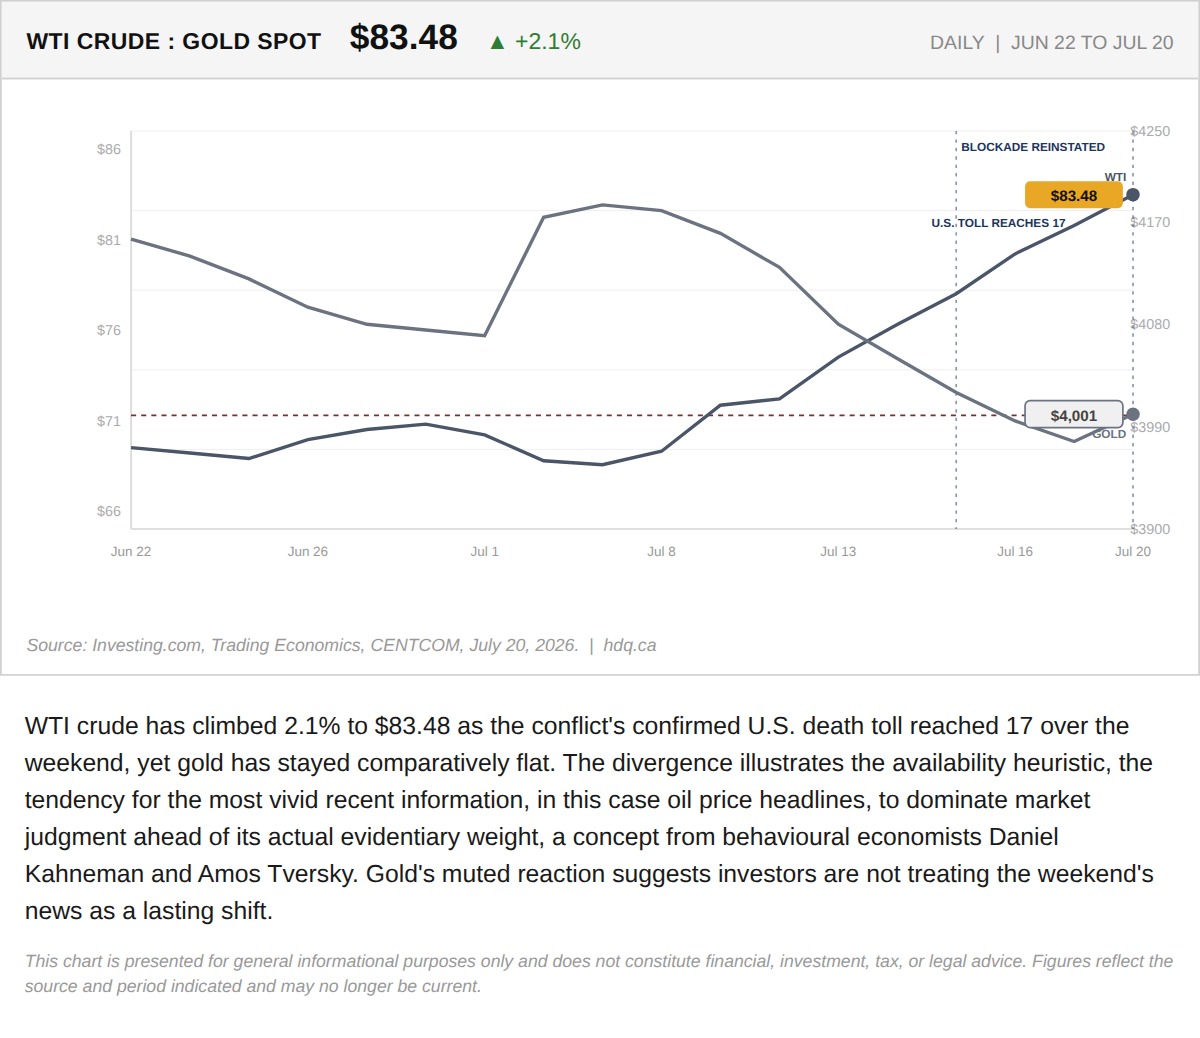
WTI crude has climbed 2.1% to $83.48 as the conflict's confirmed U.S.
Oil Spiked Past $85 as the War's U.S. Death Toll Hit 17. It Gave Back Most of the Move by Noon.
July 20, 2026
View chart & download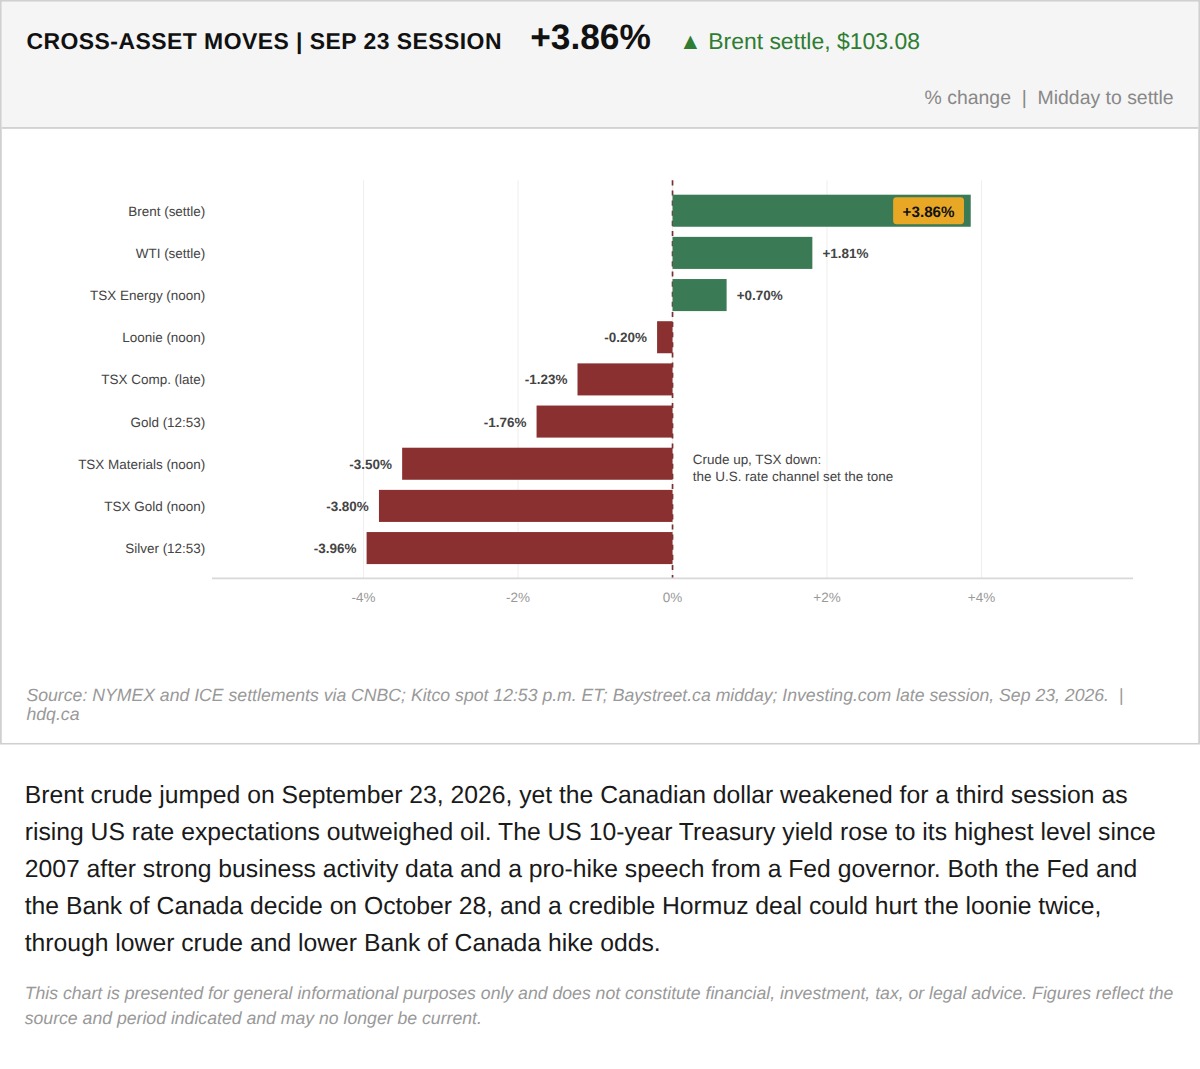
Brent crude jumped on September 23, 2026, yet the Canadian dollar weakened for a third session as rising US rate expectations outweighed oil.
Brent Jumps While the Canadian Dollar and TSX Fall in the September 23 Session
September 23, 2026
View chart & download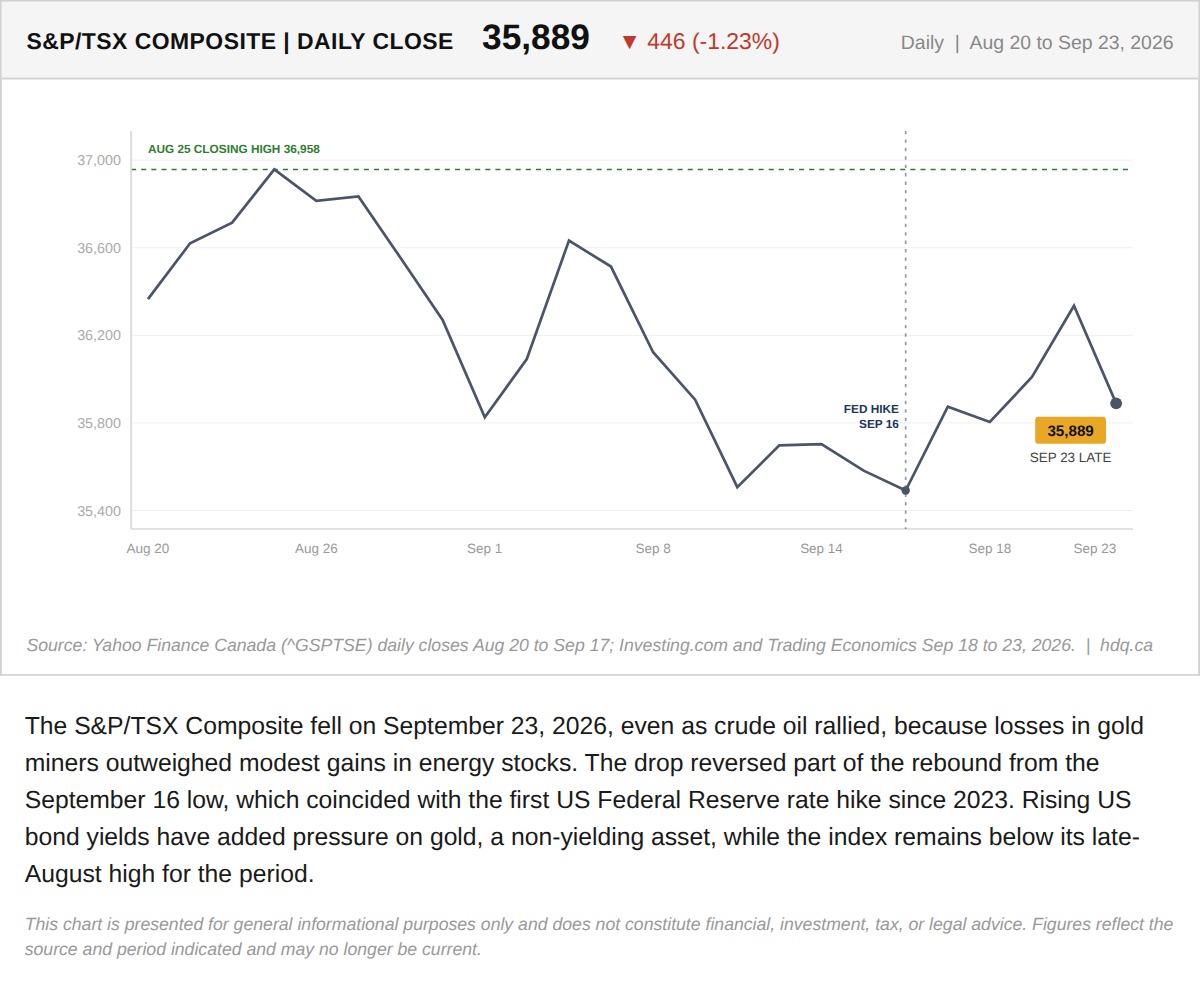
The S&P/TSX Composite fell on September 23, 2026, even as crude oil rallied, because losses in gold miners outweighed modest gains in energy stocks.
TSX Composite Falls Despite an Oil Rally as Gold Stocks Slide
September 23, 2026
View chart & download
The S&P/TSX Composite closed July at 35,226, up 1.06% for the month, a modest headline figure that conceals sharp intra-month swings.
S&P/TSX Composite closes July up 1.06% after a volatile month
July 31, 2026
View chart & download